EduNinja
IB Maths AI HL/Question Bank/5 Calculus

IB Maths AI HL5 CalculusQuestion Bank

HL110 questions10 previewsSyllabus linked
[Maximum number: 6]

This question is about modelling the spread of a computer virus to predict the number of computers in a city which will be infected by the virus.
A systems analyst defines the following variables in a model:
- t is the number of days since the first computer was infected by the virus.
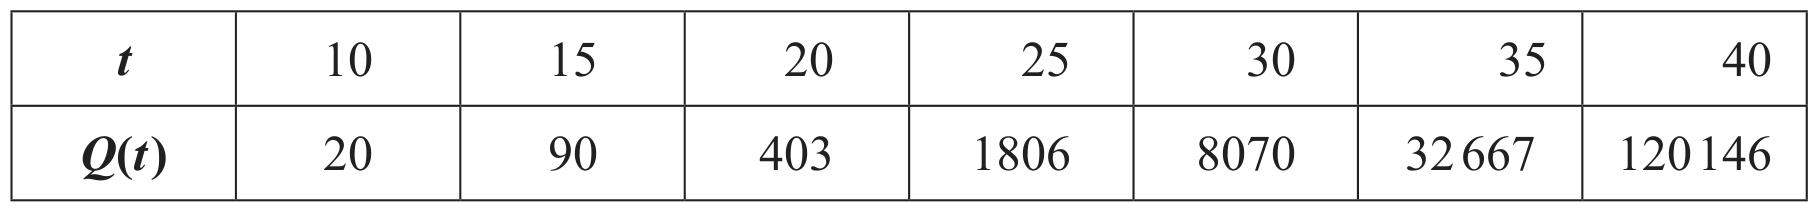
- Q(t) is the total number of computers that have been infected up to and including day t.
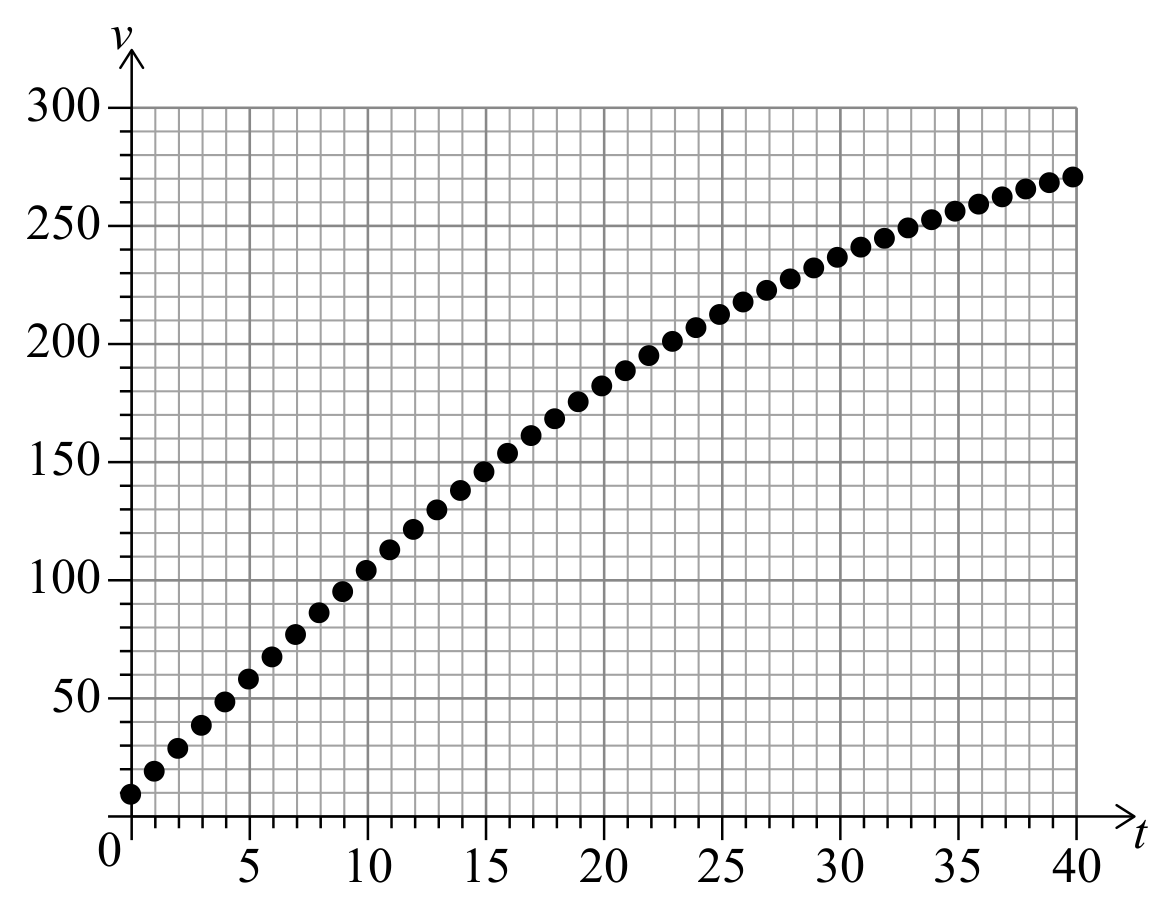
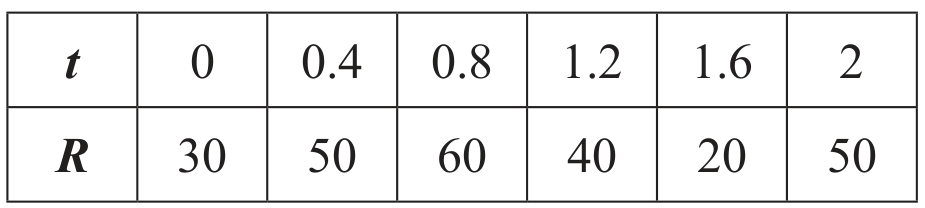
The following data were collected:

Table
(a)
(i)

Find the general solution of the differential equation Q(t)=βNQ(t)Q^{\prime}(t)=\beta N Q(t).

[ 4 ]
(b)

Use your answer from part (b)(ii) to estimate the time taken for the number of infected computers to double.

The data above are taken from city X which is estimated to have 2.6 million computers. The analyst looks at data for another city, Y. These data indicate a value of β=9.64×10⁸\beta=9.64 \times 10^{-8}.

[ 2 ]
[Maximum number: 6]

This question considers the optimal route between two points, separated by several regions where different speeds are possible.
Huw lives in a house, H , and he attends a school, S , where H and S are marked on the following diagram. The school is situated 1.2 km south and 4 km east of Huw's house. There is a boundary [MN], going from west to east, 0.4 km south of his house. The land north of [MN] is a field over which Huw runs at 15 kilometres per hour (kmh1)\left(\mathrm{km} \mathrm{h}^{-1}\right). The land south of [MN] is rough ground over which Huw walks at 5 km h15 \mathrm{~km} \mathrm{~h}^{-1}. The two regions are shown in the following diagram.

diagram not to scale

diagram not to scale

(a)

Huw realizes that his journey time could be reduced by taking a less direct route. He therefore defines a point P on [MN] that is x kmx \mathrm{~km} east of M. Huw decides to run from H to P and then walk from P to S . Let T(x) represent the time, in hours, taken by Huw to complete the journey along this route.

[ 3 ]
(i)

Hence determine the value of x that minimizes T(x).

[ 1 ]
(ii)

Find by how much Huw's journey time is reduced when he takes this optimal route, compared to travelling in a straight line from H to S . Give your answer correct to the nearest minute.

[ 2 ]
(b)
(i)

Determine an expression for the derivative T(x)T^{\prime}(x).

[ 3 ]
(ii)

Hence show that T(x) is minimized when

x0.16+x2=3(4x)0.64+(4x)2\frac{x}{\sqrt{0.16+x^{2}}}=\frac{3(4-x)}{\sqrt{0.64+(4-x)^{2}}}
[Maximum number: 12]

In this question you will use a historic method of calculating the cost of a barrel of wine to determine which shape of barrel gives the best value for money.
In Austria in the 17th century, one method for measuring the volume of a barrel of wine, and hence determining its cost, was by inserting a straight stick into a hole in the side, as shown in the following diagram, and measuring the length SD . The longer the length, the greater the cost to the customer.

Question image

Let SD be d metres and the cost be C gulden (the local currency at the time). When the length of SD was 0.5 metres, the cost was 0.80 gulden.

(a)

Show that V=π2(d2hh3)V=\frac{\pi}{2}\left(d^{2} h-h^{3}\right).

The remainder of this question considers the shape of barrel that gives the best value when d=0.6.

[ 2 ]
(b)
(i)

Use the formula from part (d) to find the volume of this barrel when h=0.4.

[ 2 ]
(ii)

Use differentiation to show that h=0.12h=\sqrt{0.12} when dV dh=0\frac{\mathrm{d} V}{\mathrm{~d} h}=0.

[ 3 ]
(iii)

Given that this value of h maximizes the volume, find the largest possible volume of this barrel.

Kepler then considered a non-cylindrical barrel whose base and lid are circles with radius 0.2 m and whose length is 0.8 m .

He modelled the curved surface of this barrel by rotating a quadratic curve, ASB , with equation y=ax2+bx+c,0x0.8y=a x^{2}+b x+c, 0 \leq x \leq 0.8, about the x-axis. The origin of the coordinate system is at the centre of one of the circular faces as shown in the following diagram. S is at the vertex of the quadratic curve and SD=0.6.

Question image

Kepler wished to find out if his barrel would give him more wine than any cylindrical barrel with d=0.6.

The coordinates of A and B are ( 0,0.2 ) and ( 0.8,0.2 ) respectively.

[ 2 ]
(c)

Show that the volume of this barrel is greater than the maximum volume of any cylindrical barrel with d=0.6.

[ 3 ]
[Maximum number: 23]

This question uses differential equations to model the maximum velocity of a skydiver in free fall.
In 2012, Felix Baumgartner jumped from a height of 40000 m . He was attempting to travel at the speed of sound, 330 m s1330 \mathrm{~m} \mathrm{~s}^{-1}, whilst free-falling to the Earth.
Before making his attempt, Felix used mathematical models to check how realistic his attempt would be. The simplest model he used suggests that

dv dt=g\frac{\mathrm{d} v}{\mathrm{~d} t}=g

where v m s1v \mathrm{~m} \mathrm{~s}^{-1} is Felix's velocity and g ms2g \mathrm{~ms}^{-2} is the acceleration due to gravity. The time since he began to free-fall is t seconds and the displacement from his initial position is s metres.

Throughout this question, the direction towards the centre of the Earth is taken to be positive and v is a positive quantity.

When s=0, it is given that Felix jumps with an initial velocity v=10.

(a)
(i)

Use the chain rule to show that dv dt=v dv ds\frac{\mathrm{d} v}{\mathrm{~d} t}=v \frac{\mathrm{~d} v}{\mathrm{~d} s}.

(ii)

Assuming that g is a constant, solve the differential equation v dv ds=gv \frac{\mathrm{~d} v}{\mathrm{~d} s}=g to find
v as a function of s. v as a function of s.

[ 1 ]
(iii)

Using g=9.8, determine whether the model predicts that Felix will succeed in travelling at the speed of sound at some point before s=40000. Justify your answer.

[ 3 ]
(b)

To test the model

dv dt=g\frac{\mathrm{d} v}{\mathrm{~d} t}=g

Felix conducted a trial jump from a lower height, and data for v against t was found.

[ 2 ]
(i)

If the model is correct, describe the shape of the graph of v against t.

Felix's data are plotted on the following graph.

Question image
[ 2 ]
(c)

An improved model considers air resistance, using

dv dt=gkv2\frac{\mathrm{d} v}{\mathrm{~d} t}=g-k v^{2}

where k is a positive constant. You are reminded that initially s=0 and v=10.

[ 11 ]
(i)

By using dv dt=v dv ds\frac{\mathrm{d} v}{\mathrm{~d} t}=v \frac{\mathrm{~d} v}{\mathrm{~d} s}, solve the differential equation to find v in terms of s, g and k.

You may assume that gkv2>0g-k v^{2}>0.

Felix uses the graph of v against t shown in part (b) to estimate the value of k.

[ 5 ]
(ii)

The gradient is estimated to be 9.672 when v=40. Taking g to be 9.8 , use this information to show that Felix found that k=8×10⁵k=8 \times 10^{-5}.

[ 2 ]
(iii)

Hence, find the value of v predicted by this model, as s tends to infinity.

[ 2 ]
(iv)

Find the upper bound for the velocity according to this model, given that 0<s400000<s \leq 40000. Give your answer to four significant figures.

The assumption that the value of g is constant is not correct. It can be shown that

g=3.98×10¹⁴(6.41×10⁶s)2g=\frac{3.98 \times 10^{14}}{\left(6.41 \times 10^{6}-s\right)^{2}}

Hence, the new model is given by

v dv ds=3.98×10¹⁴(6.41×10⁶s)2(8×10⁵)v2v \frac{\mathrm{~d} v}{\mathrm{~d} s}=\frac{3.98 \times 10^{14}}{\left(6.41 \times 10^{6}-s\right)^{2}}-\left(8 \times 10^{-5}\right) v^{2}

When s=0, it is known that v=10.

[ 2 ]
(d)

Use Euler's method with a step length of 4000 to estimate the value of v when s=40000.

[ 4 ]
(e)

After Felix completed his record-breaking jump, he found that the answer from part (d) was not supported by data collected during the jump.

[ 2 ]
(i)

Suggest one improvement to the use of Euler's method which might increase the accuracy of the prediction of the model.

[ 1 ]
(ii)

Suggest one factor not explicitly considered by the model in part (d) which might lead to a difference between the model's prediction and the data collected.

[ 1 ]
[Maximum number: 9]

Kailash manufactures drink containers in the shape of a cuboid. The container has a square top and a square base of length, l cml \mathrm{~cm}. Its height, d cmd \mathrm{~cm}, is three times the length of the base.

Question image
(a)

Show that A=2πr2+750rA=2 \pi r^{2}+\frac{750}{r}.

(b)

Find dA dr\frac{\mathrm{d} A}{\mathrm{~d} r}.
(g) Hence or otherwise

[ 3 ]
(c)
(i)

find the value of r that will minimize A.

(ii)

find the minimum value of A needed for the cylinder.

[ 3 ]
(d)
(i)

Find d2A dr2\frac{\mathrm{d}^{2} A}{\mathrm{~d} r^{2}}.

(ii)

Hence determine whether the graph of A is concave-up or concave-down for r>0. Justify your answer.

[ 3 ]
[Maximum number: 3]

Inspectors are investigating the carbon dioxide emissions of a power plant. Let R be the rate, in tonnes per hour, at which carbon dioxide is being emitted and t be the time in hours since the inspection began.
When R is plotted against t, the total amount of carbon dioxide produced is represented by the area between the graph and the horizontal t-axis.
The rate, R, is measured over the course of two hours. The results are shown in the following table.

Table
(a)

Use the trapezoidal rule with an interval width of 0.4 to estimate the total amount of carbon dioxide emitted during these two hours.

The real amount of carbon dioxide emitted during these two hours was 72 tonnes.

[ 3 ]
[Maximum number: 12]

The following diagram shows a model of the side view of a water slide. All lengths are measured in metres.

Question image

The curved edge of the slide is modelled by

f(x)=14x2+2x for 0x4f(x)=-\frac{1}{4} x^{2}+2 x \text { for } 0 \leq x \leq 4

The remainder of the slide is modelled by

g(x)={4, for 4x54874x7, for 5x12g(x)=\left\{\begin{array}{c} 4, \text { for } 4 \leq x \leq 5 \\ \frac{48}{7}-\frac{4 x}{7}, \text { for } 5 \leq x \leq 12 \end{array}\right.
(a)

Use the trapezoidal rule with an interval width of 1 to calculate the approximate area under the model of the slide in the interval 0x40 \leq x \leq 4.

[ 5 ]
(b)

Find (14x2+2x)dx\int\left(-\frac{1}{4} x^{2}+2 x\right) \mathrm{d} x.

[ 3 ]
(c)

Calculate the exact area under the entire model of the slide, for 0x120 \leq x \leq 12.

[ 4 ]
[Maximum number: 26]

The cross-sectional view of a tunnel is shown on the axes below. The line [AB][\mathrm{AB}] represents a vertical wall located at the left side of the tunnel. The height, in metres, of the tunnel above the horizontal ground is modelled by y=0.1x3+0.8x2,2x8y=-0.1 x^{3}+0.8 x^{2}, 2 \leq x \leq 8, relative to an origin O .

Question image

Point A has coordinates ( 2,0 ), point B has coordinates ( 2,2.4 ), and point C has coordinates (8,0).

(a)
(i)

Find dy dx\frac{\mathrm{d} y}{\mathrm{~d} x}.

[ 6 ]
(ii)

Hence find the maximum height of the tunnel.

[ 6 ]
(b)

Find the height of the tunnel when

[ 3 ]
(i)

x=4\quad x=4.

(ii)

x=6\quad x=6.

[ 3 ]
(c)

Use the trapezoidal rule, with three intervals, to estimate the cross-sectional area of the tunnel.

[ 3 ]
(d)
(i)

Write down the integral which can be used to find the cross-sectional area of the tunnel.

[ 4 ]
(ii)

Hence find the cross-sectional area of the tunnel.

[ 4 ]
[Maximum number: 12]

A cafe makes x litres of coffee each morning. The cafe's profit each morning, C, measured in dollars, is modelled by the following equation

C=x10(k23100x2)C=\frac{x}{10}\left(k^{2}-\frac{3}{100} x^{2}\right)

where k is a positive constant.

(a)

Find an expression for dC dx\frac{\mathrm{d} C}{\mathrm{~d} x} in terms of k and x.

[ 3 ]
(b)

Hence find the maximum value of C in terms of k. Give your answer in the form pk3p k^{3}, where p is a constant.

The cafe's manager knows that the cafe makes a profit of $ 426 when 20 litres of coffee are made in a morning.

[ 4 ]
(c)
(i)

Find the value of k.

(ii)

Use the model to find how much coffee the cafe should make each morning to maximize its profit.

[ 3 ]
(d)

Determine the maximum amount of coffee the cafe can make that will not result in a loss of money for the morning.

[ 2 ]
[Maximum number: 7]

The graphs of y=6-x and y=1.5x22.5x+3y=1.5 x^{2}-2.5 x+3 intersect at (2,4) and (-1,7), as shown in the following diagrams.
In diagram 1, the region enclosed by the lines y=6-x, x=-1, x=2 and the x-axis has been shaded.

Diagram 1

Diagram 1

(a)

Calculate the area of the shaded region in diagram 1.

[ 2 ]
(b)

In diagram 2, the region enclosed by the curve y=1.5x22.5x+3y=1.5 x^{2}-2.5 x+3, and the lines x=-1, x=2 and the x-axis has been shaded.
Diagram 2

Question image
[ 3 ]
(i)

Write down an integral for the area of the shaded region in diagram 2.

(ii)

Calculate the area of this region.

[ 3 ]
(c)

Hence, determine the area enclosed between y=6-x and y=1.5x22.5x+3y=1.5 x^{2}-2.5 x+3.

[ 2 ]
0