Reactivity 3. What are the mechanisms of chemical change?
- Syllabus
- First assessment 2025
- Section
- —
- Level
- SL
A Brønsted–Lowry acid donates H+ and a Brønsted–Lowry base accepts H+. An alkali is a base that is soluble in water.
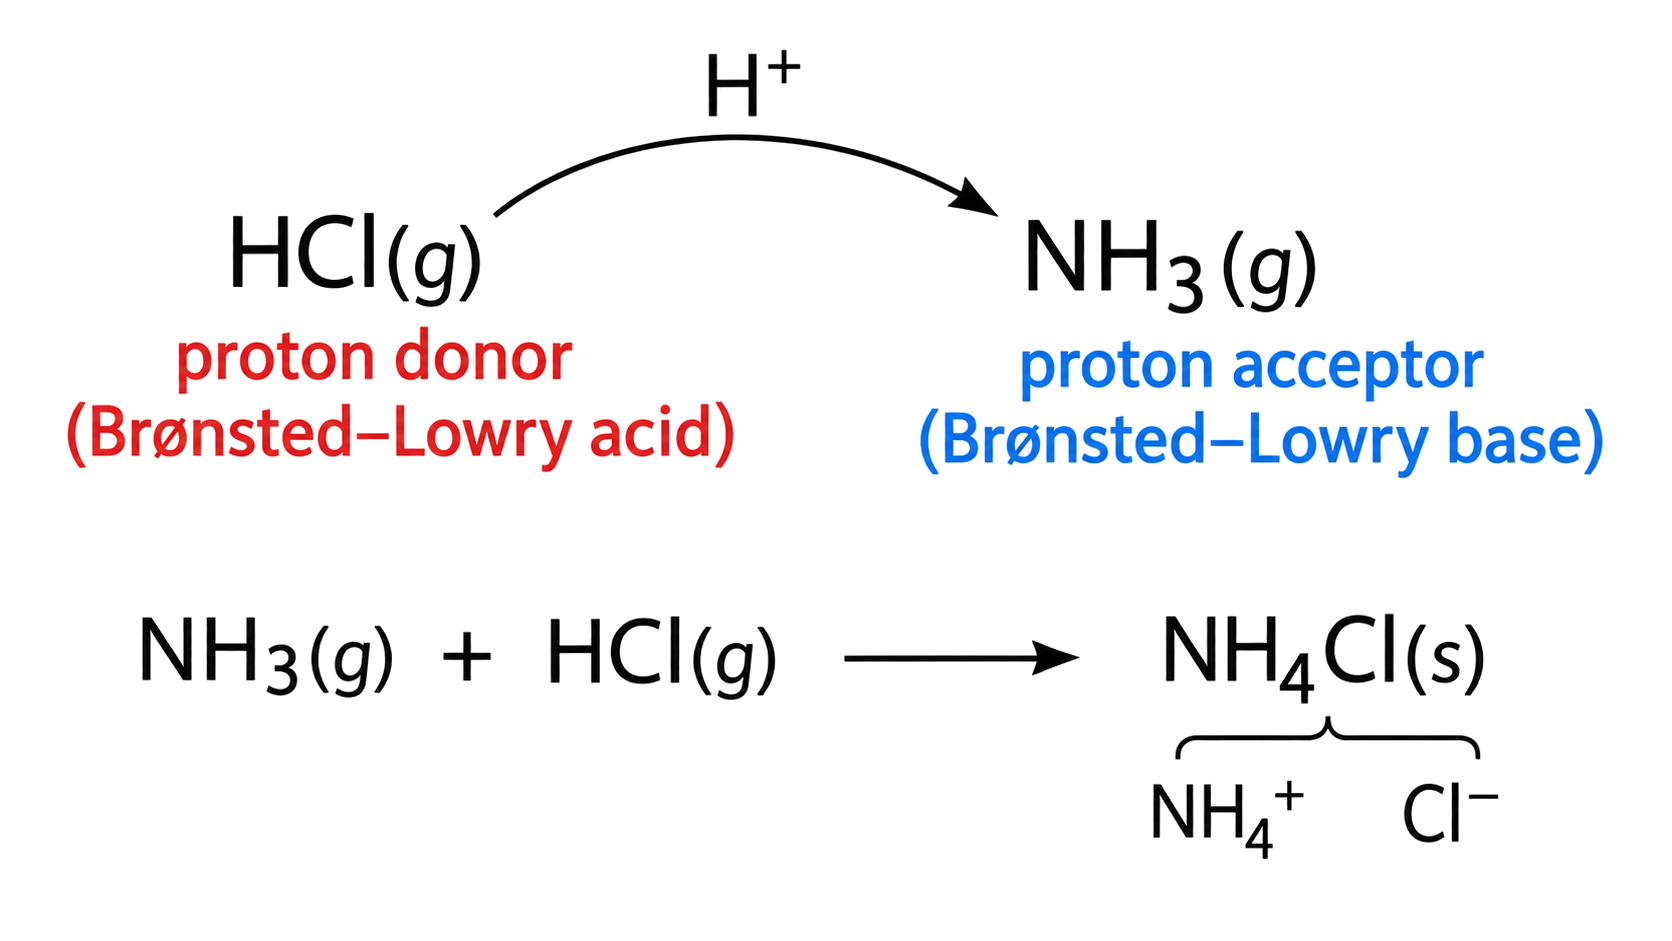
Follow the proton: the species losing it is the acid and the species gaining it is the base.
Pair species that differ by exactly one H⁺ to identify conjugate acid–base pairs. Charge alone does not decide the role: in NH₄⁺ + H₂O ⇌ NH₃ + H₃O⁺, NH₄⁺ is the proton donor and water is the acceptor.
An amphiprotic species can donate H+ in one reaction and accept H+ in another.
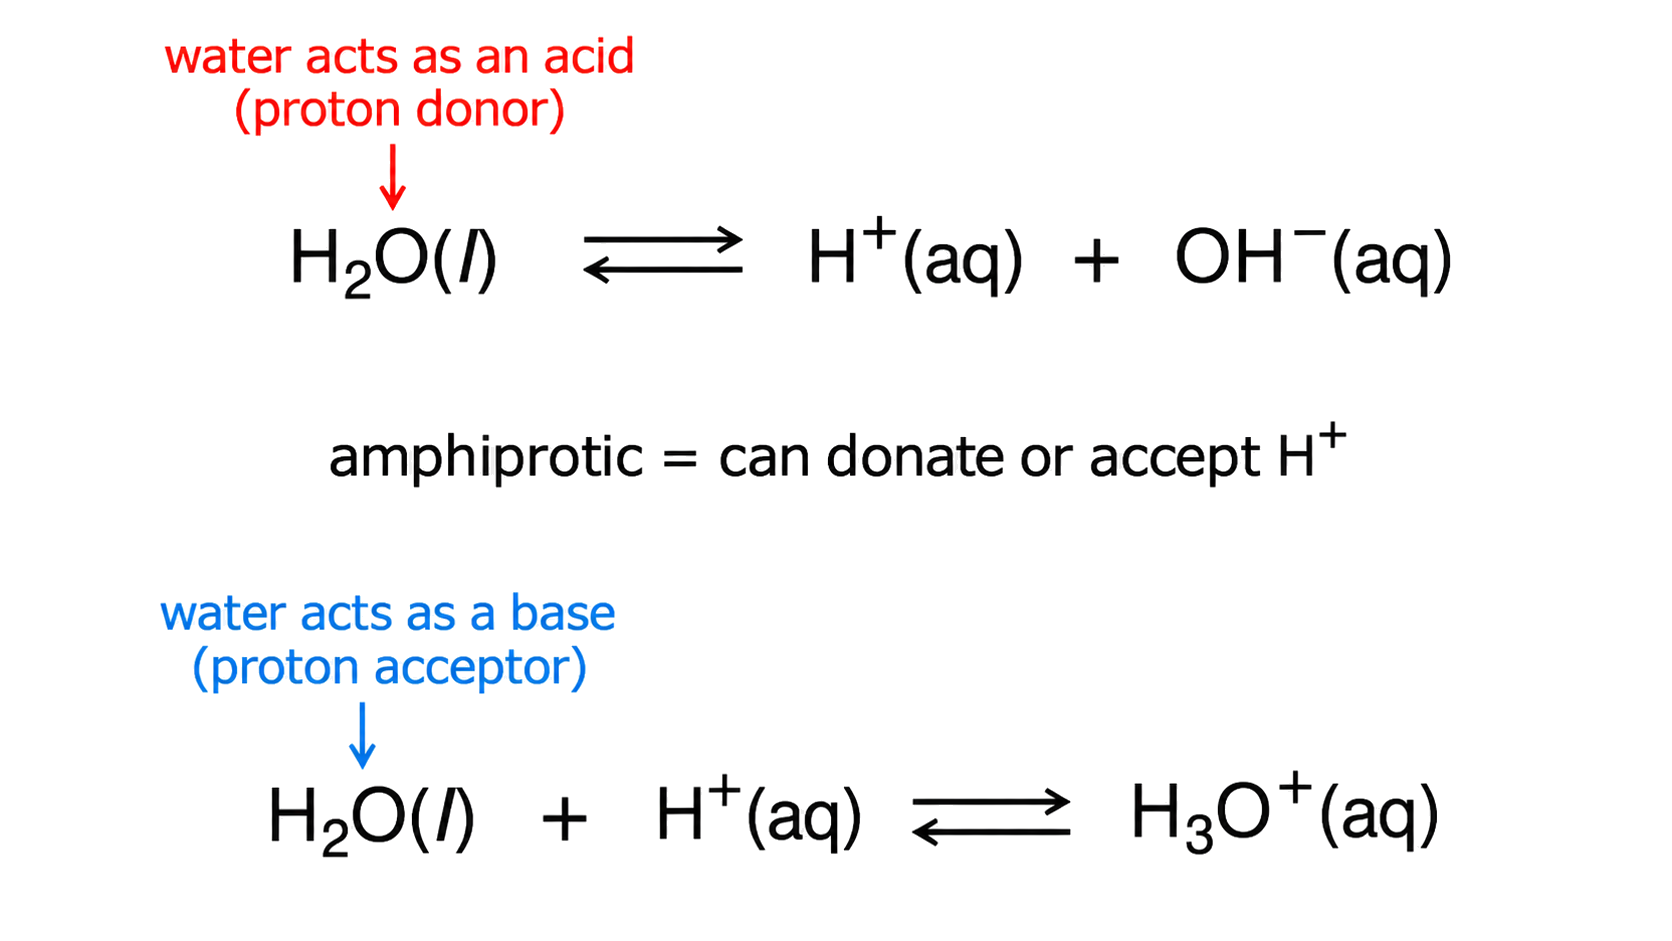
Write one equation in which the species becomes its conjugate base and another in which it becomes its conjugate acid.
For HCO₃⁻, donation gives CO₃²⁻ whereas acceptance gives H₂CO₃. Showing both reactions is the evidence for amphiprotic behaviour; one acid–base equation alone is insufficient.
A strong acid or base ionizes completely in aqueous solution; a weak acid or base ionizes only partially. The equilibrium favours the weaker conjugate species.
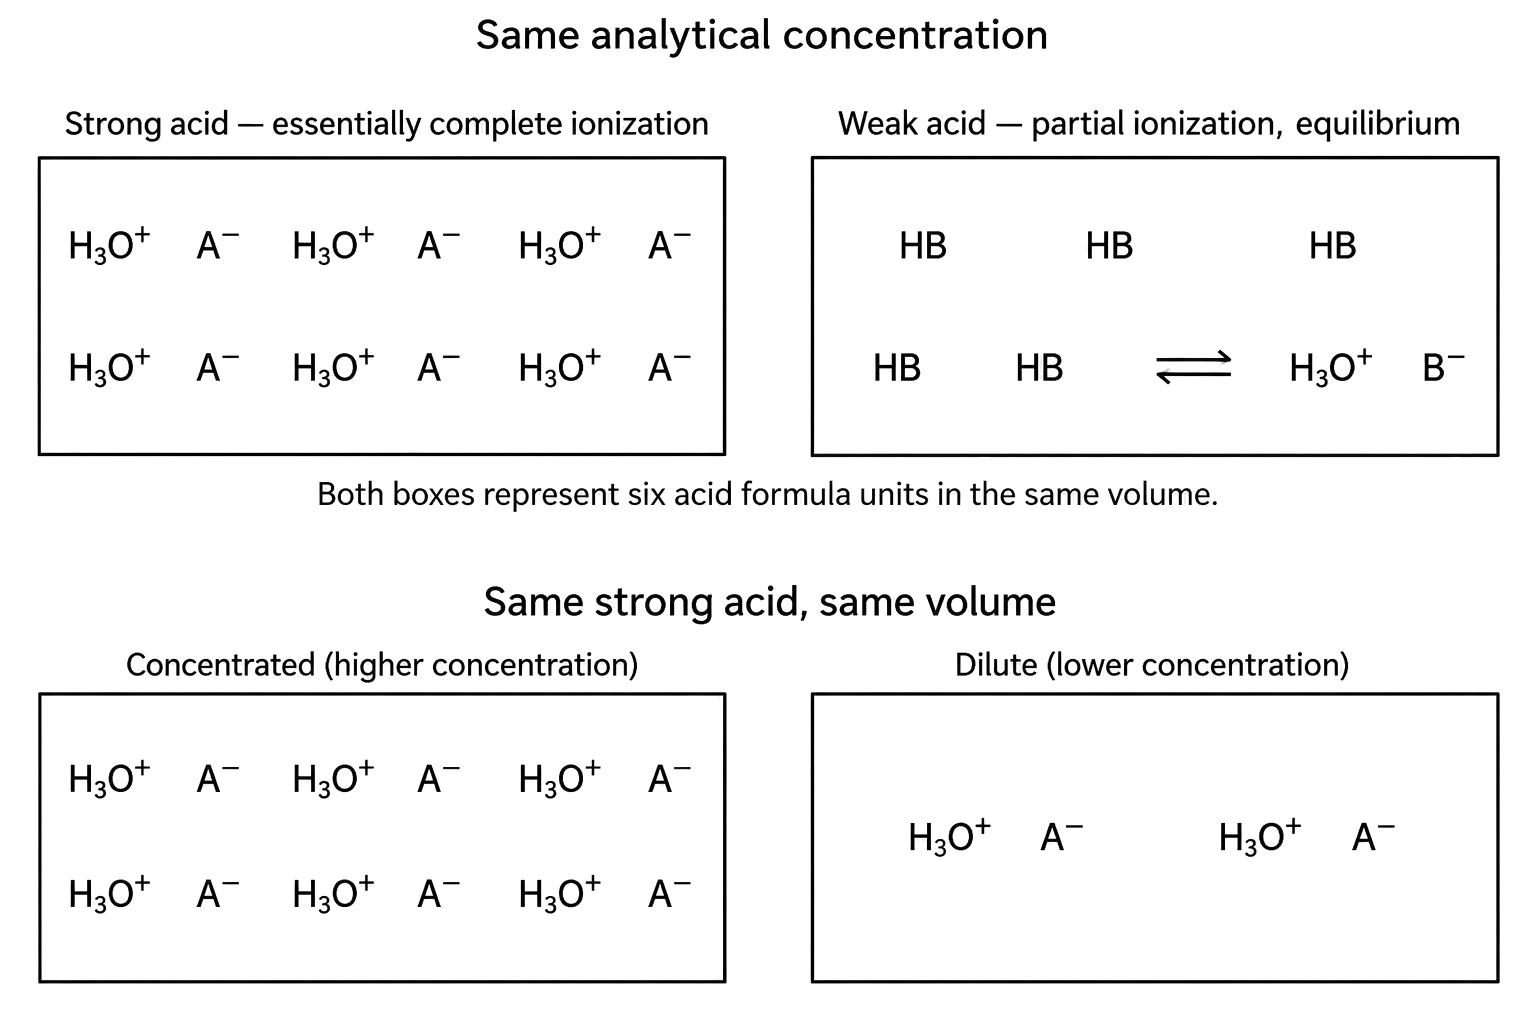
Strength is the extent of ionization, whereas concentration is the amount of solute per volume. A concentrated weak acid can be more acidic than a dilute strong acid.
Represent a strong acid with essentially complete ionization and a weak acid with an equilibrium containing substantial undissociated acid. Strength is an equilibrium property, while concentration is an initial amount per volume; pH depends on both, so strength alone cannot rank arbitrary solutions.
The equivalence point is where stoichiometric amounts of analyte and titrant have reacted. A monoprotic strong-acid–strong-base curve has a steep neutral region centred at the equivalence point.
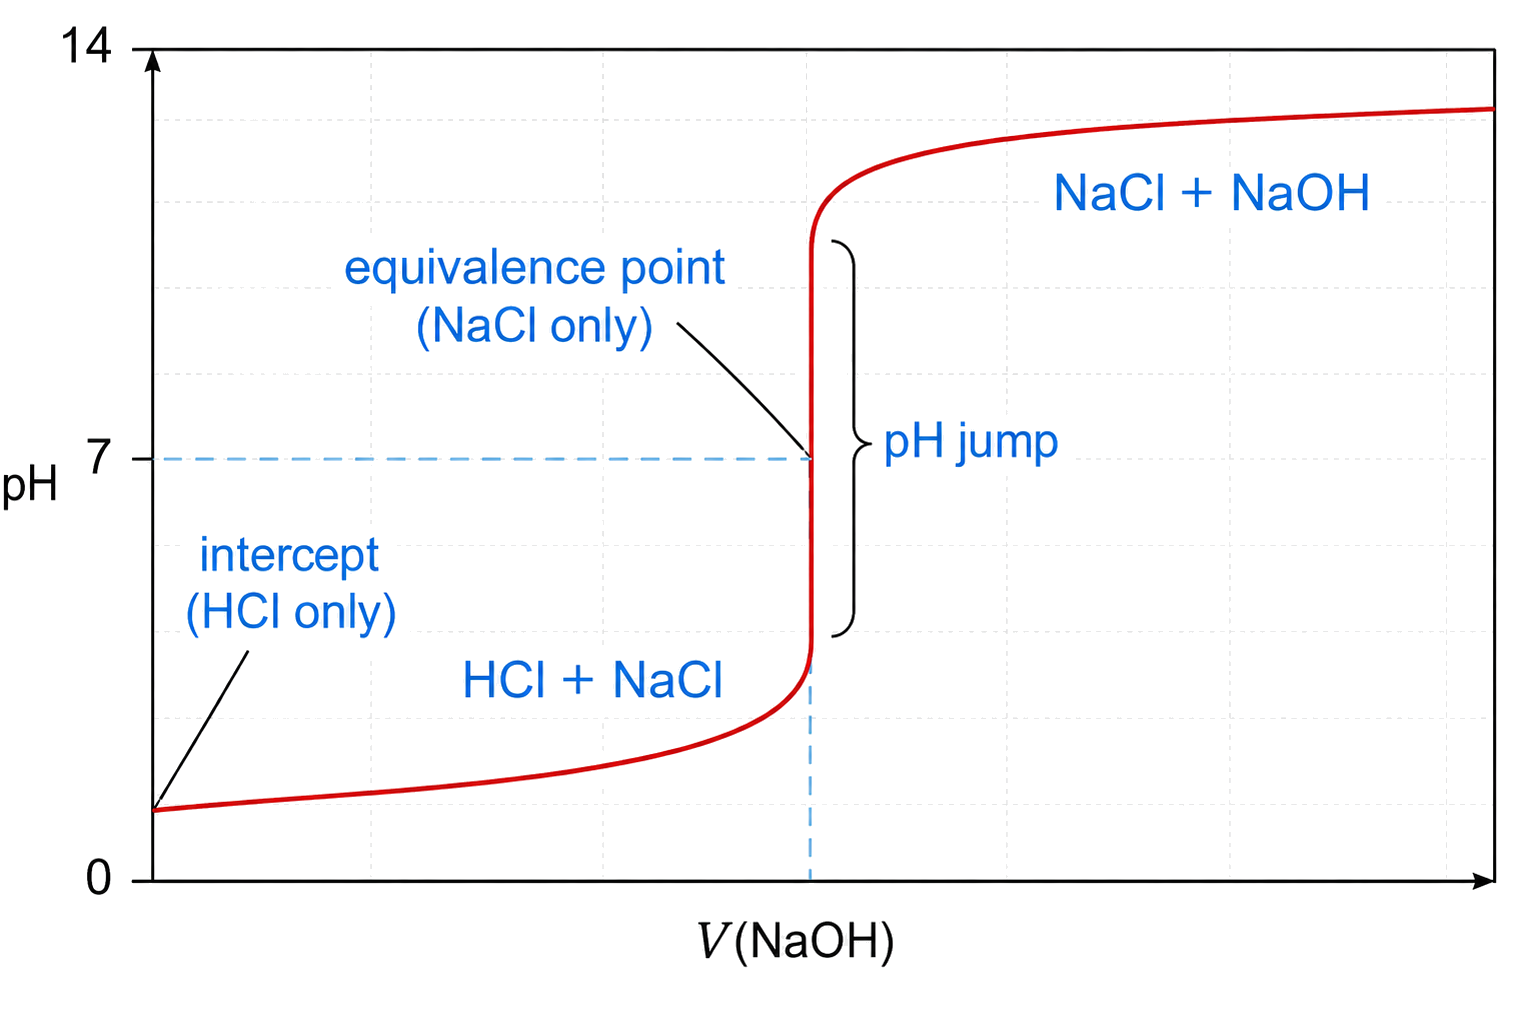
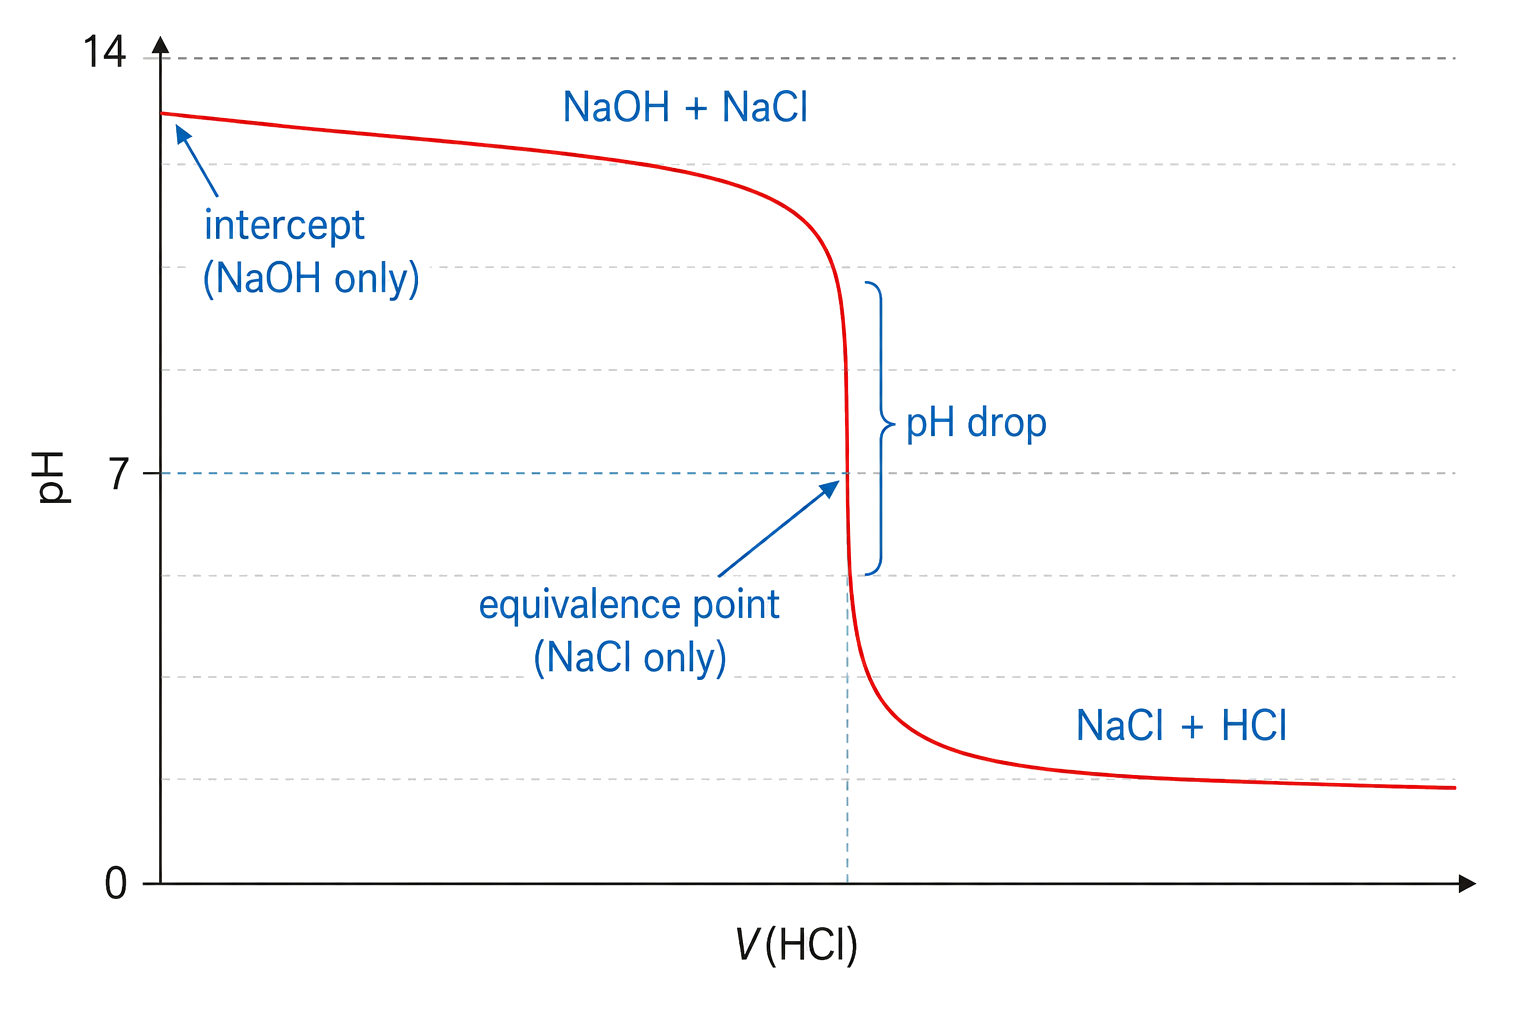
Read the initial pH, steep intercept region and final plateau; curve direction depends on whether acid or base is added.
For a strong acid titrated with strong base at 25 °C, calculate the initial pH from excess acid, locate equivalence from stoichiometric moles, and place the steep section around pH 7. Equivalence is a mole condition; it is not the same as equal solution volumes unless concentrations and stoichiometry make it so.
Oxidation always occurs at the anode and reduction always occurs at the cathode. In a voltaic cell the anode is negative and cathode positive; in an electrolytic cell the anode is positive and cathode negative.
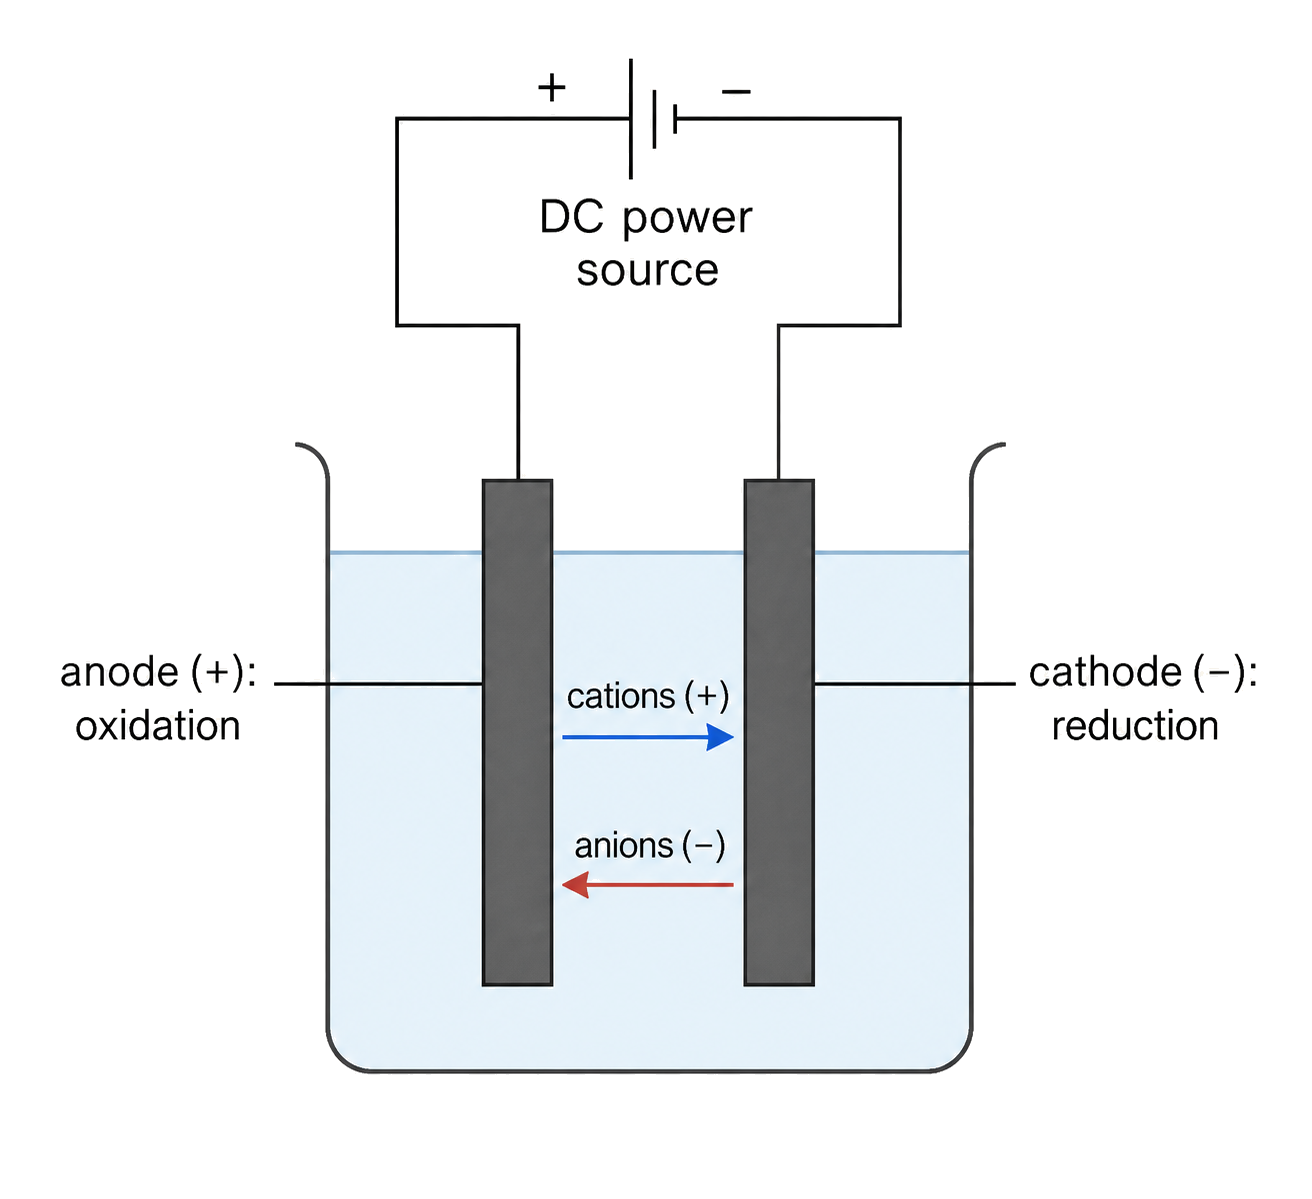
Name electrodes from the half-reactions before assigning signs. Electrons leave the anode and reach the cathode through the external circuit; a power supply reverses the polarities in an electrolytic cell but never changes where oxidation and reduction occur.
A voltaic cell uses a spontaneous redox reaction to convert chemical energy to electrical energy. Electrons flow through the wire from anode to cathode; the salt bridge carries ions to maintain charge neutrality.
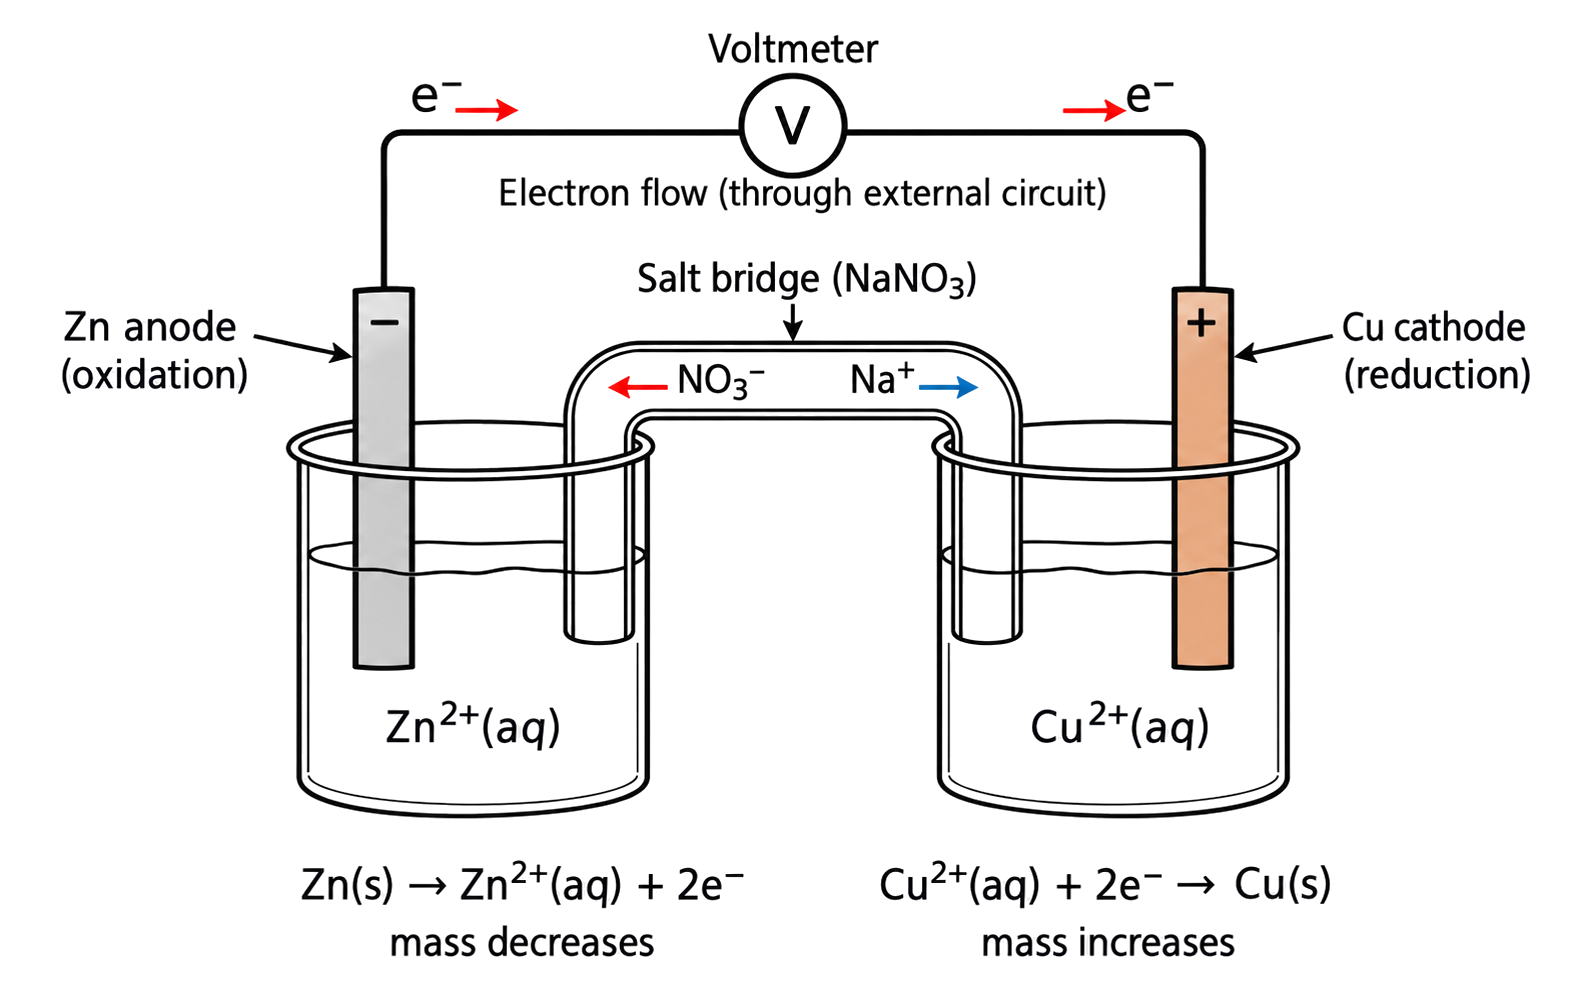
Both half-cells connect to the external circuit and the salt bridge must contact both solutions.
In a Zn|Zn²⁺ || Cu²⁺|Cu cell, Zn is oxidized at the negative anode and electrons travel through the wire to the positive Cu cathode, where Cu²⁺ is reduced. Salt-bridge anions migrate toward the anode compartment and cations toward the cathode compartment to prevent charge buildup; electrons do not flow through the bridge.
In molten salt there is no water: metal ions are reduced to metal at the cathode and anions are oxidized at the anode. For molten chloride, chloride forms chlorine gas.
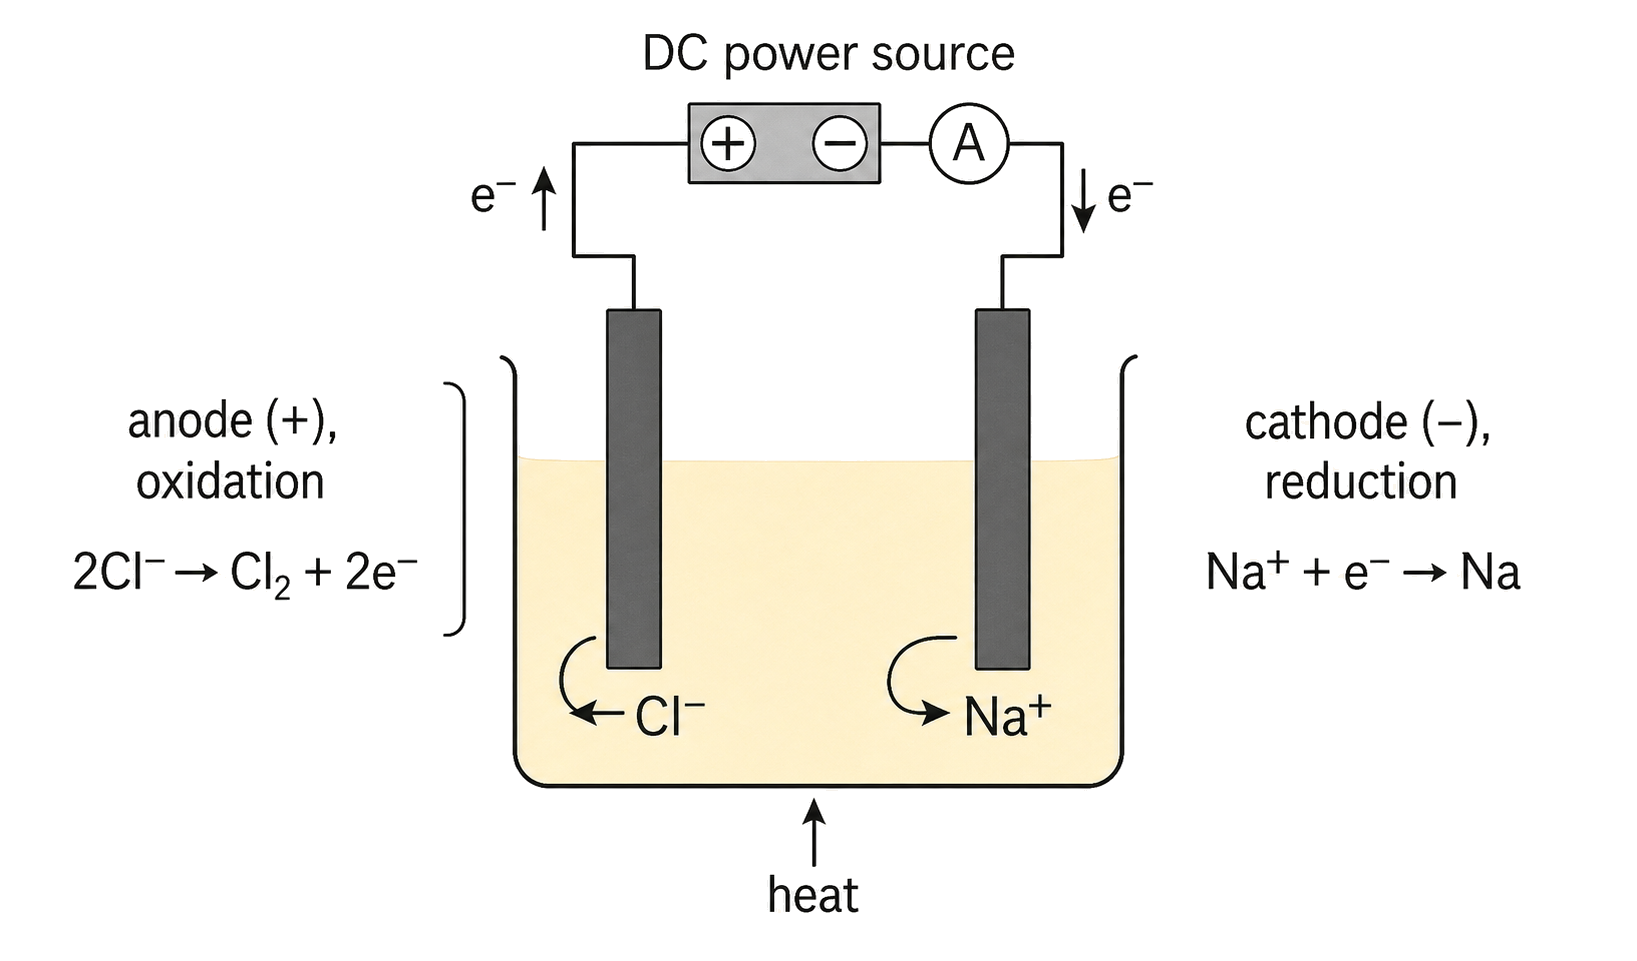
Molten MgCl₂ contains only Mg²⁺ and Cl⁻: Mg²⁺ + 2e⁻ → Mg at the cathode and 2Cl⁻ → Cl₂ + 2e⁻ at the anode. The melt conducts by ion migration; do not introduce H₂, O₂ or water-based competition into a molten-salt question.
A primary alcohol oxidizes to an aldehyde and then a carboxylic acid; a secondary alcohol oxidizes to a ketone. Reflux supports further oxidation to the acid, while distillation can remove an aldehyde.
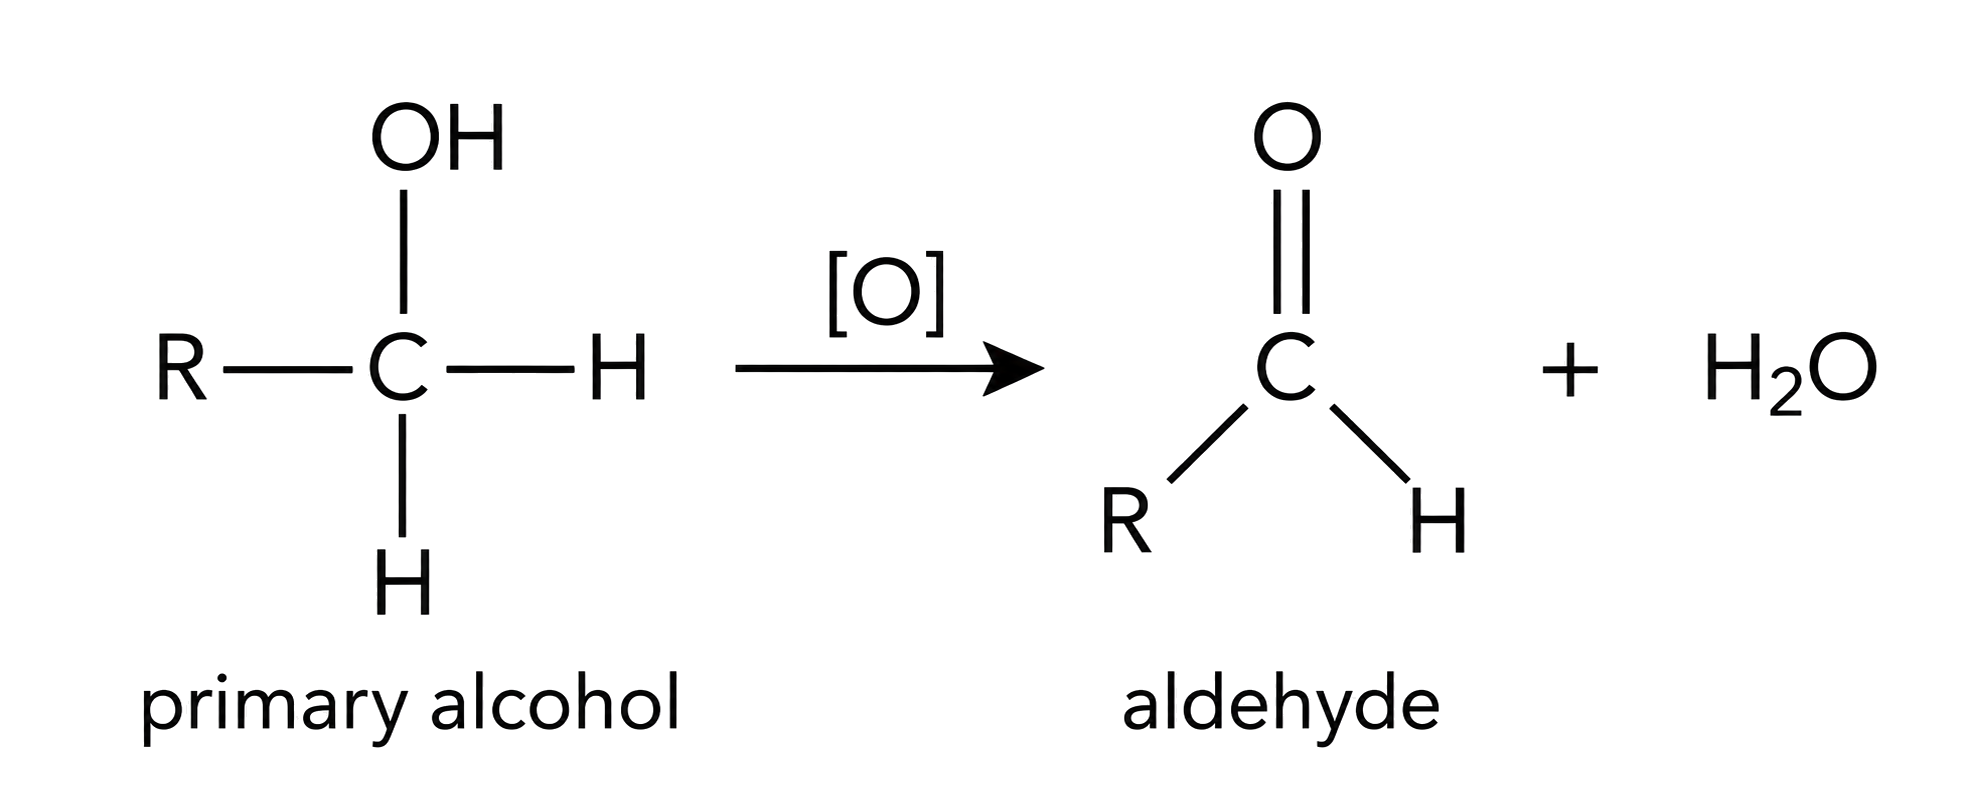
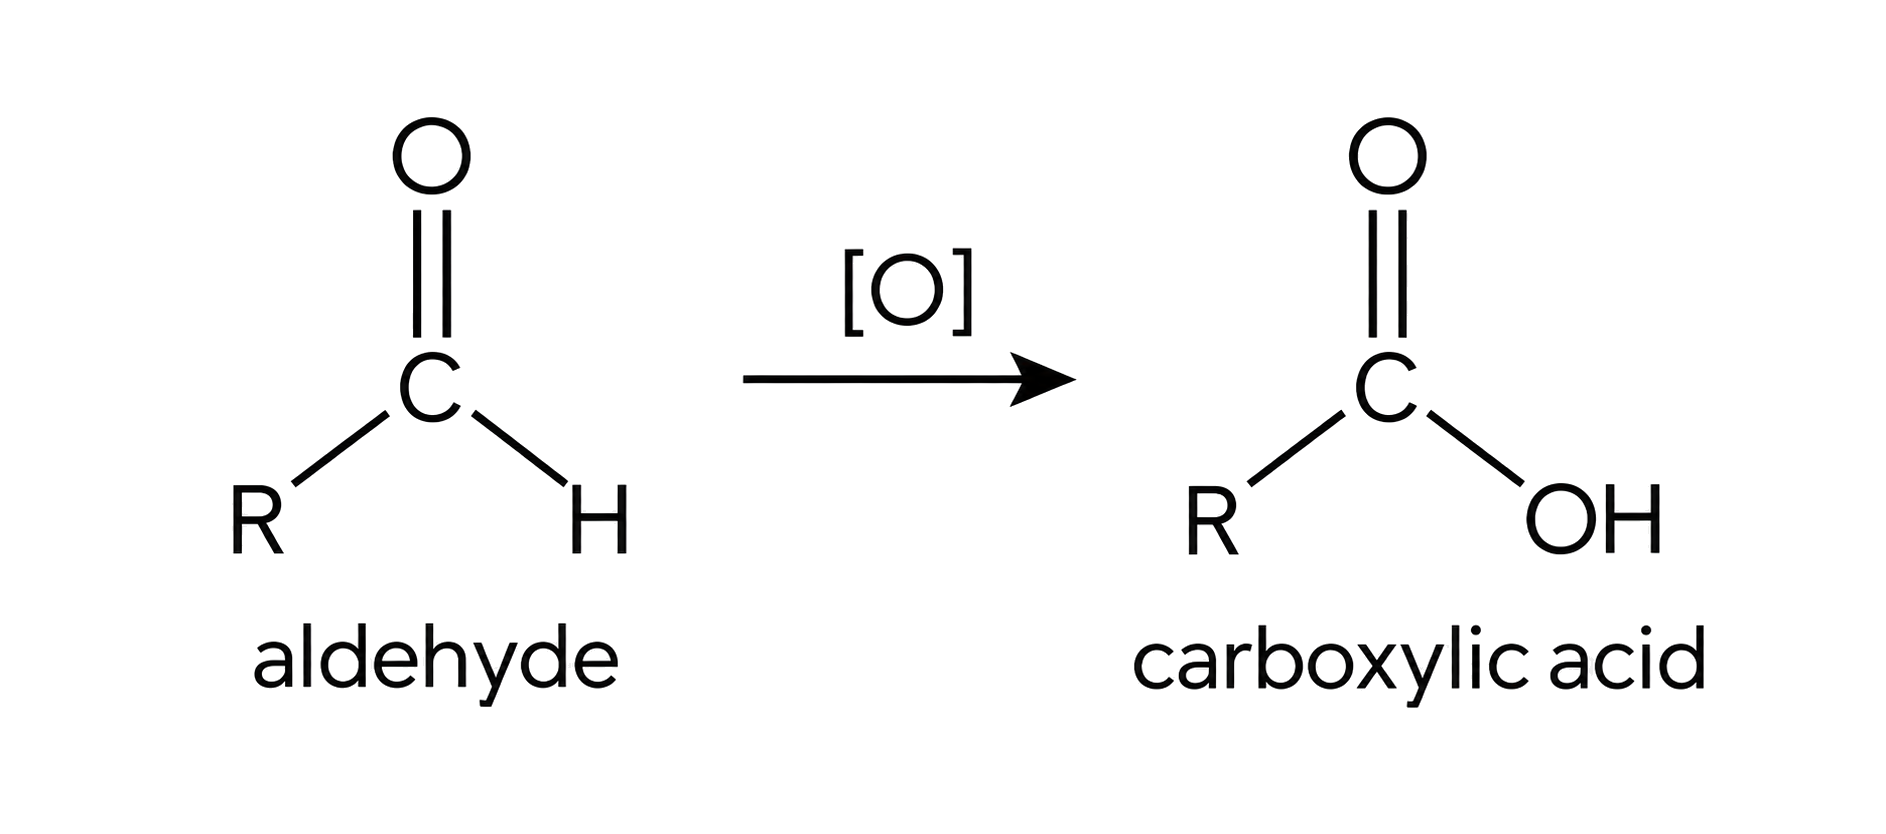
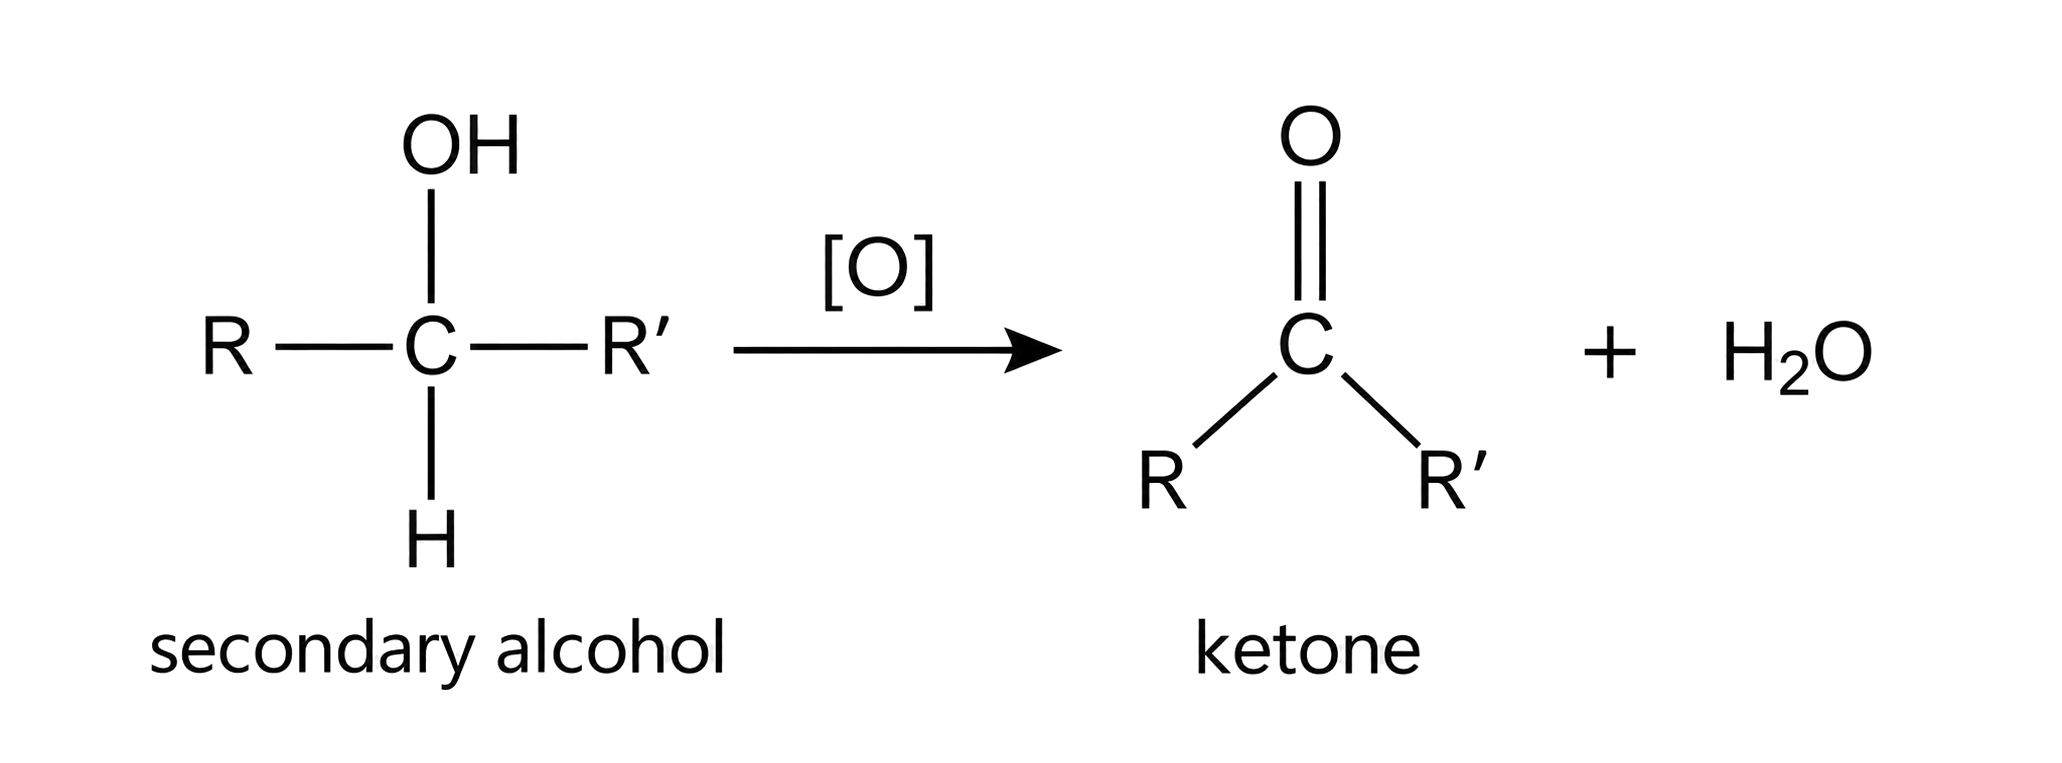
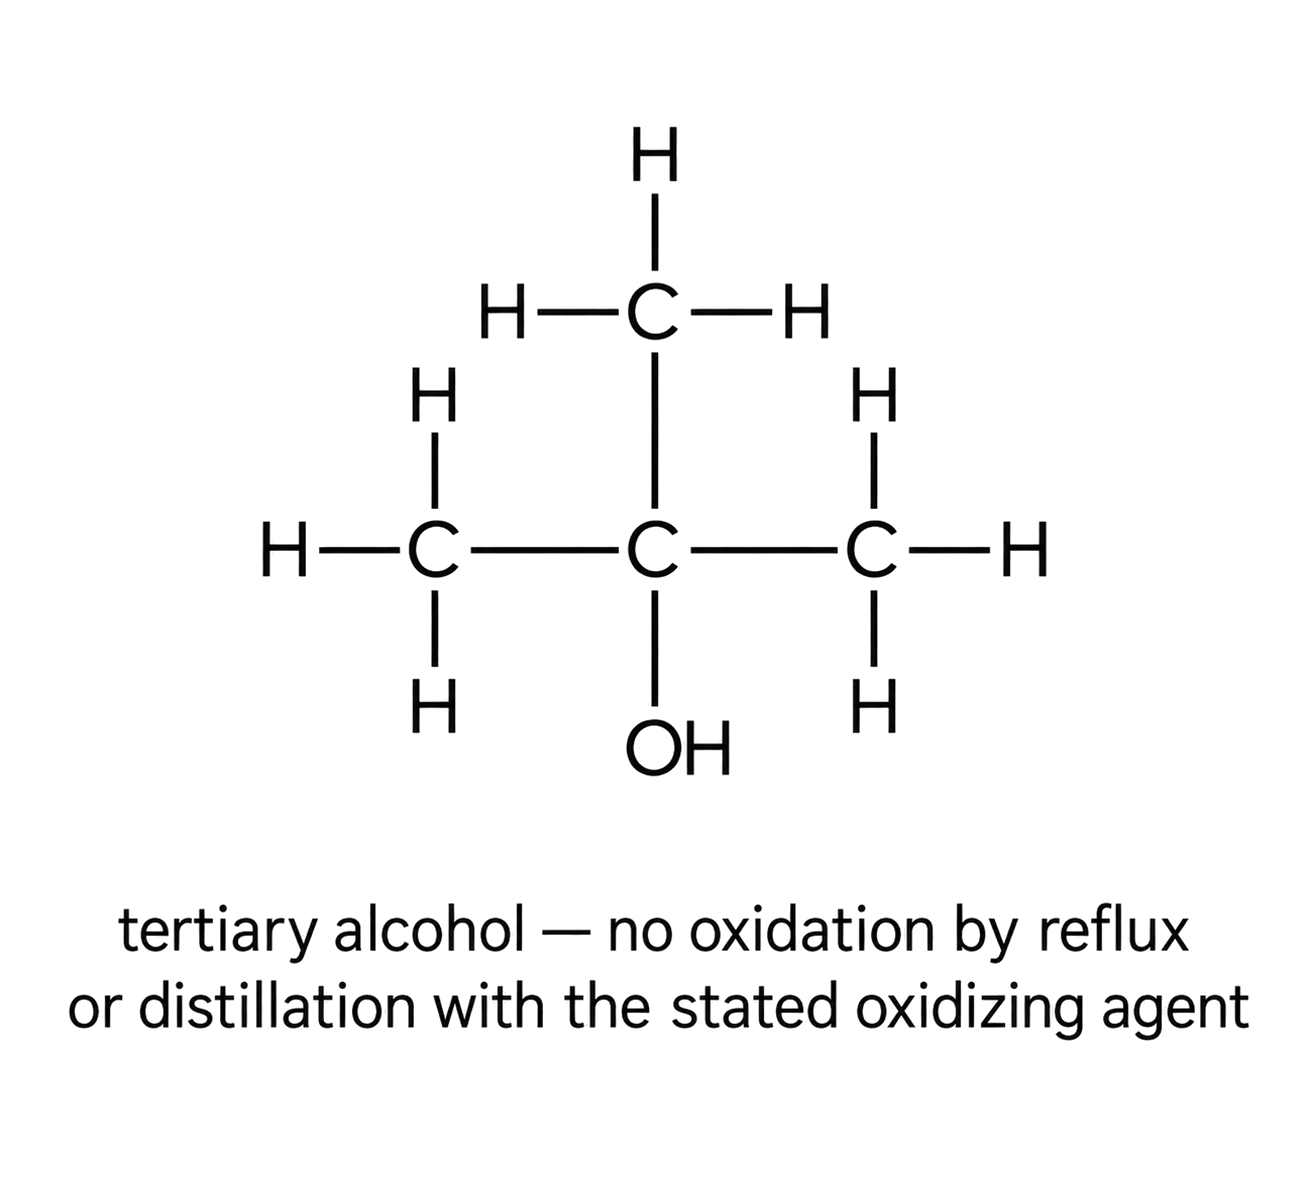
In a primary-alcohol experiment, distil the aldehyde as it forms to limit further oxidation; heat under reflux when the carboxylic acid is required. Tertiary alcohols lack the required hydrogen on the carbon bearing –OH and are not oxidized in the same way.
A carboxylic acid can be reduced through an aldehyde to a primary alcohol; a ketone is reduced to a secondary alcohol. Hydride ions supply the reduction equivalent in these transformations.
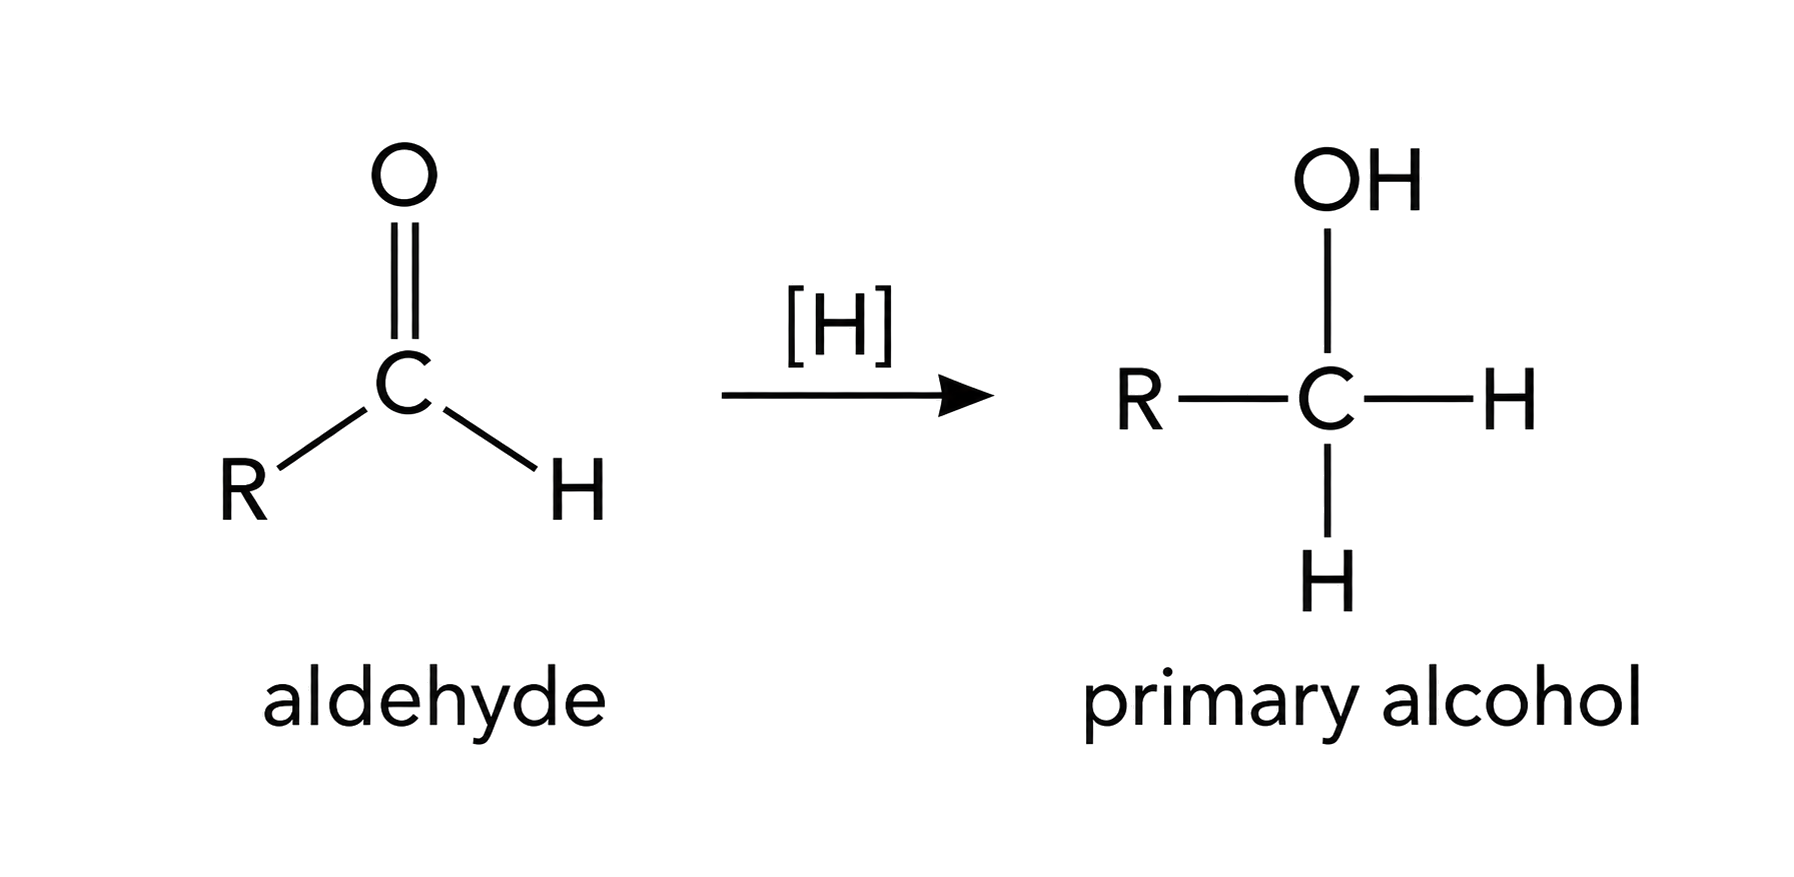
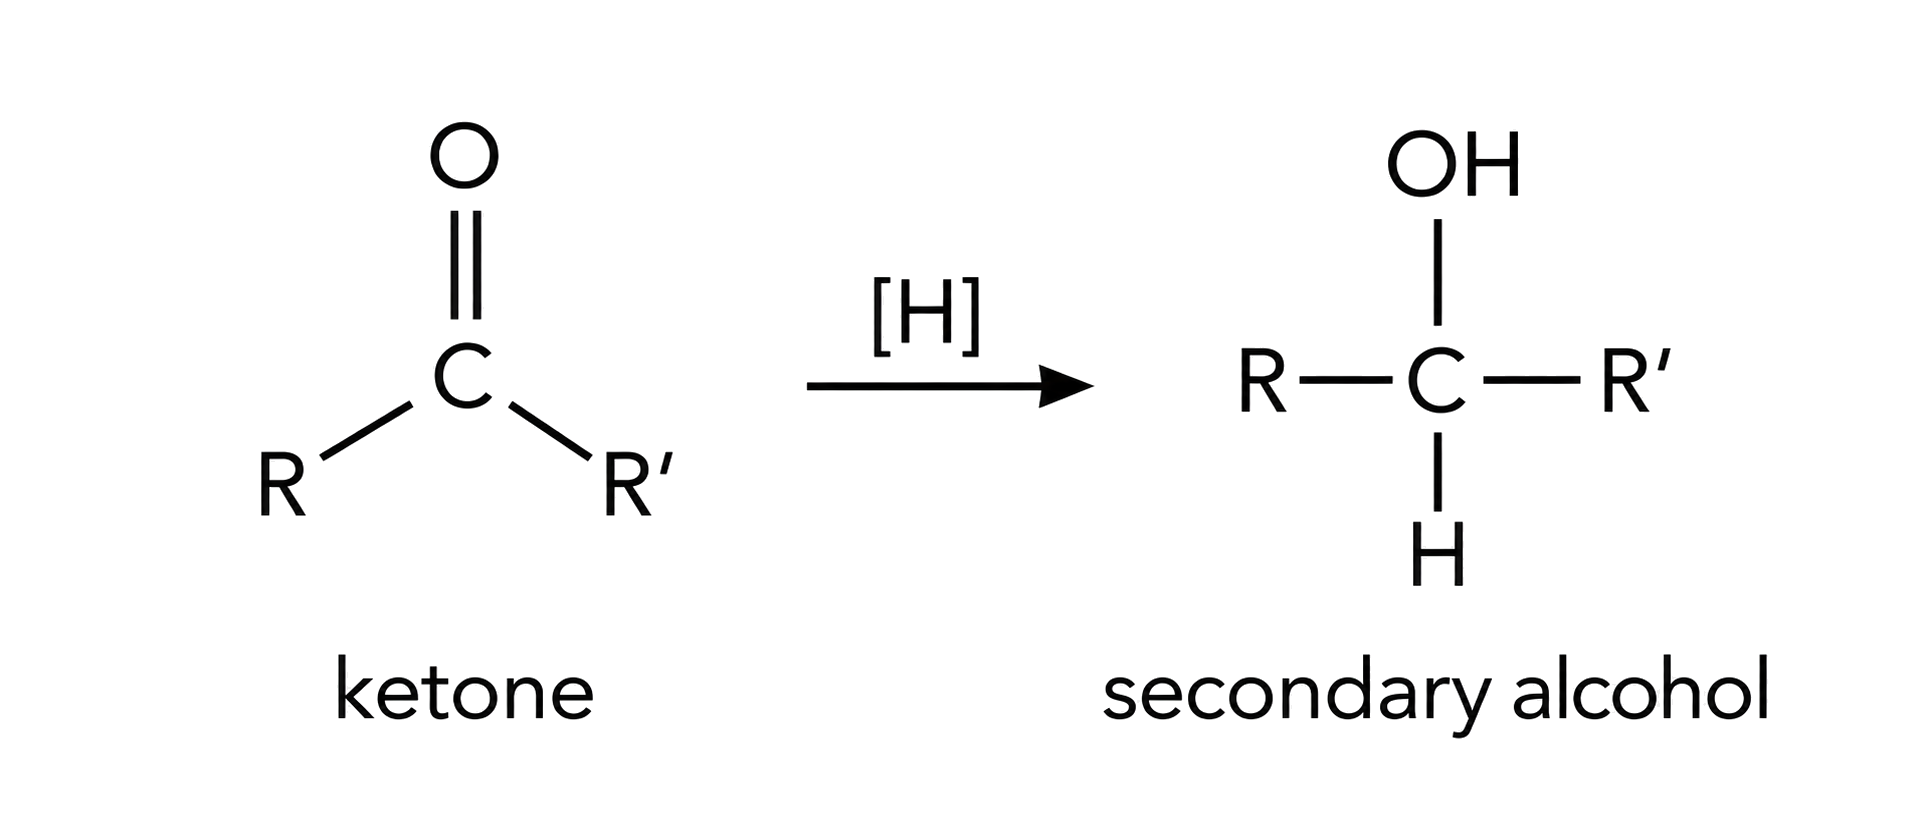
Track the carbon functional group rather than only the reagent: an aldehyde gives a primary alcohol and a ketone gives a secondary alcohol. Hydride supplies an electron-rich H unit to the carbonyl carbon; named reducing agents and detailed mechanisms are outside this objective.
Hydrogenation adds H2 across π bonds. Continue addition until the required saturated product is formed; nickel, palladium or platinum catalysts with heat or pressure are typical conditions.
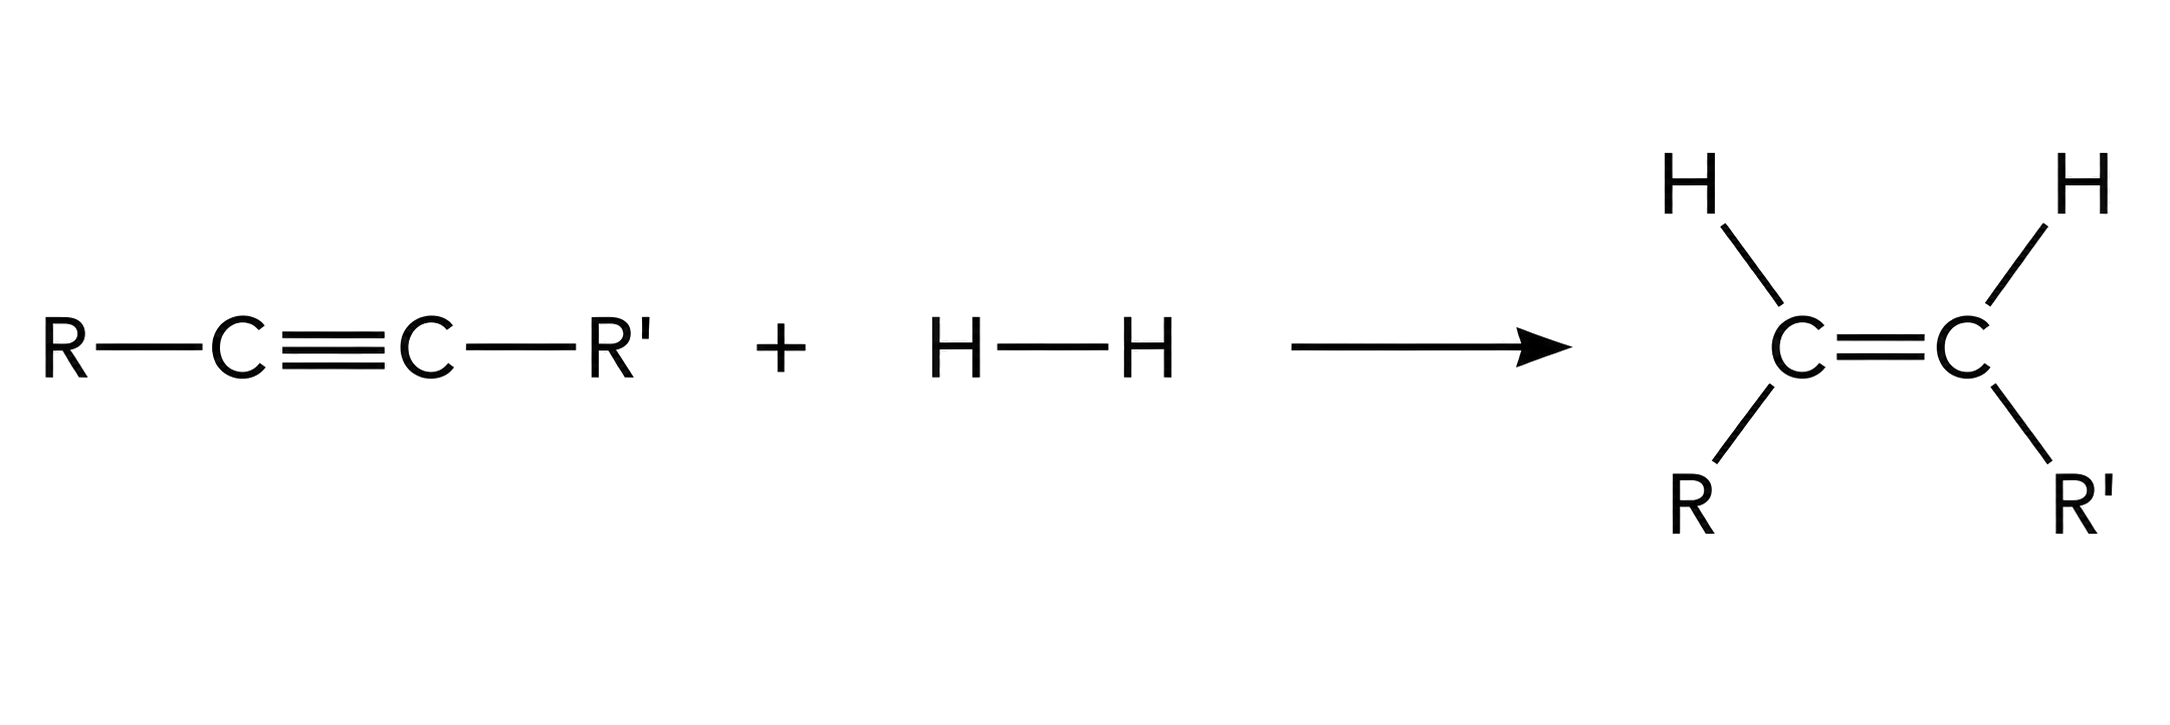
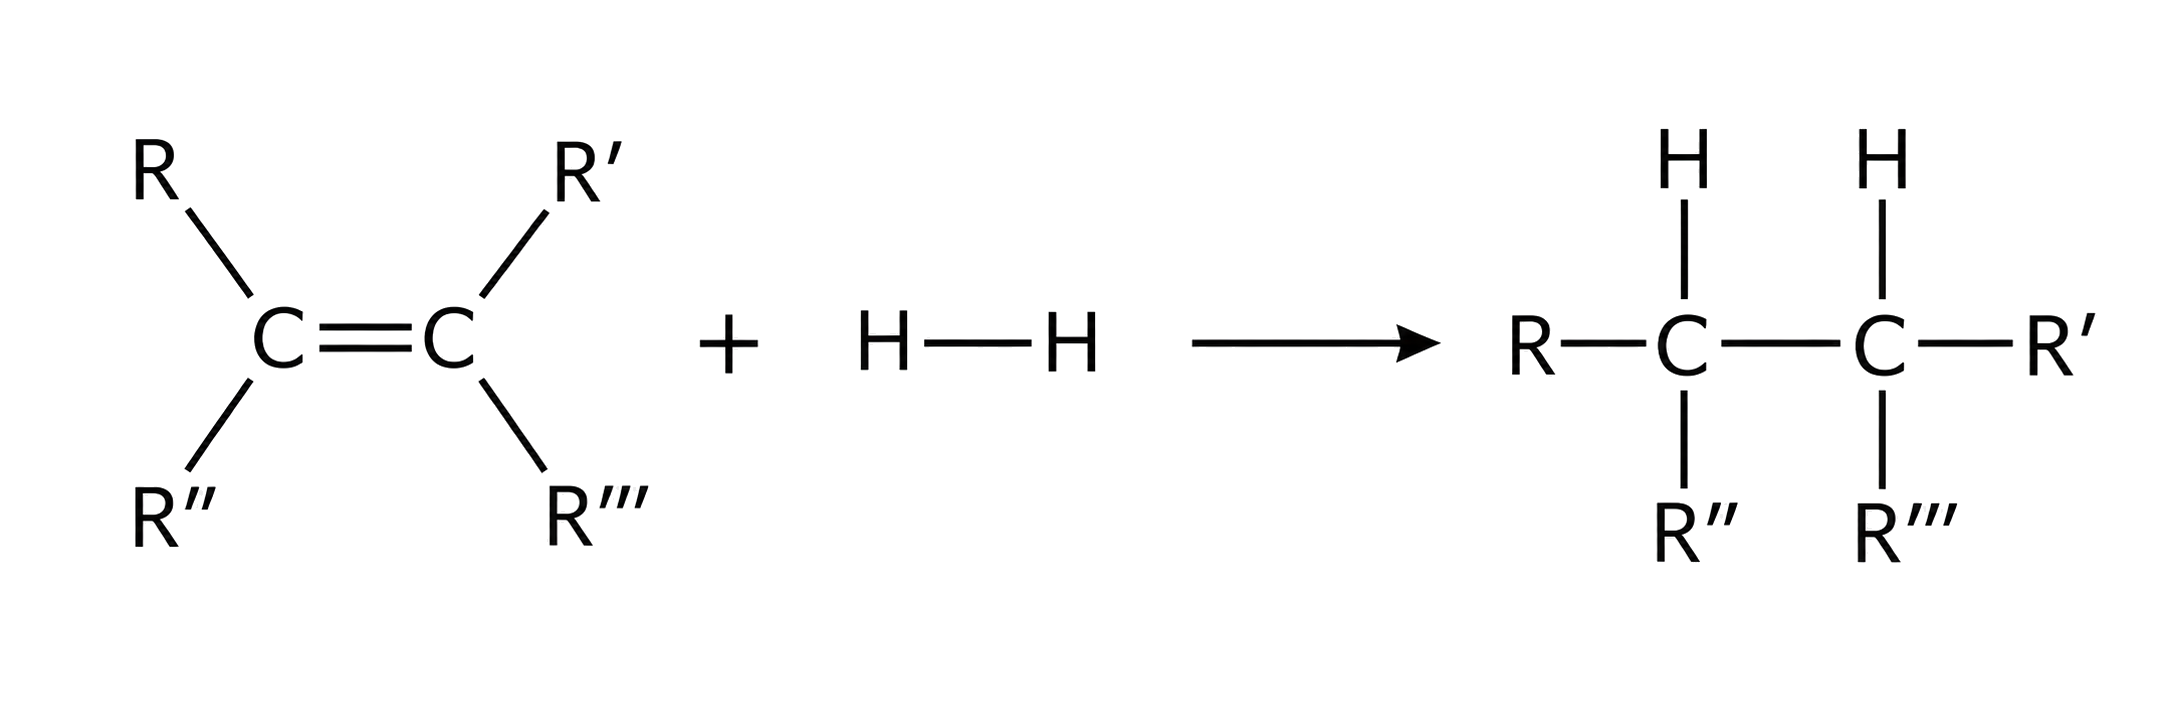
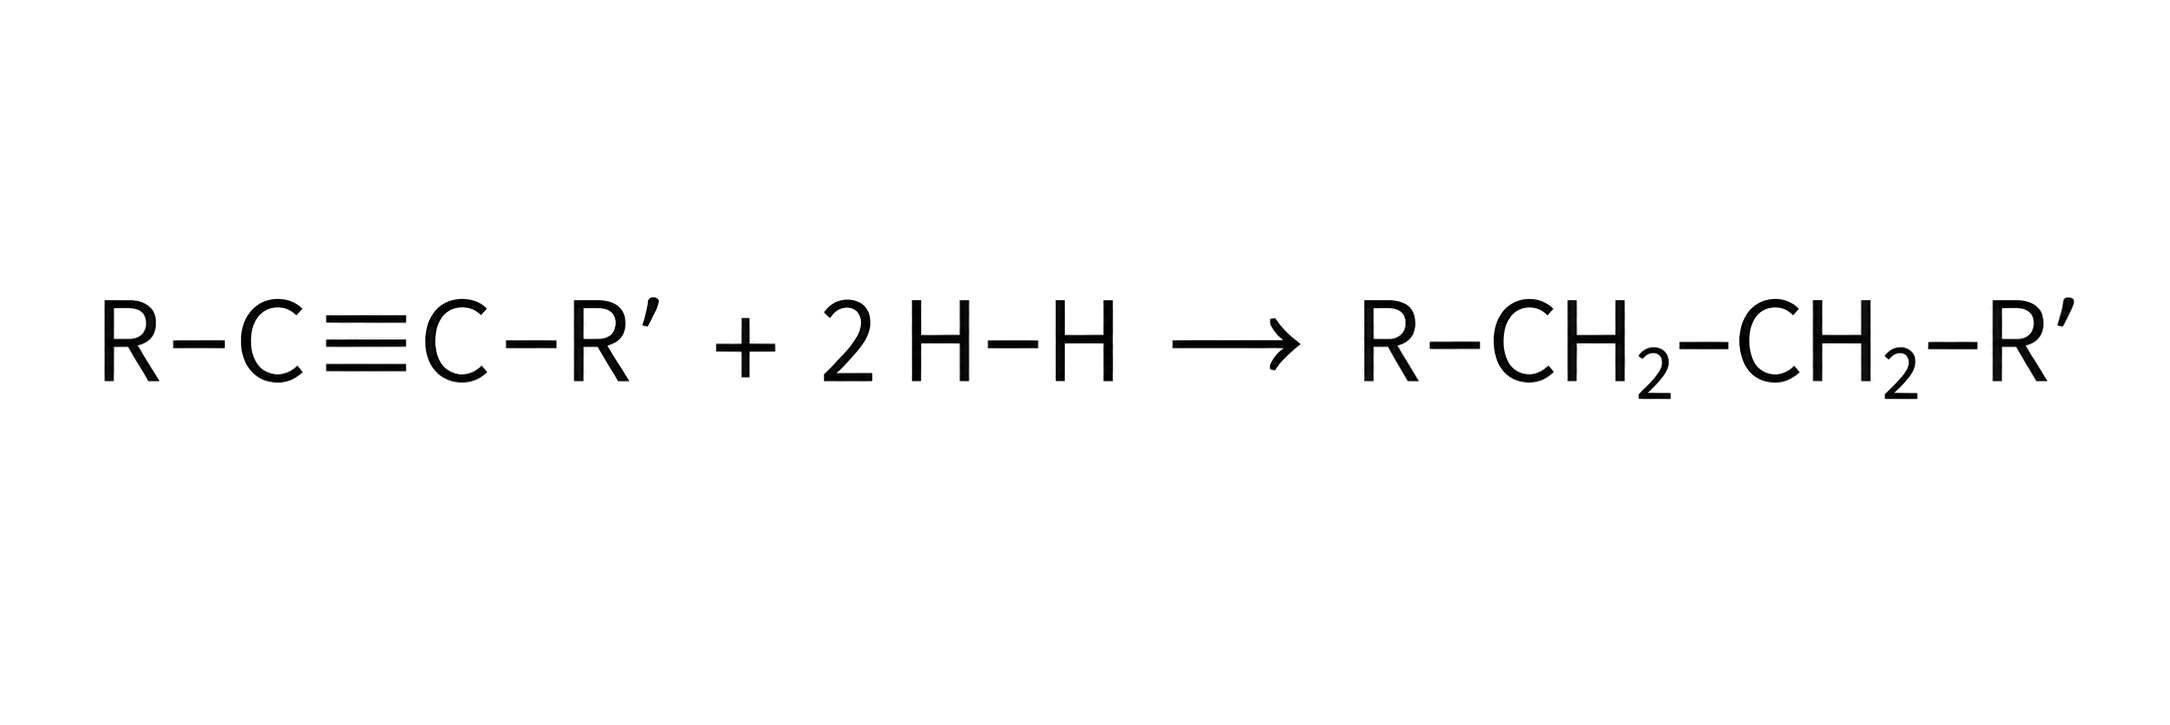
Count π bonds to determine hydrogen demand: one mole of H₂ saturates one C=C, while full conversion of one C≡C to C–C needs two moles of H₂. Keep the carbon skeleton unchanged when drawing the product.
A radical is a highly reactive species containing an unpaired electron. Show the unpaired electron with a dot next to the atom that carries it.

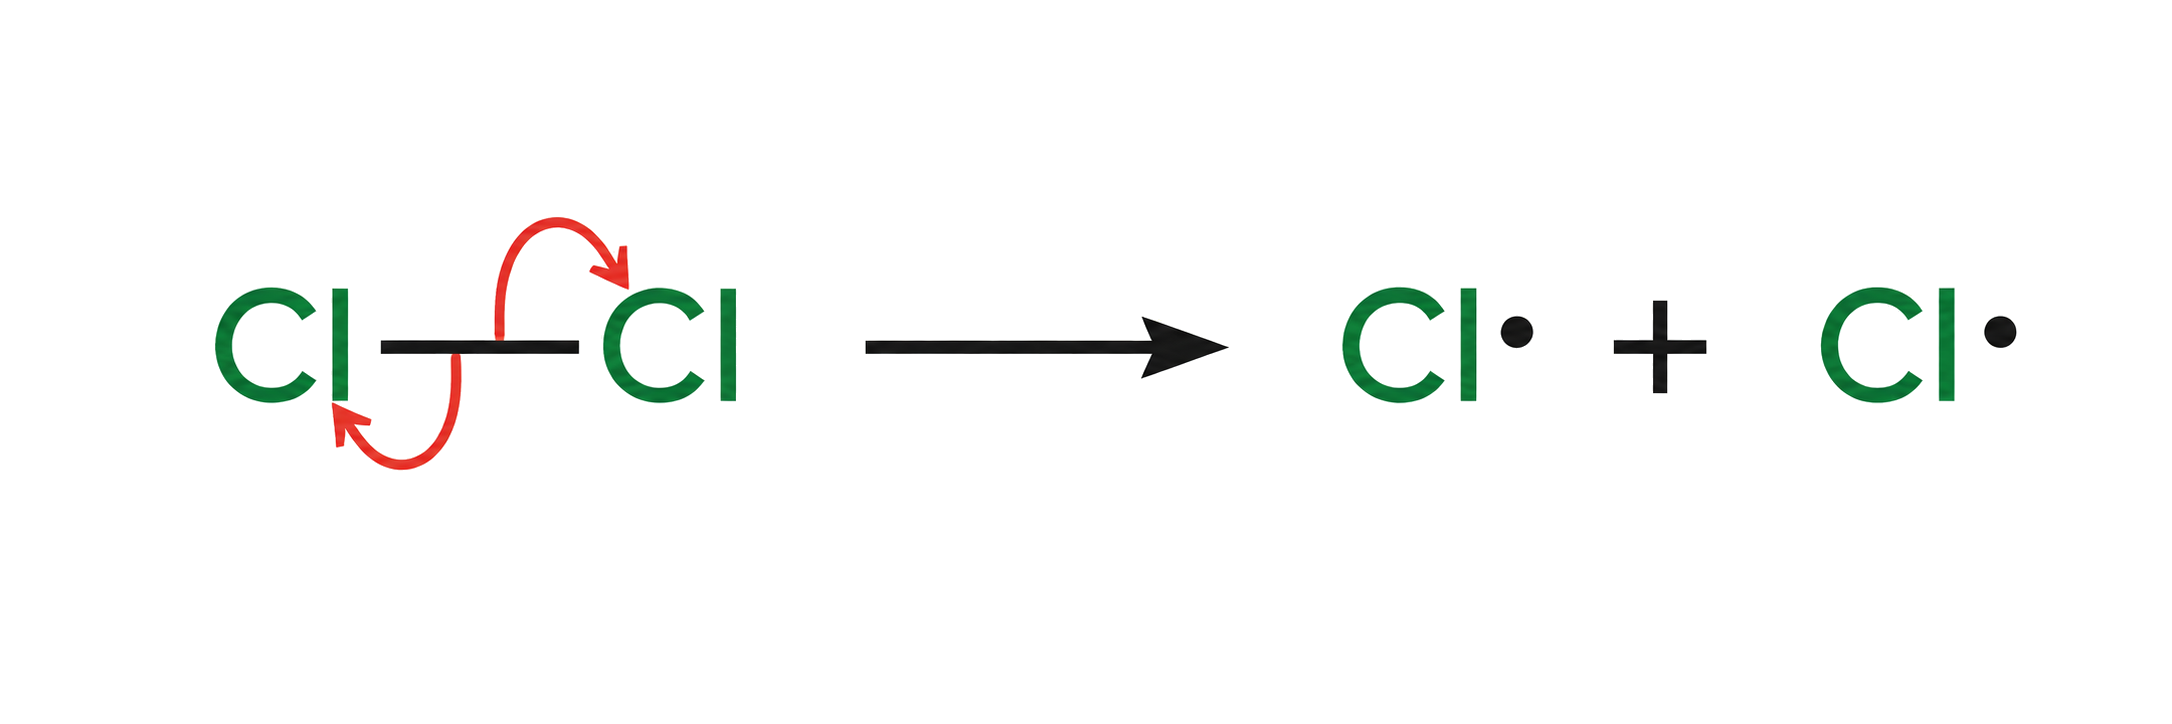
Homolytic fission creates radicals because each covalent-bond fragment retains one bonding electron.
The dot in Cl· or CH₃· represents one unpaired electron, not a positive or negative charge. Radicals react readily because pairing that electron can form a bond; track the dot through every equation so electron and atom accounting remain explicit.
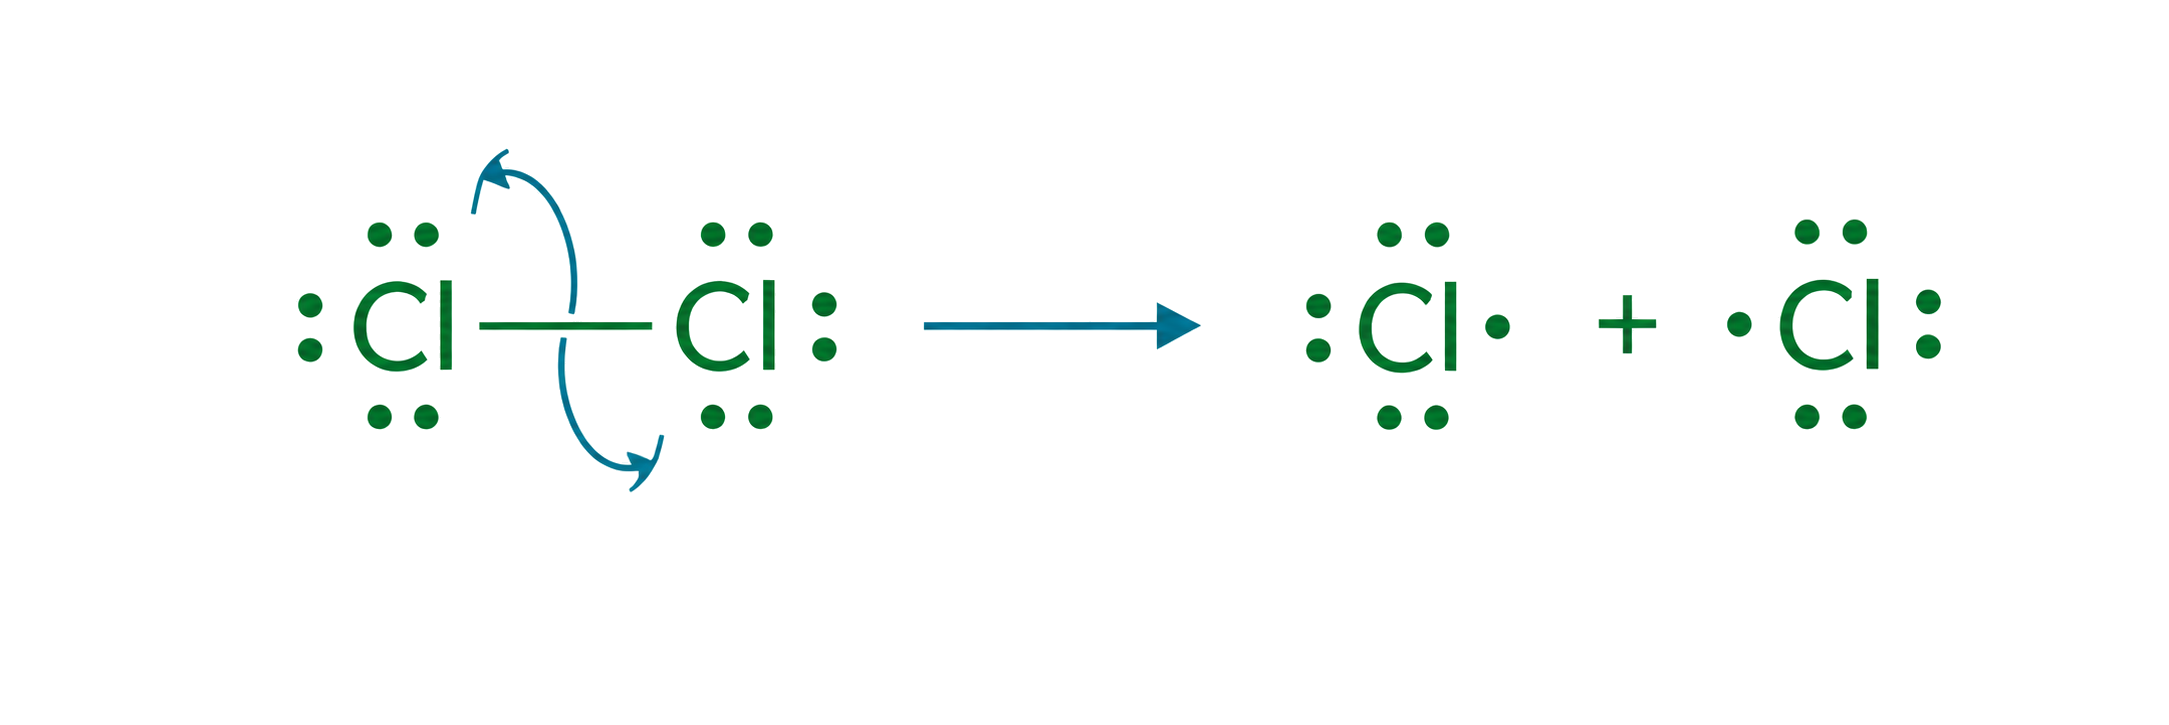
Homolytic cleavage gives one electron to each fragment. Use single-electron arrows to show radical movement in the chain mechanism.
Draw two single-barbed arrows from the breaking X–X bond, one toward each atom, to account for both electrons. The UV or heat step creates radicals and is initiation; a step that consumes one radical and forms another belongs to propagation.
Initiation creates radicals; propagation abstracts H from an alkane and then regenerates the halogen radical; termination combines radicals. A mixture can form because substitution may occur at different positions.
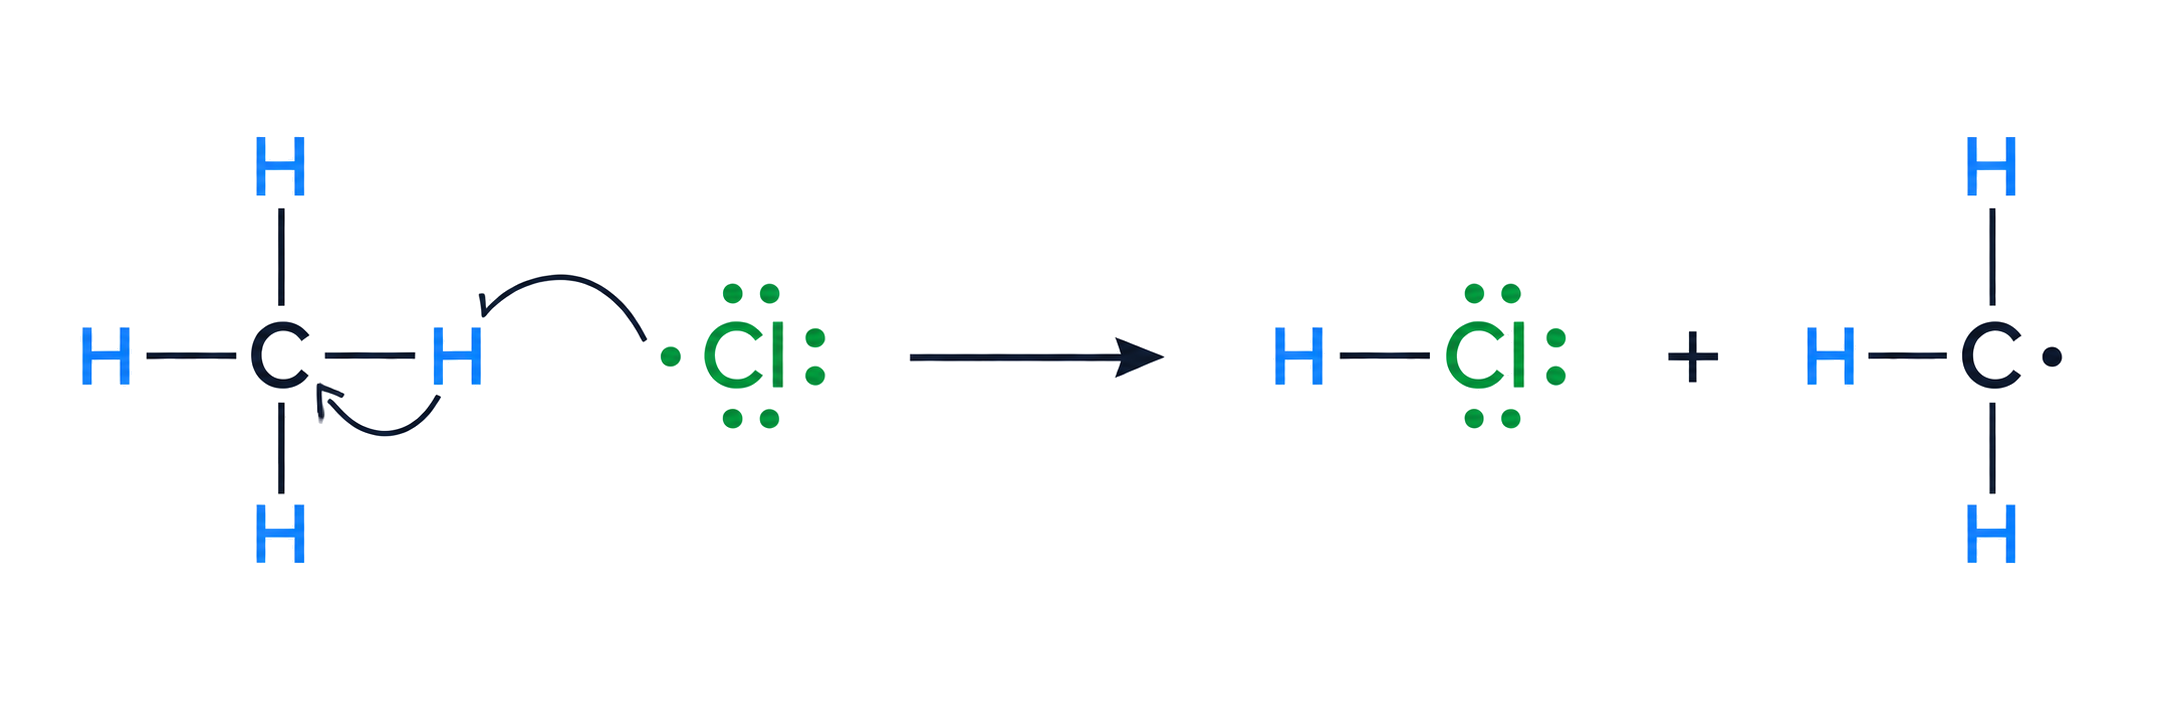
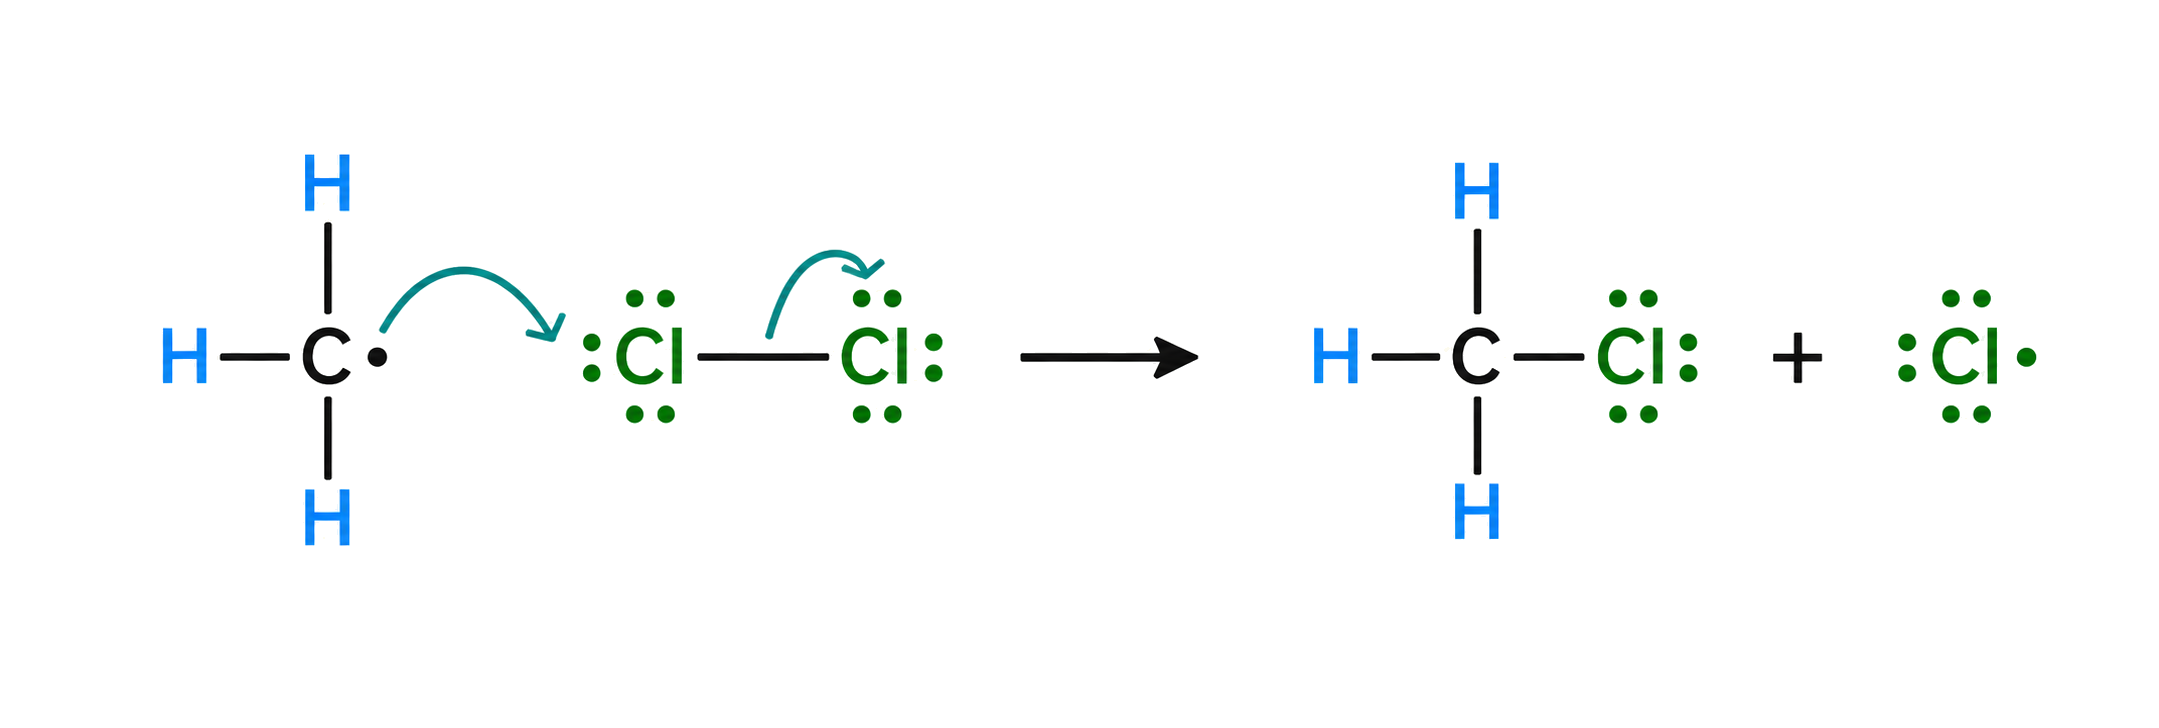
For methane chlorination, initiation forms 2Cl· from Cl₂ under UV. Propagation uses Cl· + CH₄ → HCl + CH₃· and CH₃· + Cl₂ → CH₃Cl + Cl·; termination combines two radicals. Further substitution creates a mixture, so the mechanism does not guarantee only CH₃Cl.
A nucleophile is an electron-rich species that donates an electron pair to an electron-deficient centre.
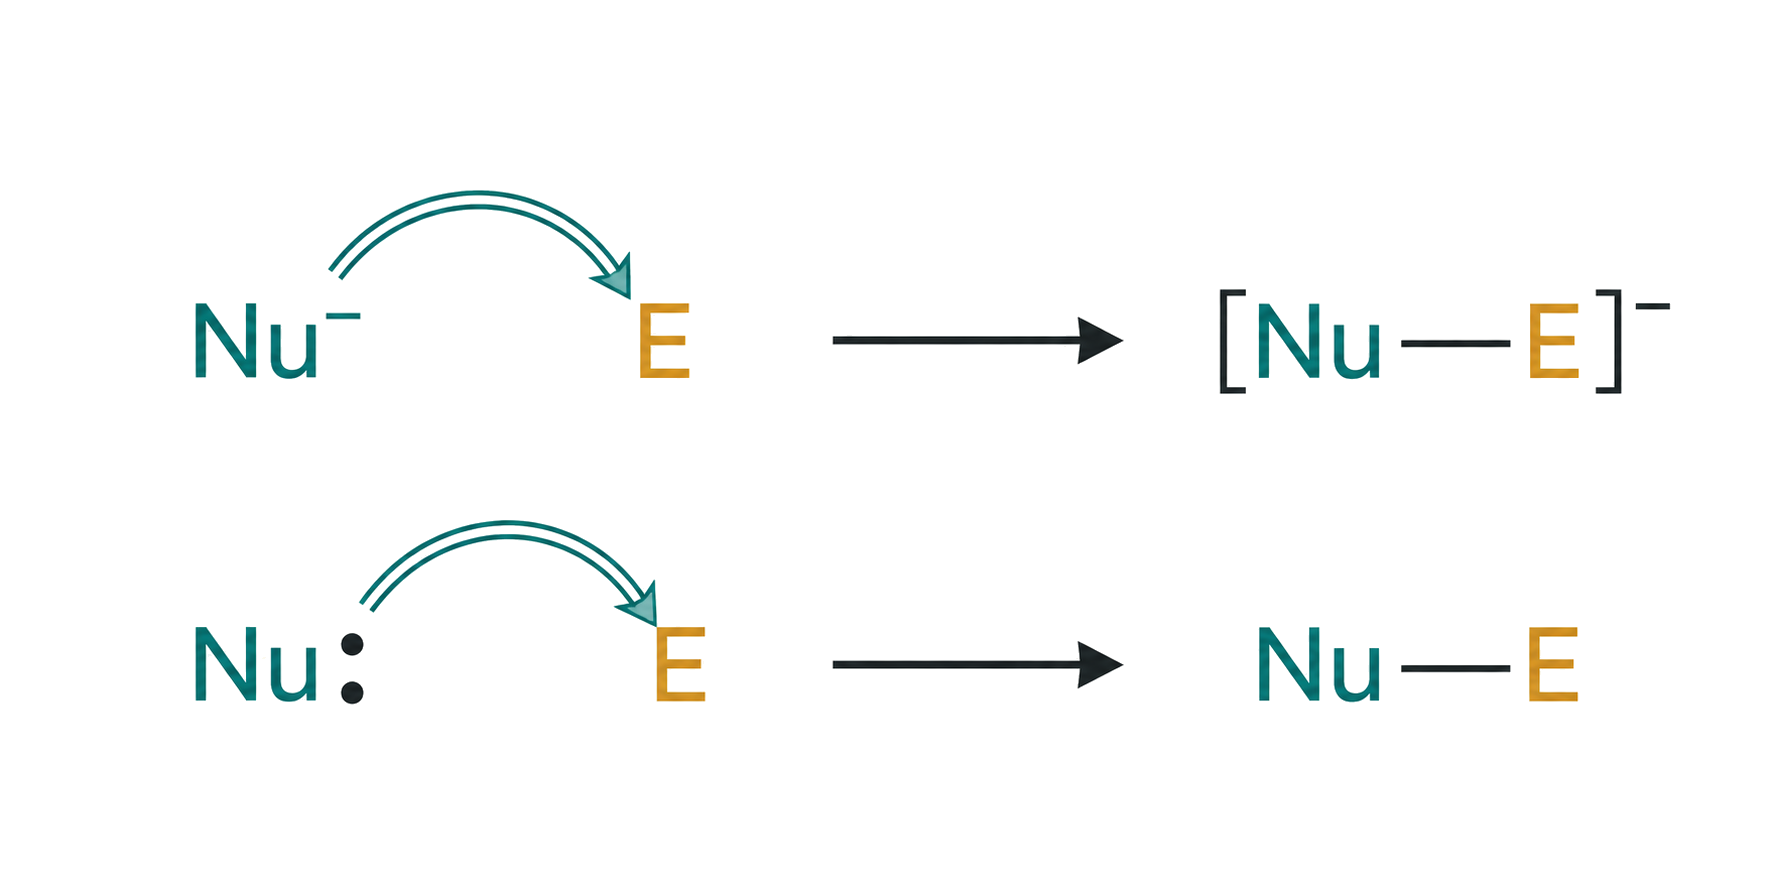
Look for an available electron pair: OH⁻ and CN⁻ use a negative charge and lone pair, while NH₃ uses a lone pair without being an anion. A curly arrow must start at that pair and point toward the atom where the new bond forms.
The nucleophile donates a pair to carbon while the leaving group departs with its bonding pair. Deduce the product by replacing the leaving group with the nucleophile.
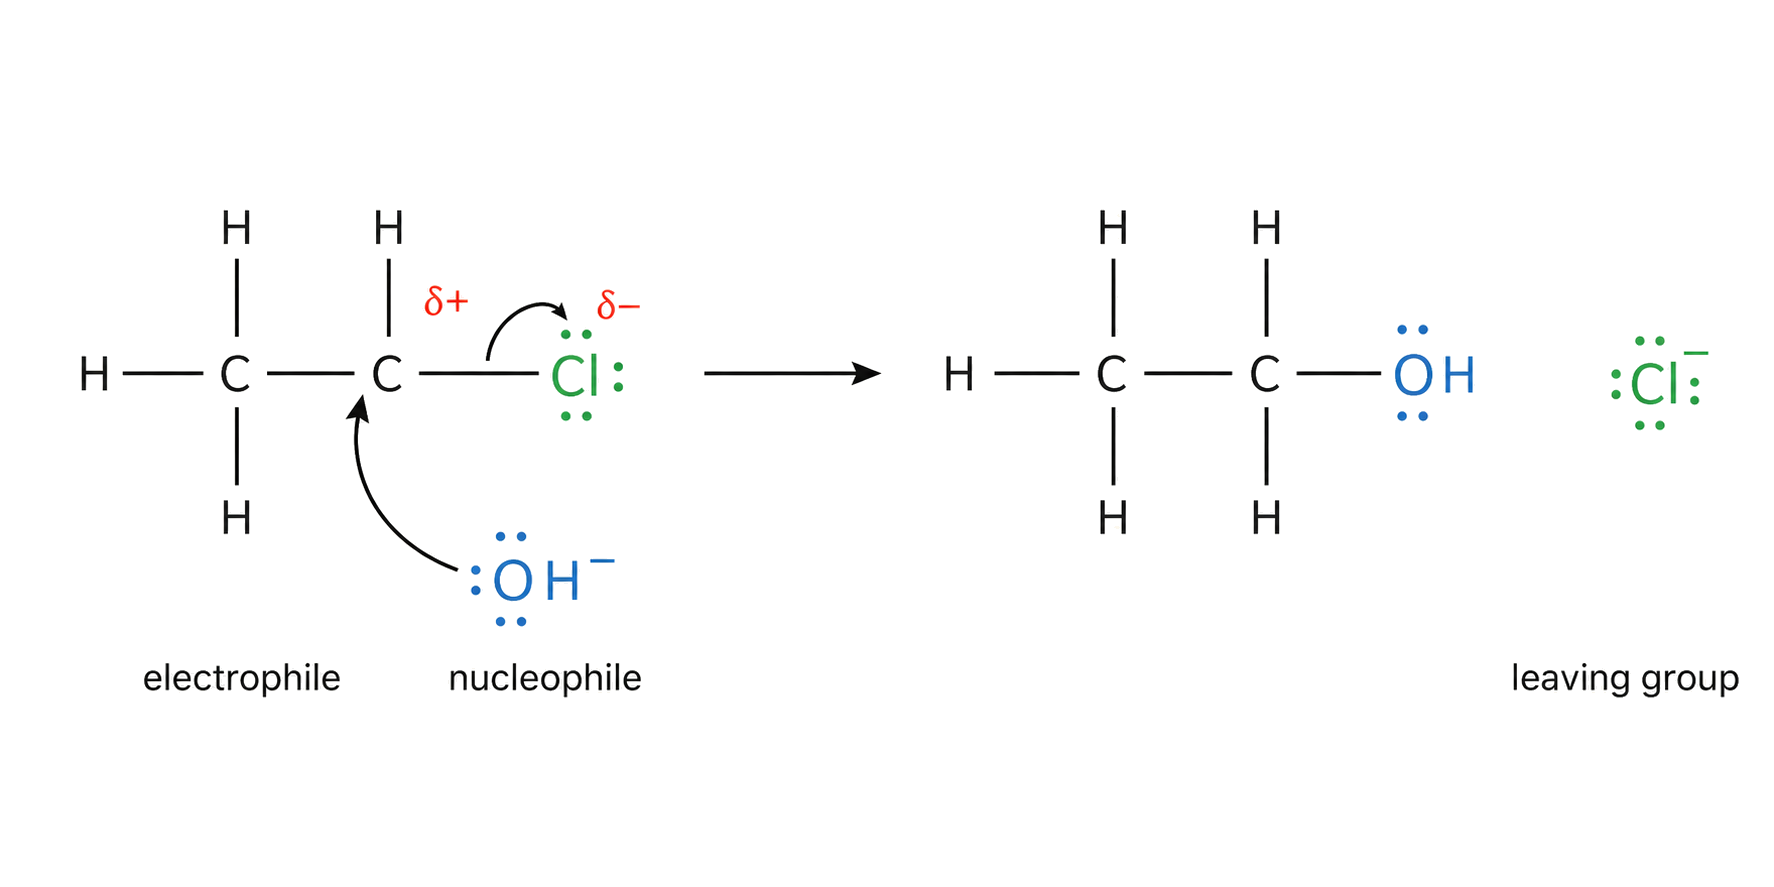
For CH₃CH₂Br + OH⁻, the C–O bond forms as the C–Br bond breaks, giving CH₃CH₂OH + Br⁻. Account for charge and every atom in the product; the leaving group takes the bonding pair rather than departing as a neutral bromine atom.
In heterolytic fission both bonding electrons remain with one fragment, producing ions. Curly arrows show movement of an electron pair.
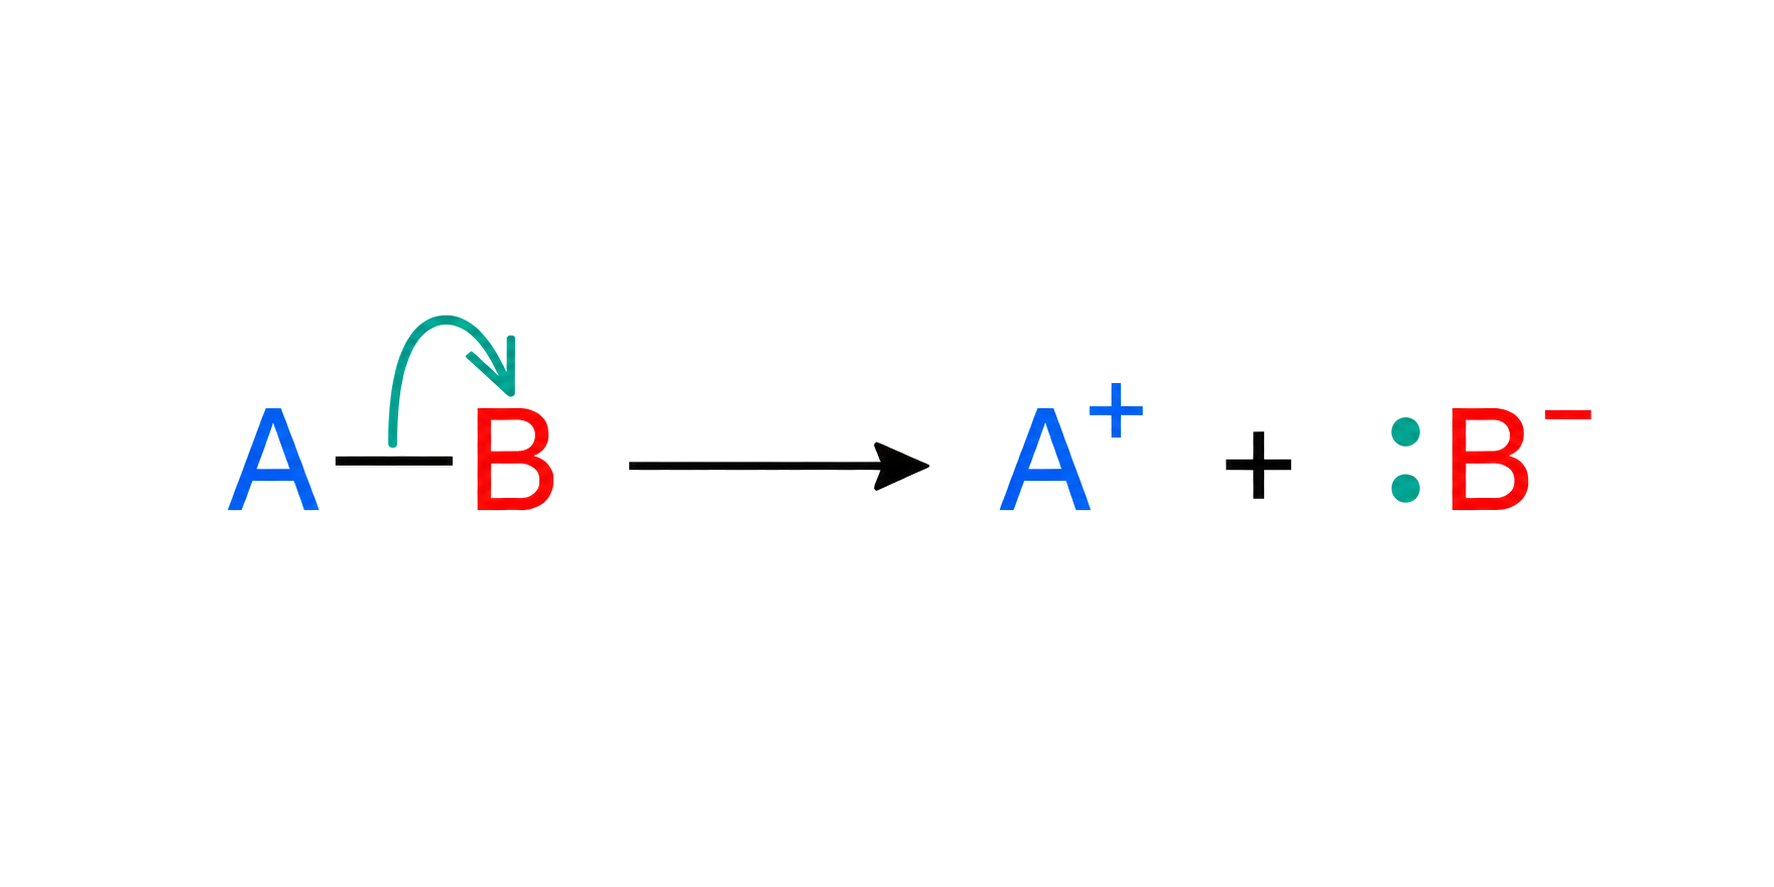
Place the curly-arrow tail on the bond being broken and its head on the fragment receiving both electrons. Then assign charges from electron ownership: heterolysis creates ions, unlike homolysis, which gives one electron to each radical.
An electrophile is an electron-deficient species that accepts an electron pair from a nucleophile.
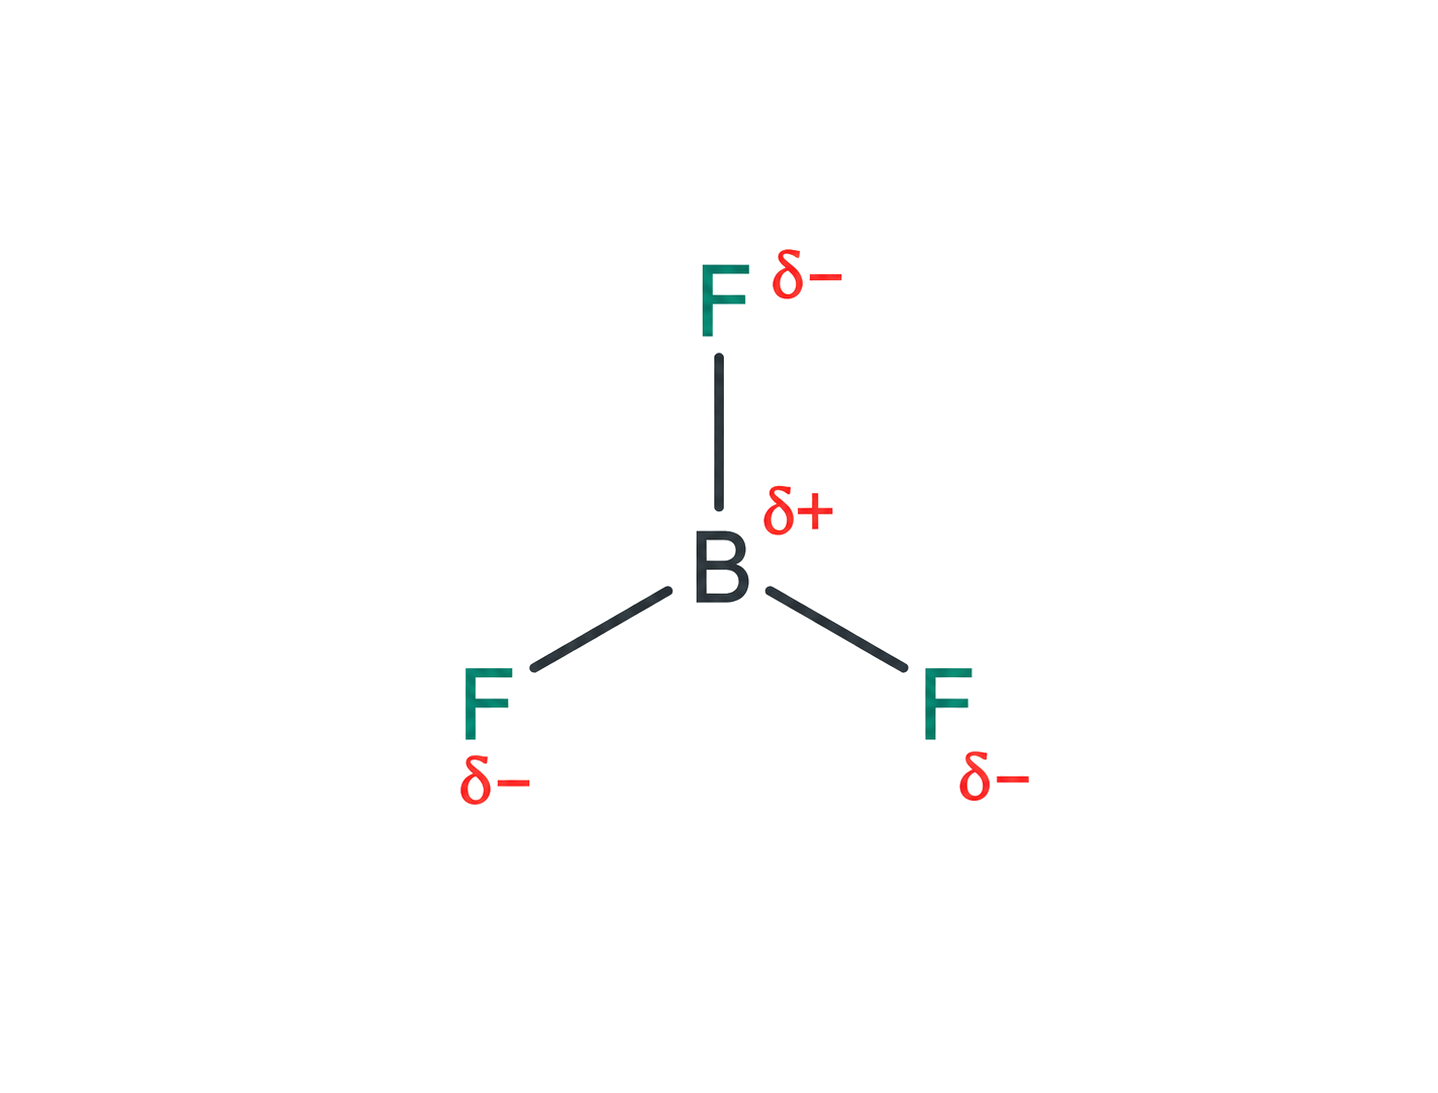
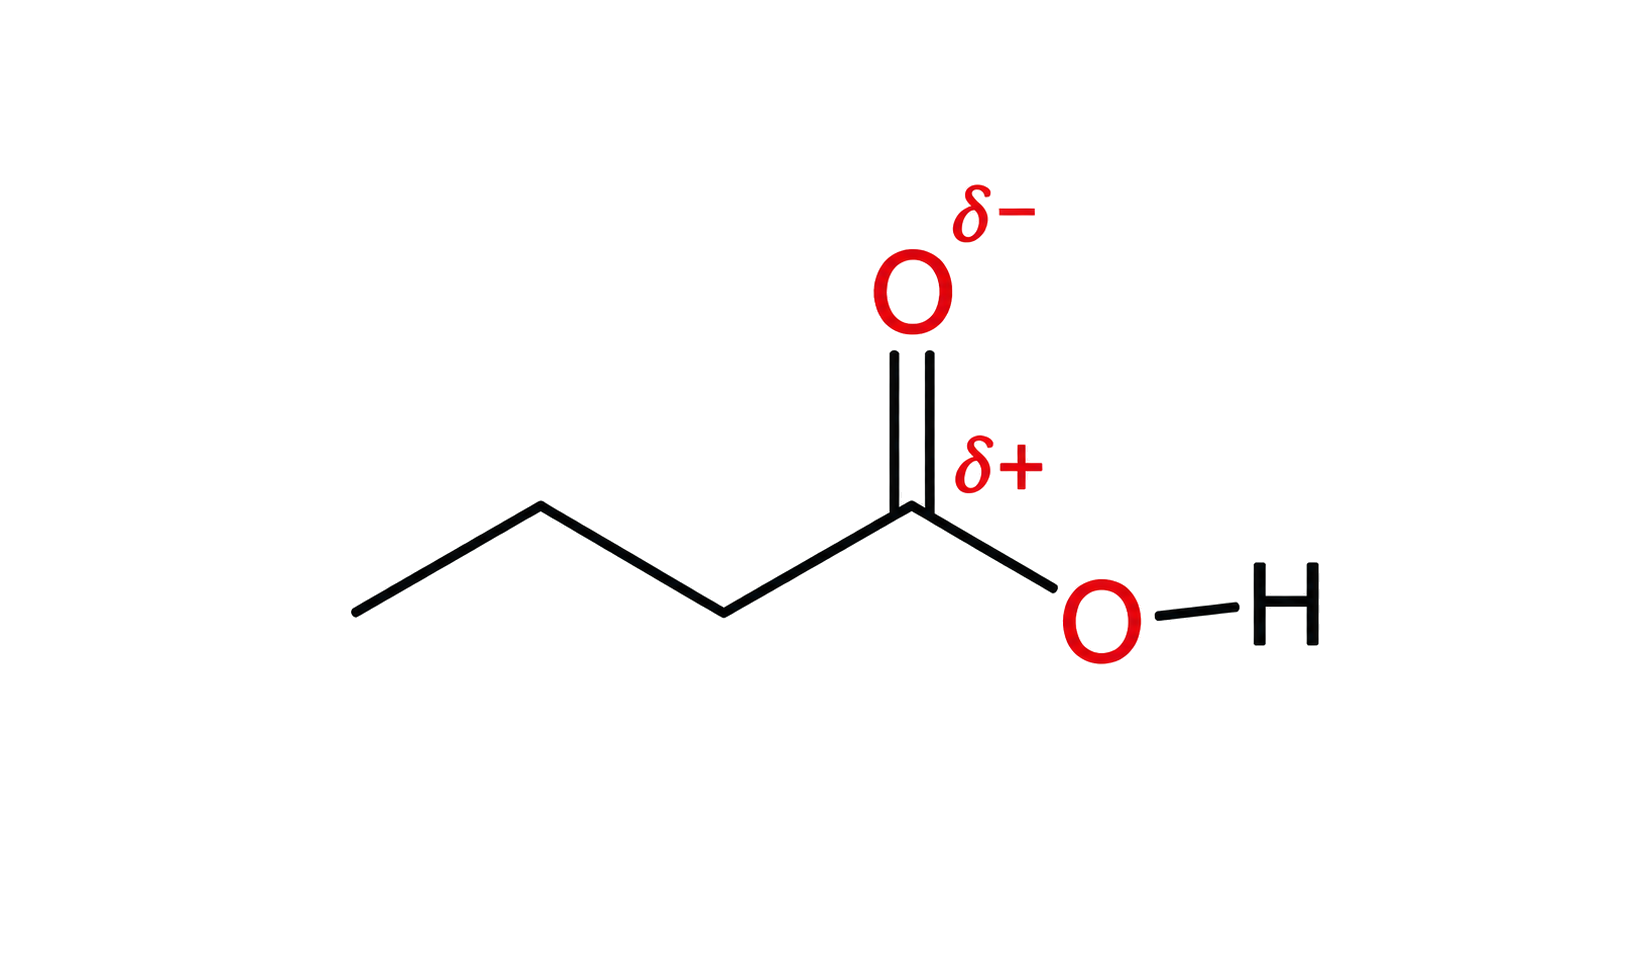
Identify the electron-poor atom, not merely a positive-looking formula. H⁺ and carbocations are electrophiles, and the δ⁺ carbon in a polar C–X bond can also accept a pair. The incoming curly arrow ends at this acceptor.
The electron-rich C=C attacks an electrophile. Deduce addition products with water, halogens or hydrogen halides within the SL mechanism boundary.
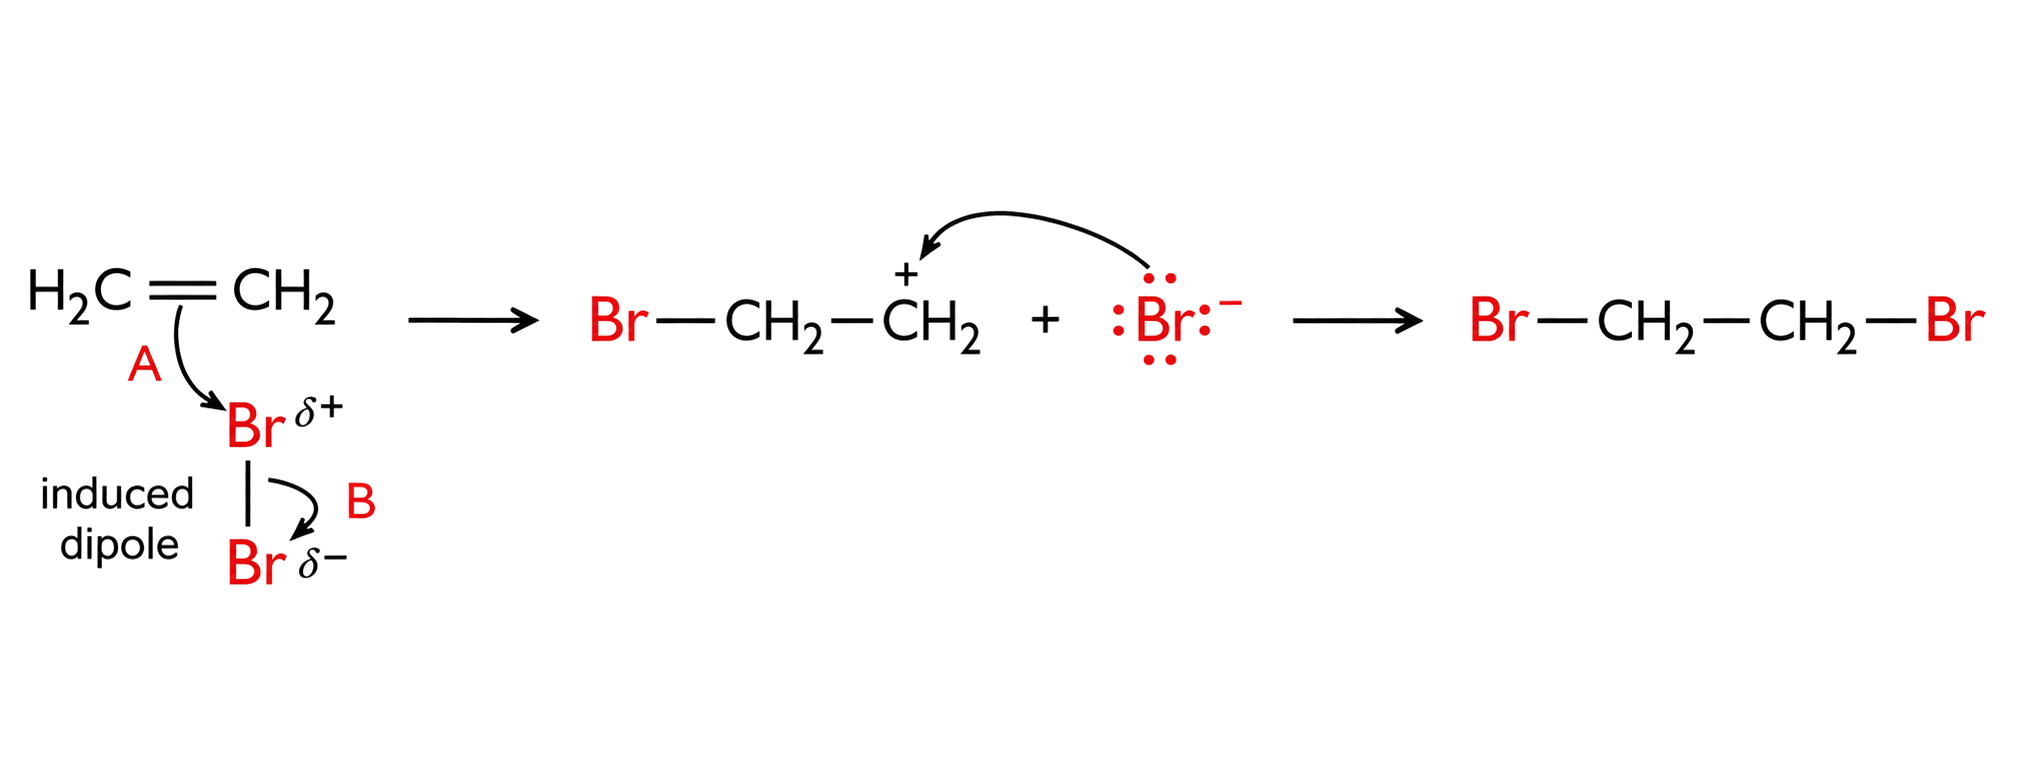
Treat the C=C as the reactive site and place the two added groups on its two carbon atoms. Bromine addition removes the double bond and forms a dibromoalkane; hydration forms an alcohol. At SL, deducing these products does not require a mechanism.
| Reagent | Groups added across C=C | Product check |
|---|---|---|
| X₂ (for example Br₂) | X and X | vicinal dihalogenoalkane; C=C becomes C–C |
| HX | H and X | halogenoalkane; conserve the H and halogen from HX |
| H₂O/steam under acid-catalysed hydration conditions | H and OH | alcohol; conserve the carbon skeleton |
At SL, use reagent and atom conservation to deduce products; curly-arrow mechanisms are not assessed in this card.
A Lewis acid accepts an electron pair; a Lewis base donates an electron pair. Nucleophiles correspond to Lewis bases and electrophiles to Lewis acids.
In BF₃ + NH₃ → F₃B←NH₃, NH₃ donates the pair and is the Lewis base; BF₃ accepts it and is the Lewis acid. Classify the roles from electron-pair movement rather than from whether H⁺ appears.
A ligand acts as a Lewis base and donates an electron pair to a Lewis-acid transition-metal cation, forming a coordinate bond.
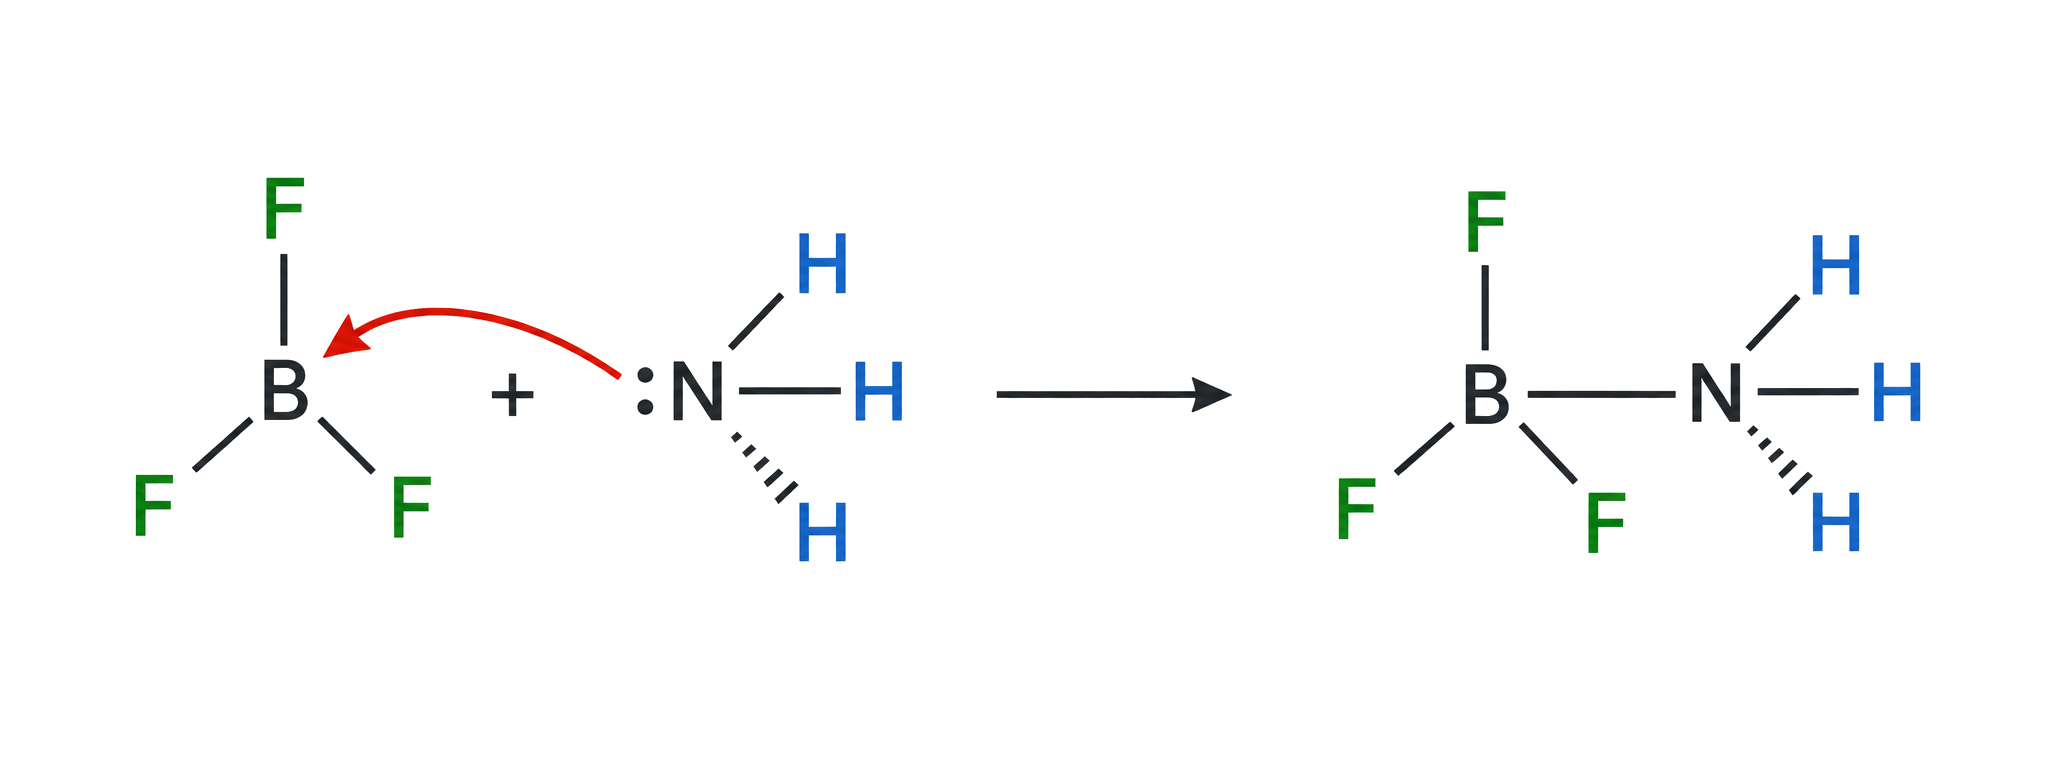
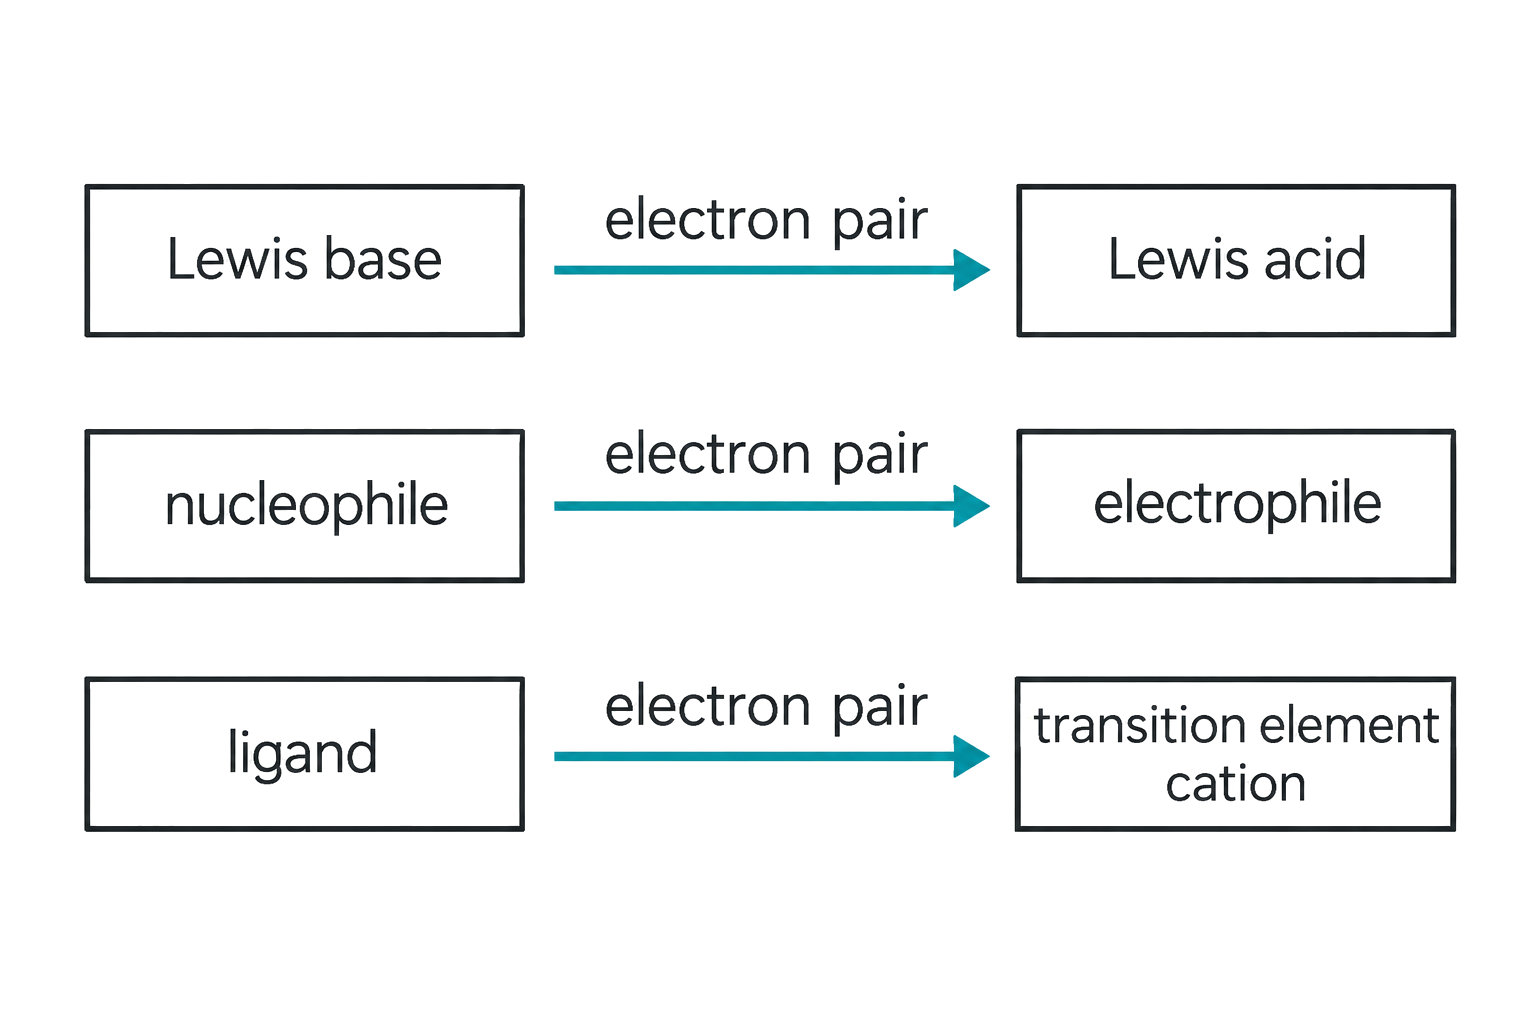
Show a coordination bond with an arrow from a ligand lone pair to the metal ion. The arrow records the origin of the shared pair; after formation the bond is not a different electrostatic species from other covalent bonds.
Identify the central transition-metal cation and the surrounding ligands. Each ligand donates an electron pair to the metal centre.
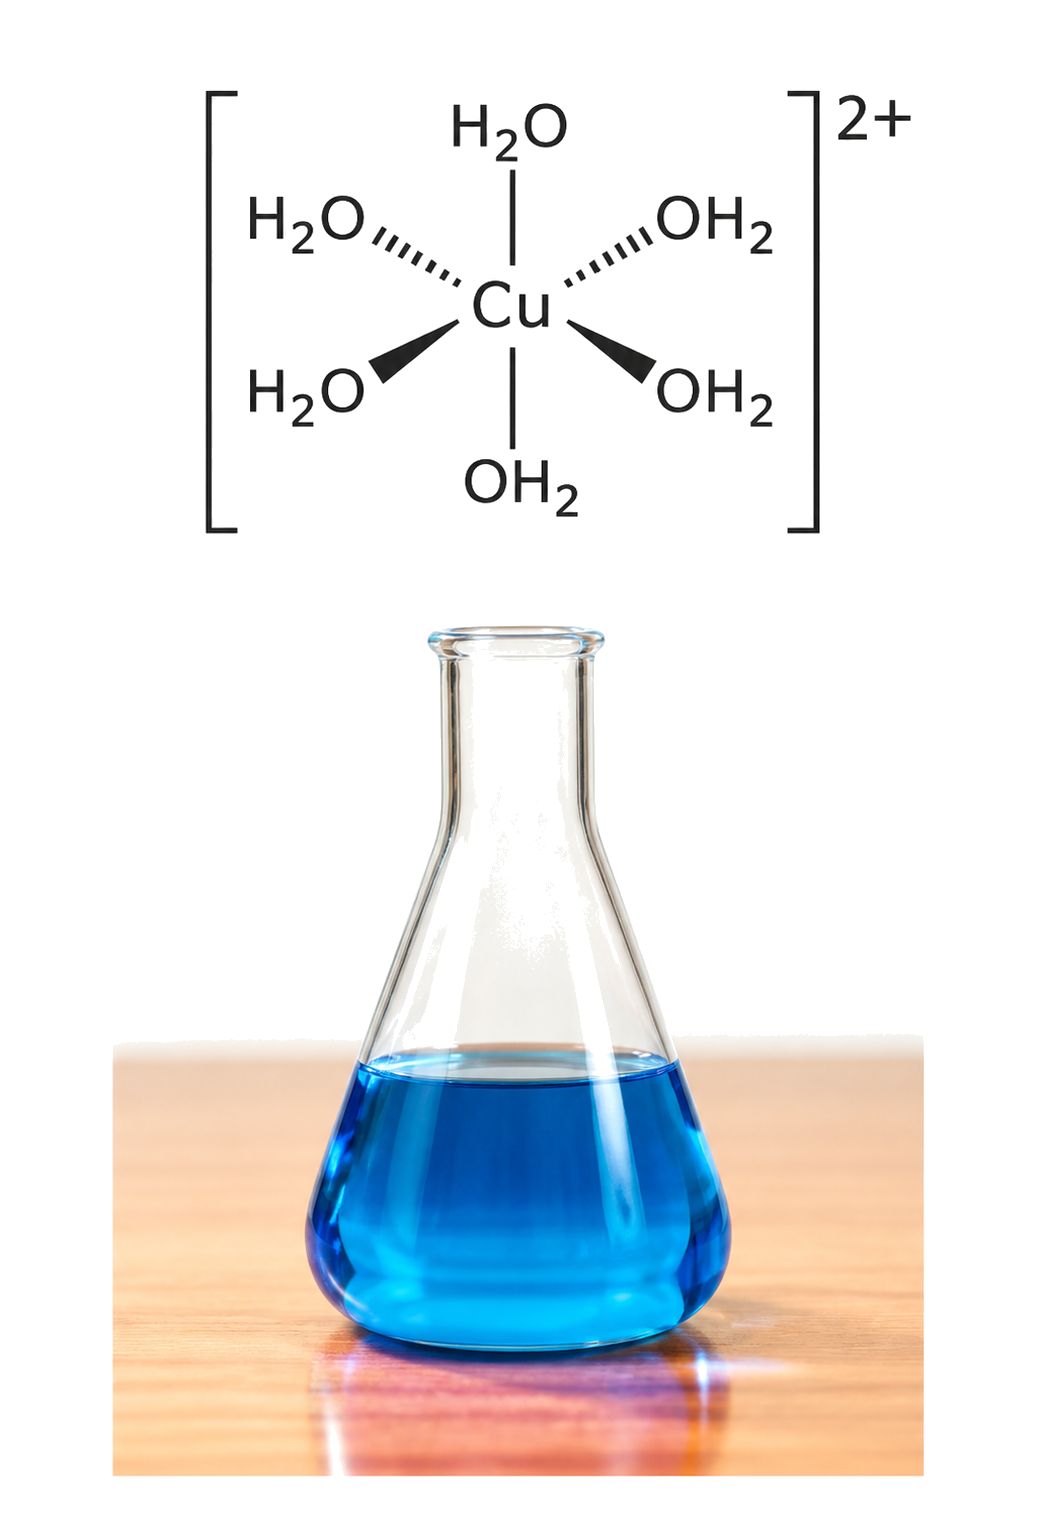
Read [Cu(NH₃)₄]²⁺ as one Cu centre with four NH₃ ligands and coordination number 4. Use ligand charges and the overall bracket charge to deduce the metal oxidation state; do not confuse coordination number with oxidation state.
