3.2 Functional groups: Organic compounds
- Syllabus
- First assessment 2025
- Topic
- 3.2
- Level
- HL
| Representation | What it preserves or shows |
|---|---|
| Empirical | Simplest whole-number atom ratio |
| Molecular | Actual atom counts |
| Structural/condensed | Connectivity in compact form |
| Skeletal | Carbon framework and implied hydrogen |
| Stereochemical/3D | Spatial arrangement |
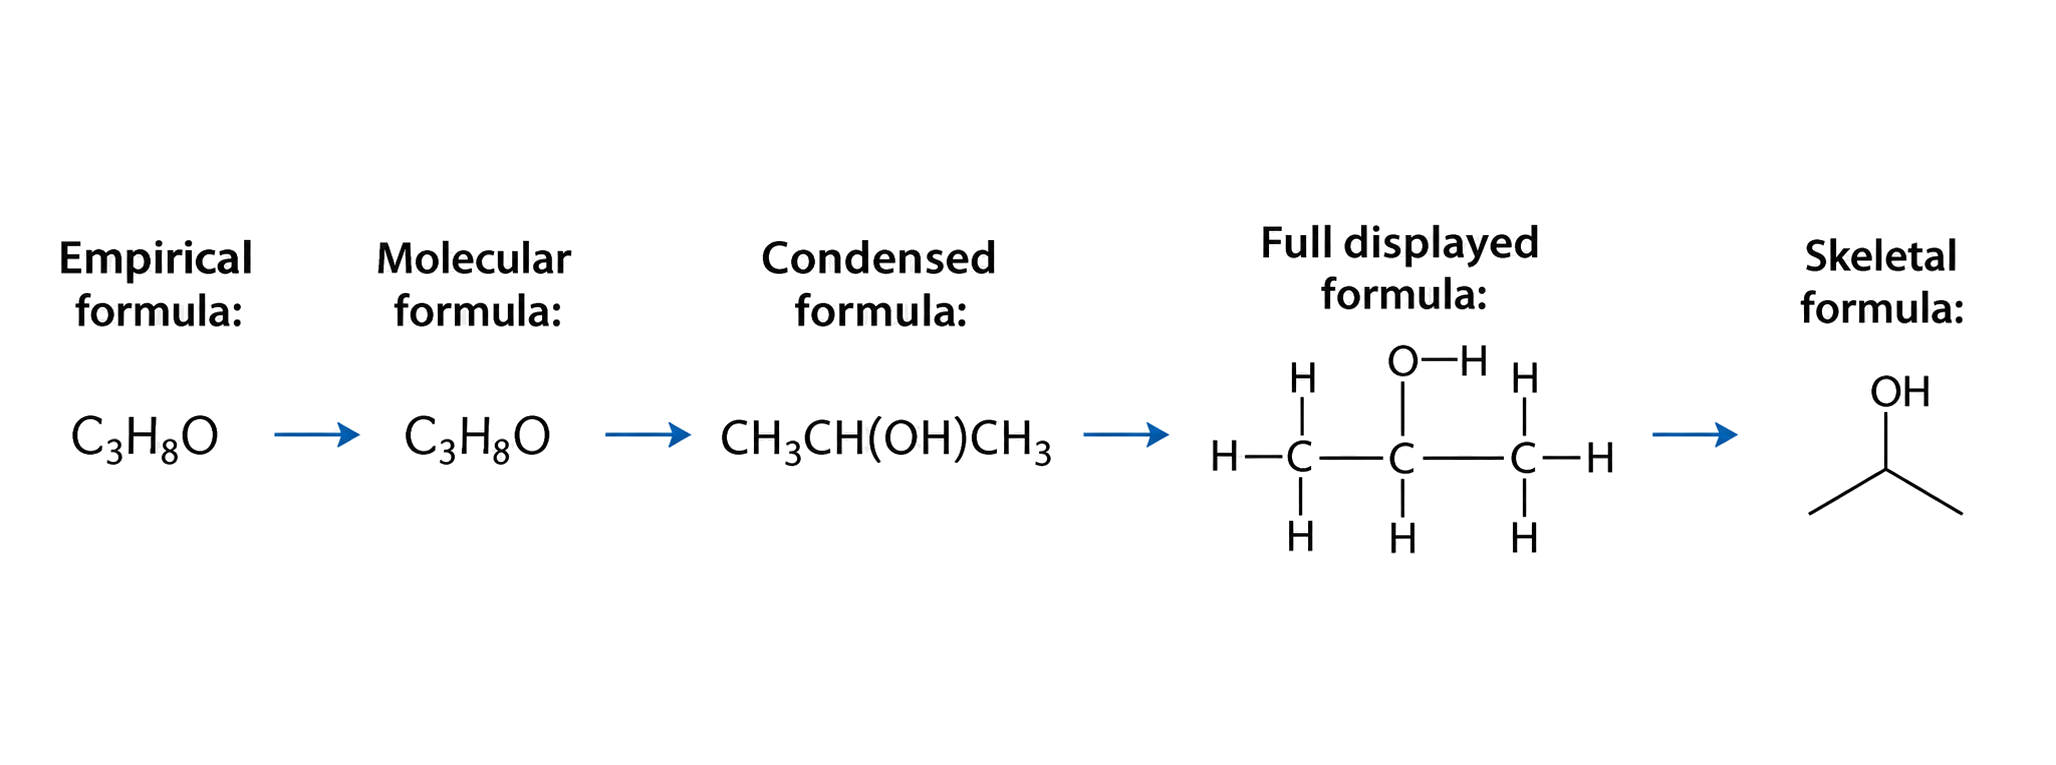
Translate representations without changing atom connectivity. For a skeletal formula, count every vertex and line end as carbon, add enough hydrogens to give carbon four bonds, and write heteroatoms explicitly. Then verify both the molecular formula and the connectivity.
An empirical formula is a ratio, not necessarily the complete molecule: hydrogen peroxide has molecular formula H₂O₂ but empirical formula HO. Reduce all subscripts by their greatest common factor; if no common factor exists, the molecular and empirical formula are identical.
Matching atom totals alone cannot prove two drawings are the same compound: connectivity and, where relevant, stereochemistry must also agree. Do not reduce a molecular formula when the subscripts already have no common factor.
| Family | Complete recognition pattern | Bounded characteristic cue |
|---|---|---|
| Halogenoalkane | C–F/Cl/Br/I | polar C–X bond |
| Alcohol / hydroxyl | C–OH, not the –OH inside –COOH | can donate and accept hydrogen bonds |
| Aldehyde | terminal –CHO carbonyl | polar C=O; terminal carbonyl |
| Ketone | –CO– between carbons | polar C=O; internal carbonyl |
| Carboxylic acid | –COOH | acidic proton and hydrogen bonding |
| Ether / alkoxy | C–O–C | oxygen accepts hydrogen bonds but has no O–H donor |
| Amine / amino | C–N without adjacent carbonyl | basic lone-pair chemistry; N–H species may donate H bonds |
| Amide / amido | –CONH₂/–CONHR/–CONR₂ | nitrogen directly attached to carbonyl |
| Ester | –COO– between carbon groups | carbonyl and single-bond O in one group |
| Phenyl | C₆H₅– attached as a substituent | aromatic ring pattern |
Identify the whole local bonding pattern before naming the group; these cues support classification, not a complete reaction mechanism.
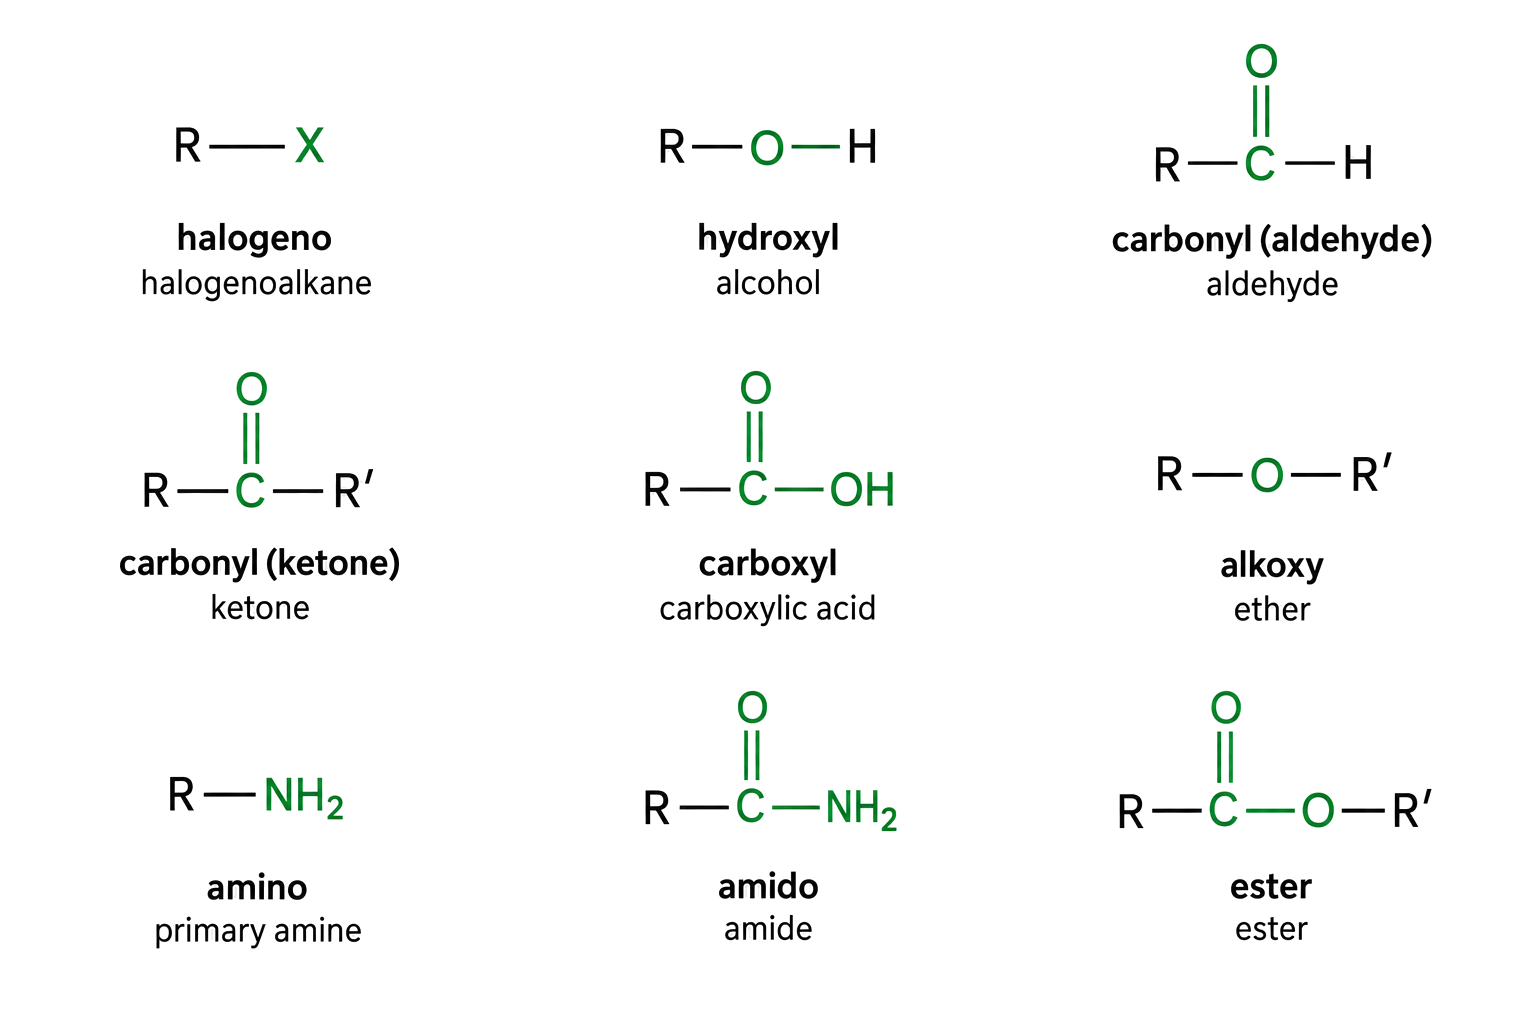
Identify the characteristic atoms and bonding pattern first, then give the functional-group name and relevant property context.
Identify the complete bonding pattern: an aldehyde has a terminal –CHO carbonyl, a ketone has C=O between carbons, and an ester contains –C(=O)–O–. Do not label every O–H as an alcohol or every C–N as an amine without checking the neighbouring carbonyl.
Saturation describes carbon-carbon bonding: a saturated compound has only C-C single bonds, while an unsaturated compound contains at least one C=C or C≡C bond. A carbonyl C=O does not by itself make the carbon skeleton unsaturated. Identify saturation separately from identifying hydroxyl, carbonyl, carboxyl or other functional groups.
| Step | Naming decision |
|---|---|
| 1 | Choose the longest parent chain |
| 2 | Number to give the relevant feature the lowest locant |
| 3 | Identify unsaturation and functional group |
| 4 | Assemble prefixes, locants, and suffix |
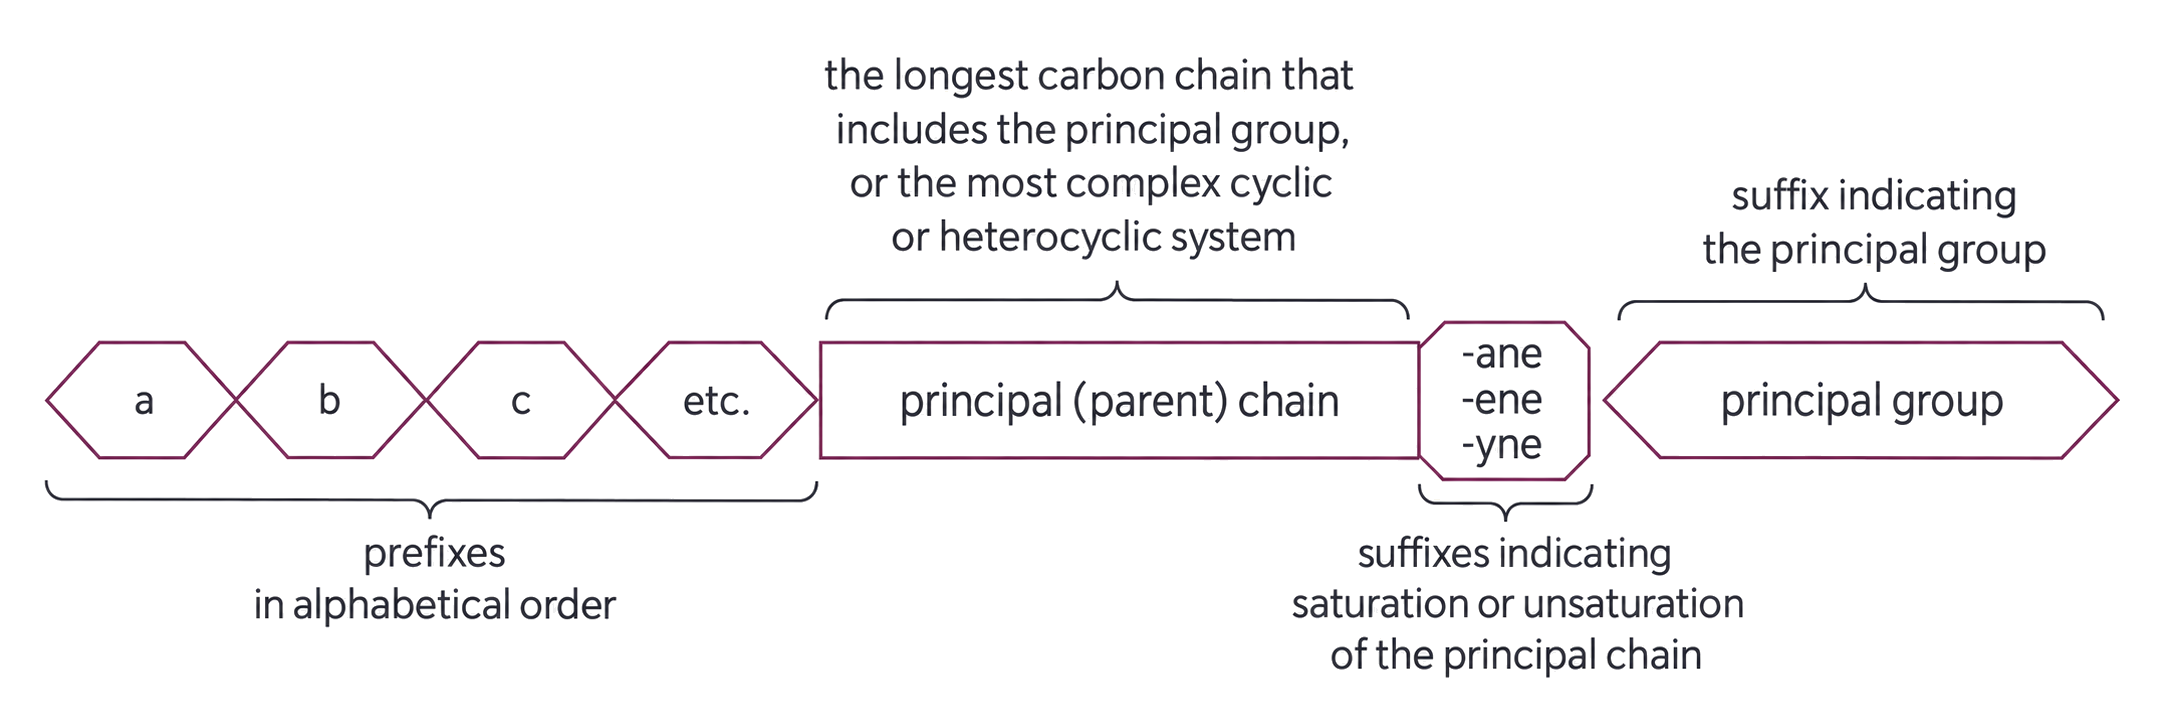
Apply the systematic sequence to saturated or mono-unsaturated compounds with up to six carbons and one functional-group type.
For CH₃CH(OH)CH(CH₃)CH₃, choose the four-carbon chain containing –OH, number from the end that gives –OH the lower locant, and name 3-methylbutan-2-ol. The principal suffix controls numbering before a substituent does; check locants, punctuation and retained unsaturation at the end.
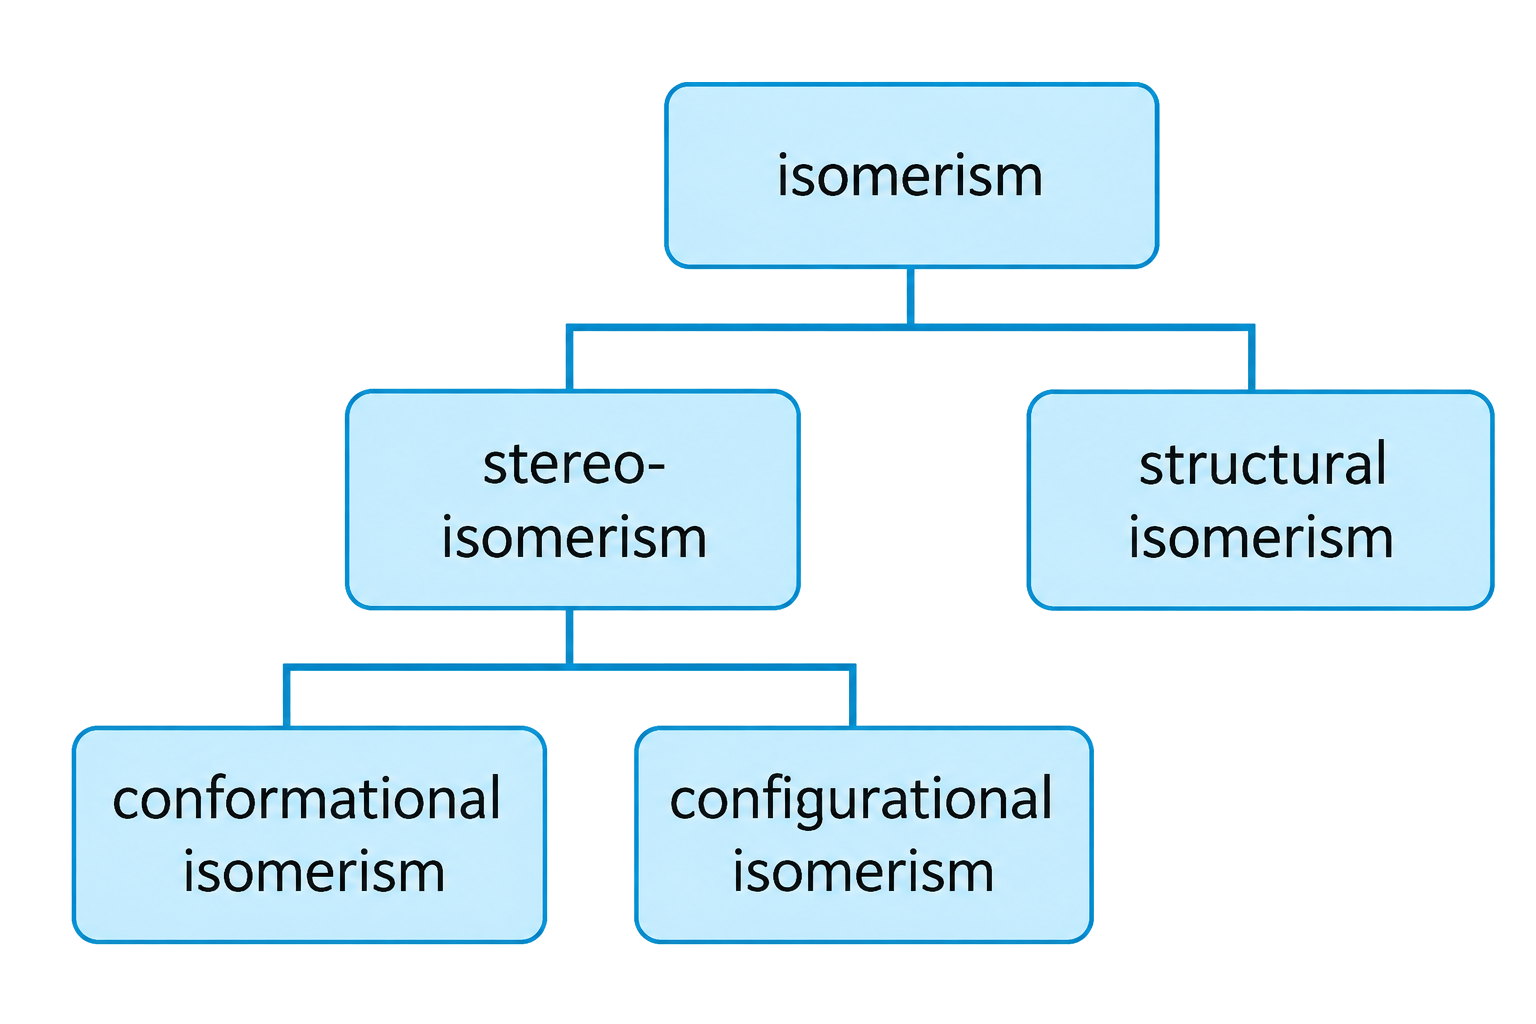
Structural isomers have the same molecular formula but different atom connectivities. Types include straight-chain/branched, position, and functional-group isomers.
Classify primary, secondary, and tertiary alcohols, halogenoalkanes, and amines by the carbon or nitrogen environment attached to the functional group.
| Family | Primary / secondary / tertiary test |
|---|---|
| Alcohol | count carbon groups attached to the carbon bearing -OH: 1 / 2 / 3 |
| Halogenoalkane | count carbon groups attached to the carbon bearing X: 1 / 2 / 3 |
| Amine | count carbon groups attached directly to N: 1 / 2 / 3 |
C₄H₁₀O can represent different carbon skeletons, different –OH positions, or an ether instead of an alcohol. Draw each connectivity once, then compare molecular formulae. Rotating or redrawing one connectivity does not create a new structural isomer.
For alcohols and halogenoalkanes, classify the carbon carrying the functional group; for amines, classify the nitrogen by how many carbon groups are bonded to it. Do not use the position number alone: butan-2-ol is secondary because its OH-bearing carbon is attached to two other carbons.
Stereoisomers have the same constitution but different spatial arrangements. Cis-trans isomerism requires restricted rotation, while enantiomers are non-superimposable mirror images caused by a chiral carbon.
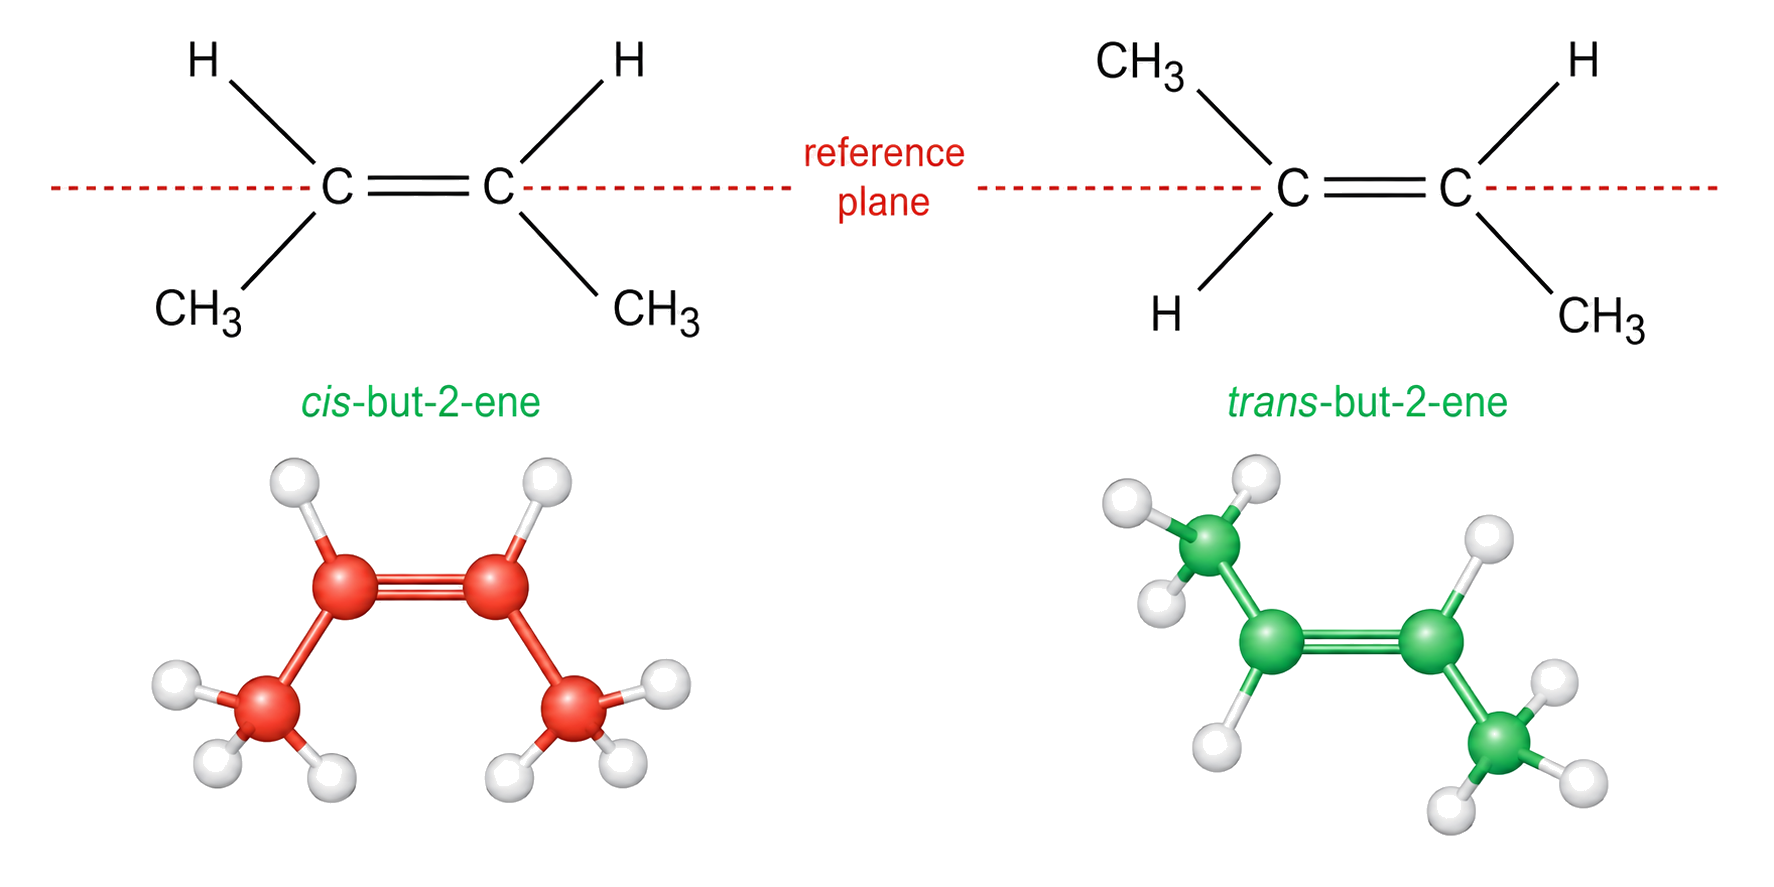
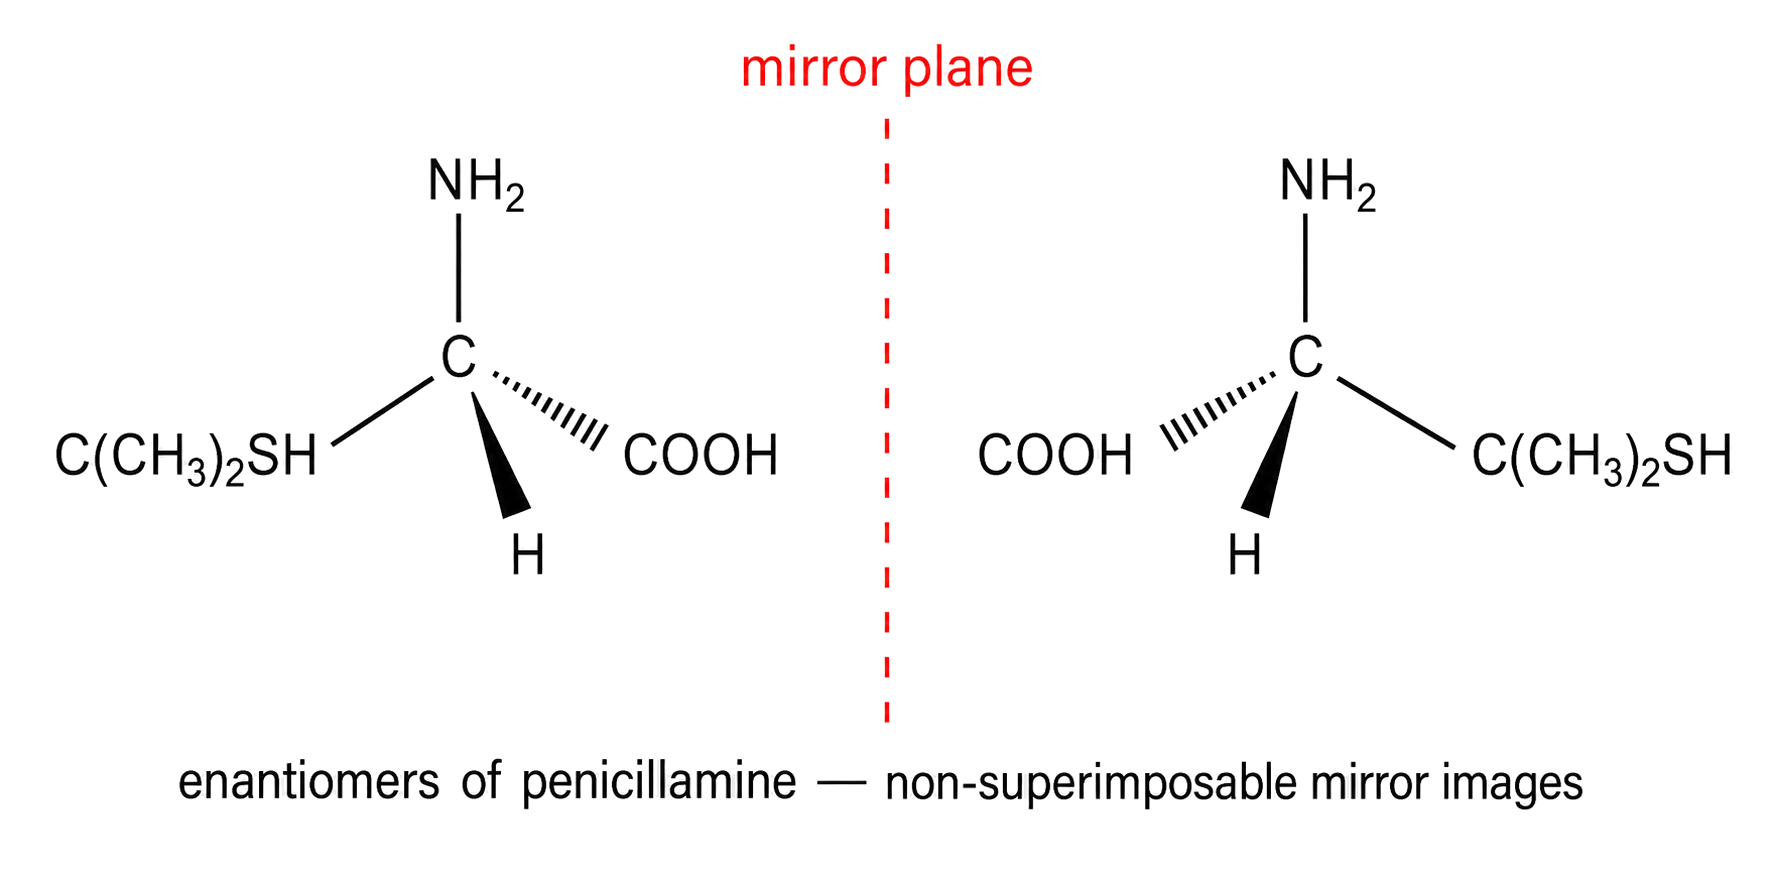
Check the spatial arrangement, not just connectivity, and identify whether the case is a non-cyclic alkene/cycloalkane cis-trans pair or a chiral mirror-image pair.
For alkene cis–trans isomerism, each C of the C=C must carry two different groups; restricted rotation alone is not enough. For chirality, verify four different substituents on one tetrahedral carbon and test whether the mirror-image pair can be superimposed.
In a substituted C3 or C4 cycloalkane, restricted ring geometry gives cis when relevant substituents are on the same side of the ring and trans when they are on opposite sides. For a chiral centre, a solid wedge points out of the page and a dashed wedge behind it. A pair of enantiomers rotates plane-polarized light in opposite directions; an equal racemic mixture has no net rotation. E/Z nomenclature is outside this syllabus scope.
The molecular-ion peak provides a mass constraint, while fragmentation peaks reveal structural features of the organic molecule. Use the supplied fragment data rather than assuming an operational mechanism not given.
![m/z 31 [CH2OH]+ is the base peak; m/z 29 [CH3CH2]+ is a detected fragment; m/z 60 is the propan-1-ol molecular radical cation; both schemes cleave the bond between CH3CH2 and CH2OH.](https://cheese-dev-public.oss-accelerate.aliyuncs.com/interactive-content/images/chemistry/ib-knowledge-cards/v1/batch-029/propan-1-ol-mass-spectrum-fragments-v2.png)
For the commonly supplied singly charged positive ions, z = +1 so the numerical m/z value can be read as the ion mass; state or check that assumption if charge is not specified. Build a candidate grid: first match the molecular ion to Mr, then ask whether each proposed structure can conserve atoms while producing every supplied diagnostic fragment. A fragment supports a substructure, but cannot by itself prove the full connectivity.
Separate two jobs: the molecular-ion peak constrains relative molecular mass, while a fragment peak constrains a possible substructure. The tallest base peak is the most abundant detected ion and need not be M⁺; accept a candidate only if its formula can account for the supplied fragment masses.
IR absorptions identify bond types through characteristic wavenumbers. Use the functional-group region and the supplied data-booklet values to match absorptions with structural features.
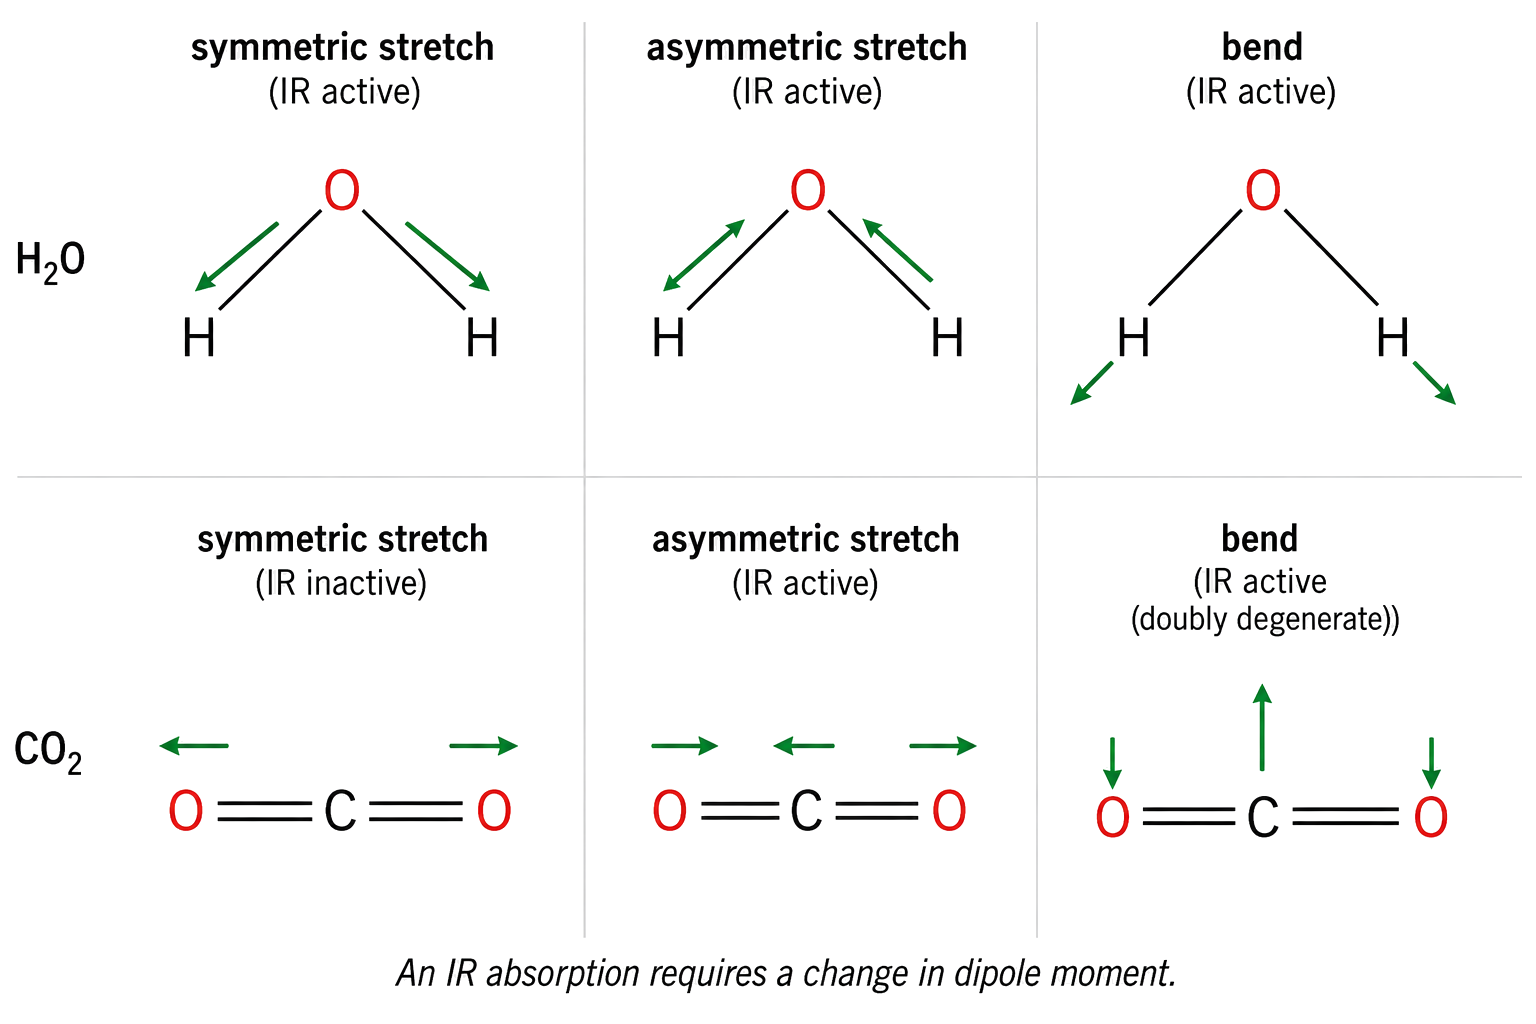
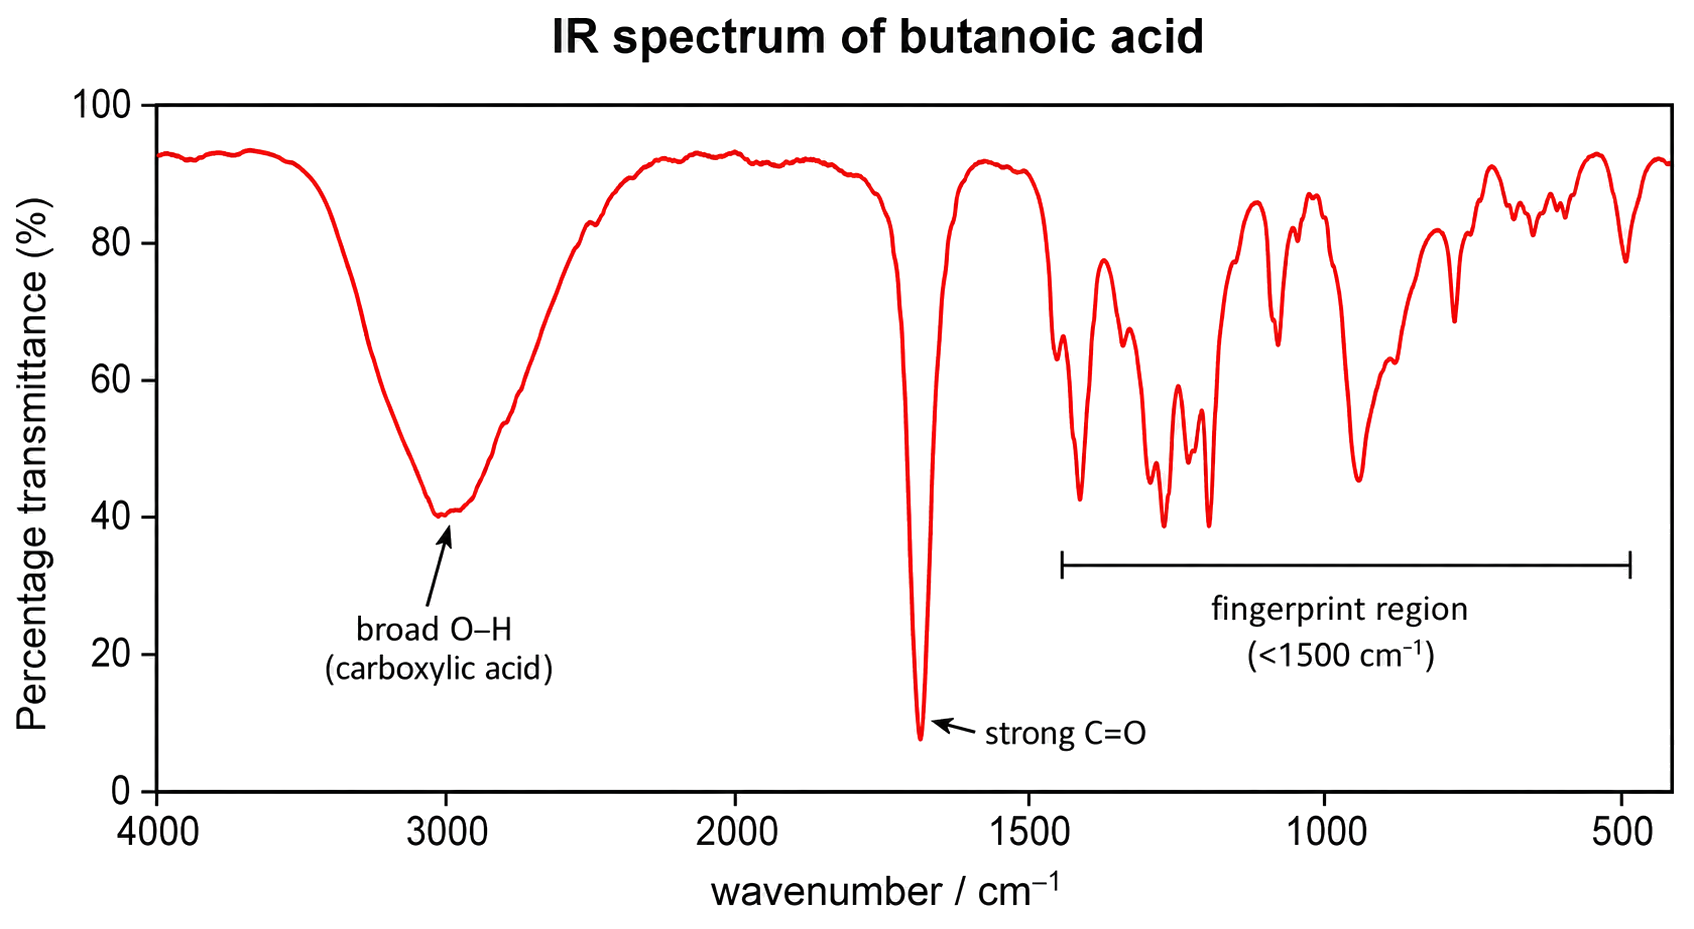
Treat an absorption as evidence for a bond or functional group, then check whether the proposed structure accounts for all decisive peaks.
A broad O–H absorption and a strong C=O absorption together support a carboxylic acid more strongly than either peak alone. Use the data-booklet range, then check both presence and absence of decisive absorptions; IR identifies bonds and groups, not a unique whole structure by itself.
Greenhouse-gas link: an IR-active vibration must change the molecule's dipole moment, allowing it to absorb matching outgoing infrared radiation. A molecule can be non-polar overall yet have IR-active vibrations; is the key example. Absorption at characteristic wavenumbers supports the presence of particular vibrating bonds, but greenhouse effect also depends on concentration, absorption bands and atmospheric lifetime, not one peak alone.
| NMR feature | Information |
|---|---|
| Number of signals | Number of hydrogen environments |
| Chemical shift | Environment type |
| Integration | Relative number of hydrogens in each environment |
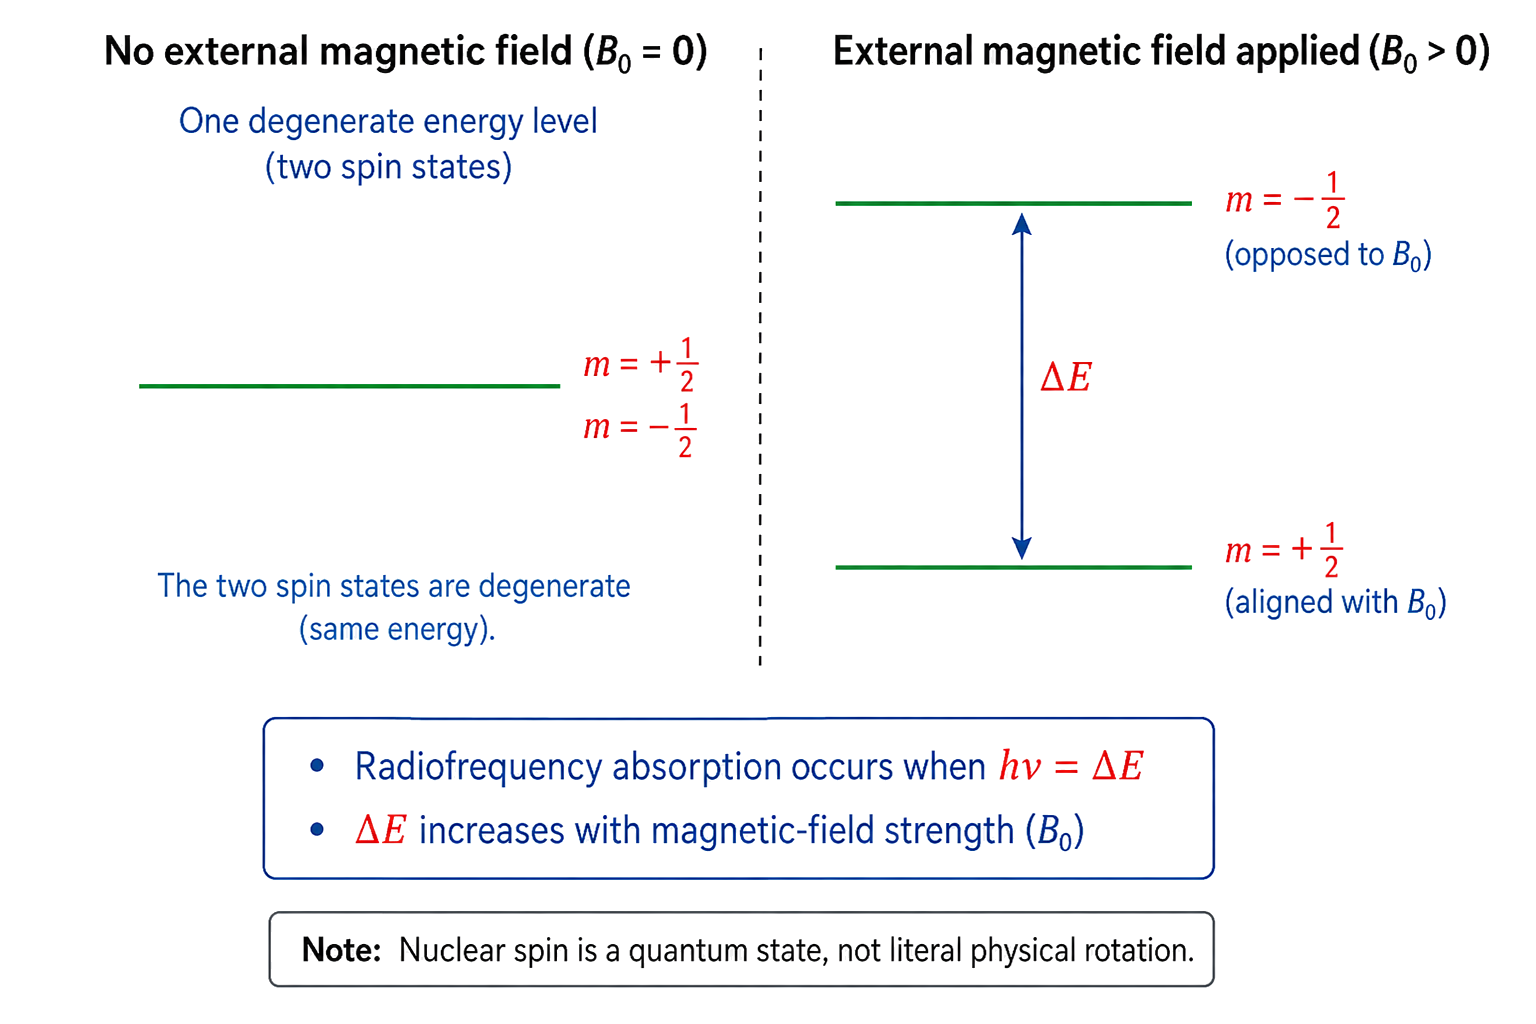
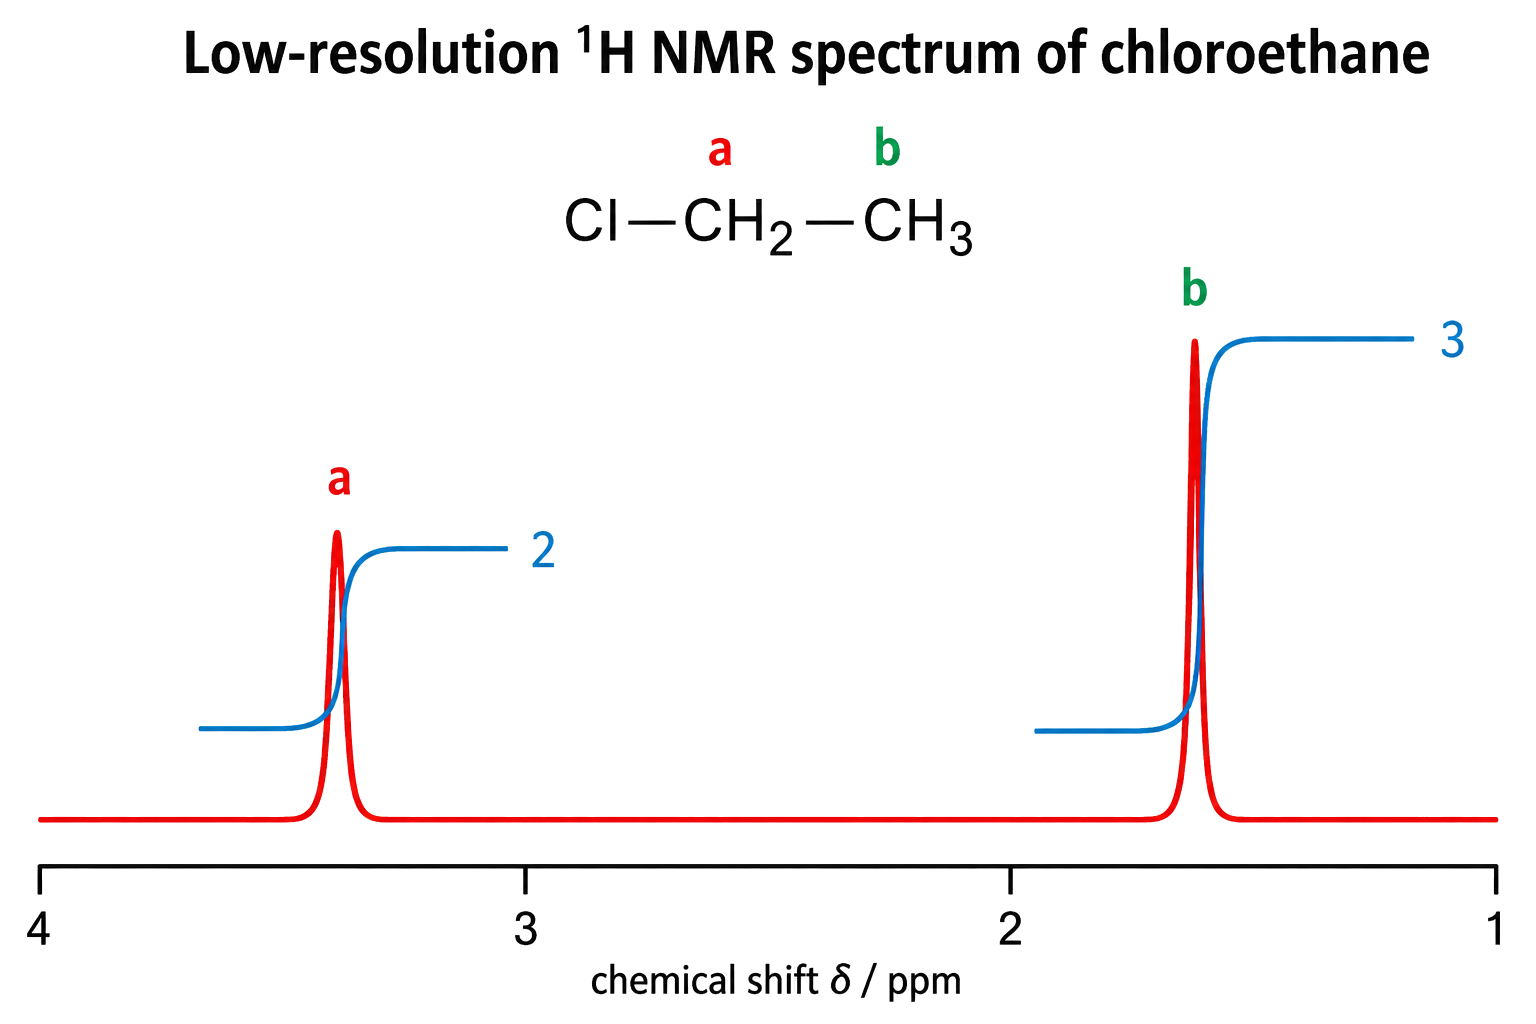
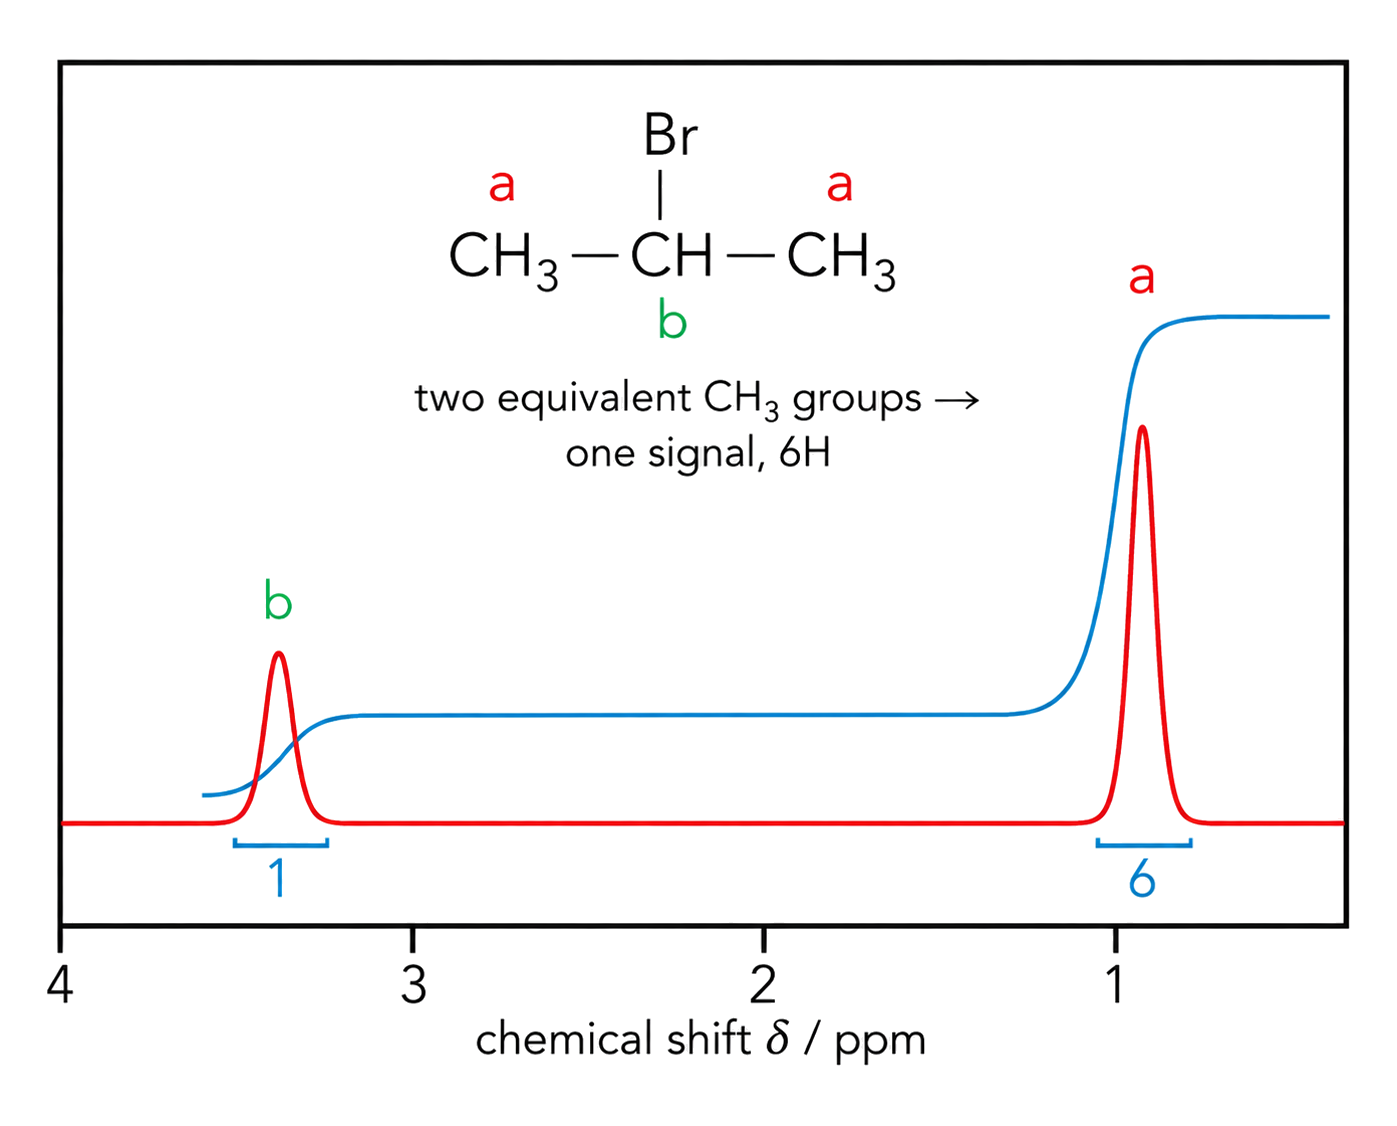
Use all three features together to constrain the structure; do not infer the whole molecule from one signal alone.
Ethanol gives three proton environments with an expected integration ratio 3:2:1 for CH₃, CH₂ and OH, though the OH shift can vary. Normalize integrations to a whole-number ratio and match shifts to environments before assembling fragments; signal count alone is insufficient.
Protons share one signal only when they are chemically equivalent in the molecular environment; use symmetry or a substitution test rather than visual closeness. Integration gives relative signal area, so normalize ratios rather than treating raw values as absolute proton counts. Chemical-shift ranges can overlap, so use shift together with integration, signal count and structure.
| Pattern | Typical neighbouring-hydrogen clue |
|---|---|
| Singlet | No equivalent neighbouring H in the coupling relationship |
| Doublet | One neighbouring H |
| Triplet | Two neighbouring H |
| Quartet | Three neighbouring H |
Identify the relevant neighbouring proton set, predict n + 1, then compare with the actual pattern and cross-check shift/integration. Treat n + 1 as the introductory local rule: exchangeable protons may not show expected coupling, non-equivalent neighbour sets can give more complex patterns, and overlapping peaks can hide multiplicity. Do not force such evidence into a simple singlet/doublet/triplet/quartet label.
An ethyl fragment commonly gives a three-H triplet next to CH₂ and a two-H quartet next to CH₃. Apply the n + 1 pattern only to relevant neighbouring, non-equivalent hydrogens, then confirm the assignment with integration and chemical shift.
| Evidence | Constraint or question |
|---|---|
| Molecular formula | atom totals and degree of unsaturation/rings-plus-π-bonds |
| Molecular ion | relative molecular mass consistent with the formula |
| MS fragments | which candidate substructures can produce the supplied m/z ions? |
| IR | which functional groups are required or excluded? |
| ¹H NMR | do signal count, shift, integration and splitting all fit? |
| Final candidate | does one connectivity satisfy every constraint, and what ambiguity remains? |
Write the specific peak, range, ratio or fragment beside each inference; “the spectrum looks like it” is not evidence.
![molecular ion m/z 58 constrains Mr to 58; m/z 43 is assigned to [CH3CO]+; IR absorption near 1715 cm-1 identifies C=O and no broad O-H is shown; one 6H singlet near 2.1 ppm represents two equivalent methyl groups next to carbonyl carbon.](https://cheese-dev-public.oss-accelerate.aliyuncs.com/interactive-content/images/chemistry/ib-knowledge-cards/v1/batch-029/combined-spectra-propanone-workflow-v1.png)
Use each technique as an independent constraint, then reject any candidate that contradicts one of the supplied data sets.
Use an elimination workflow: molecular mass and formula limit atom totals, IR requires or excludes functional groups, and NMR fixes hydrogen environments and neighbours. Write each constraint beside a candidate and reject it immediately when one spectrum conflicts; agreement with a single striking peak is not enough.