EduNinja

IGCSE Biology5.9B Fish farmingTopic Practice

5.9B Fish farming

Understand the methods used to farm large numbers of fish to provide a source of protein, including maintaining water quality, controlling intraspecific and interspecific predation, controlling disease, removing waste products, controlling the quality and frequency of feeding, and selective breeding.

Question 1

[Maximum number: 11]

Read the passage below. Use the information in the passage and your own knowledge to answer the questions that follow.

Offshore or freshwater fish farming

Fish farming in fresh water and in the sea offers the potential to increase the amount of fish harvested whilst protecting wild fish stocks. Offshore or fish farming at sea has less risk of serious injury or death to people than catching fish by deep sea fishing.

Some scientists predict that smart fish farming at sea could increase ocean fish production by an estimated 21 million tonnes from the 2020 value to 44 million tonnes by 2050 . Other estimates suggest that fish farming at sea, using an area the size of Lake Michigan, might produce the same amount of seafood as all of the world's wild-caught fisheries.

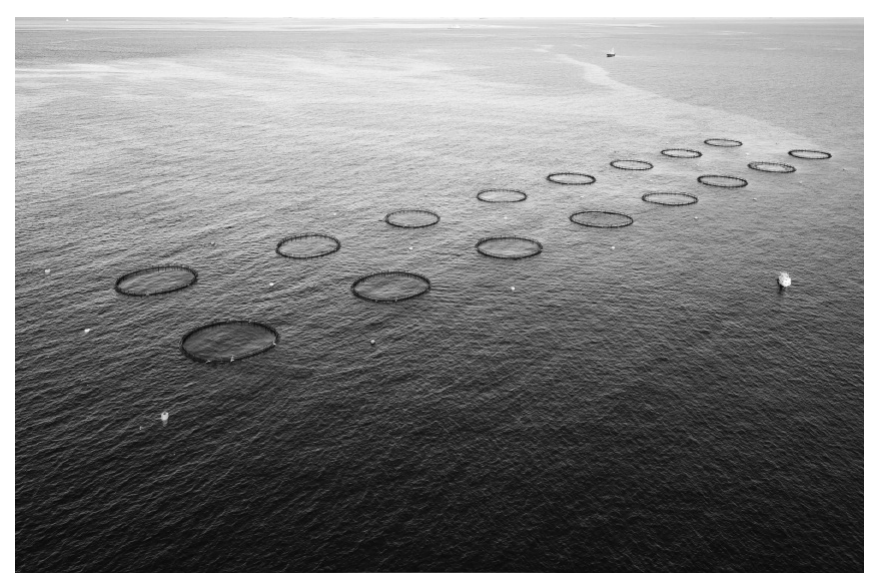
Fish farming at sea is done anywhere from three to 200 miles away from the coast. The fish produced are often Atlantic salmon, seabass and cobia. The aim is to reduce the environmental impact of fish farming near the coast by moving them further away from sensitive shorelines. This limits the impact of disease, pollution and pests such as sea lice. Further out to sea, and at deeper depths, the water movement is often faster.
Question image

Fish farm at sea

Question image

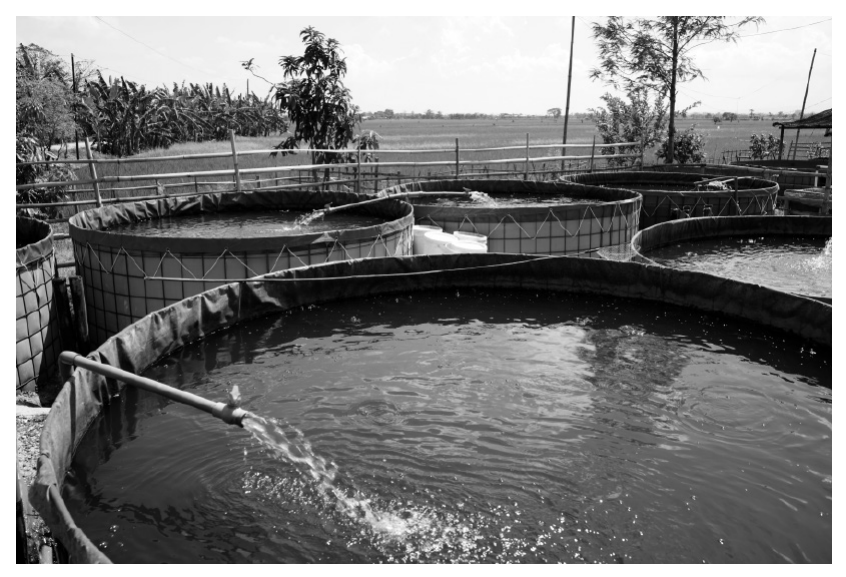
Freshwater fish farm

Critics of fish farming at sea claim that it will be more difficult to monitor and regulate any environmental impact and that pollution, disease and pests would still impact the surrounding waters. A major risk of farming at sea is the exposure to high winds and water speeds, increasing the risk of all the fish escaping. In 1997, 300000 farmed Atlantic salmon escaped into the Pacific Ocean. Wild fish are attracted to the farms by the scent of fish food. These wild fish are at risk of being hit by ships travelling to and from the large fish farms.

In contrast, other scientists support the development of fish farming in fresh water. Freshwater fish farms have increased in numbers steadily in the past 30 years. Asia is the main part of the world where this has happened. It is relatively cheap and easy to grow freshwater fish in small ponds. Fish farming provides incomes for many family farms, workers and small businesses, as well as jobs.

The main species produced by freshwater farming are carp, tilapia and catfish. These fish are herbivores or omnivores. In the farms they are fed small amounts of fish to

speed up growth, but their main diet is the by-products of crops like rice, groundnut and soy. Farmed freshwater fish are an affordable food for millions of low- and middle-income consumers.

Question 1(c)

(a)

Explain how fish farms cause pollution. (lines 12 to 16)

[ 3 ]

Question 1(d)

(b)

Fish farmers use methods to control disease in their fish farms.

[ 4 ]

Question 1(d)(i)

(i)

Describe the methods a fish farmer could use to reduce the incidence of disease in a fish farm.

[ 2 ]

Question 1(d)(ii)

(ii)

Explain how these methods may affect the local ecosystem.

[ 2 ]

Question 1(e)

(c)

Explain why locating the fish farms further out to sea may help reduce the effects on the local ecosystem. (lines 12 to 16)

[ 2 ]

Question 1(f)

(d)

Suggest why fish farming further out at sea will be more difficult to monitor and regulate. (lines 14 to 16)

[ 1 ]

Question 1(g)

(e)

Give a reason why farming fish that are herbivores is an advantage for the fish farmer. (lines 27 and 28)
[ 1 ]

Question 4

[Maximum number: 7]

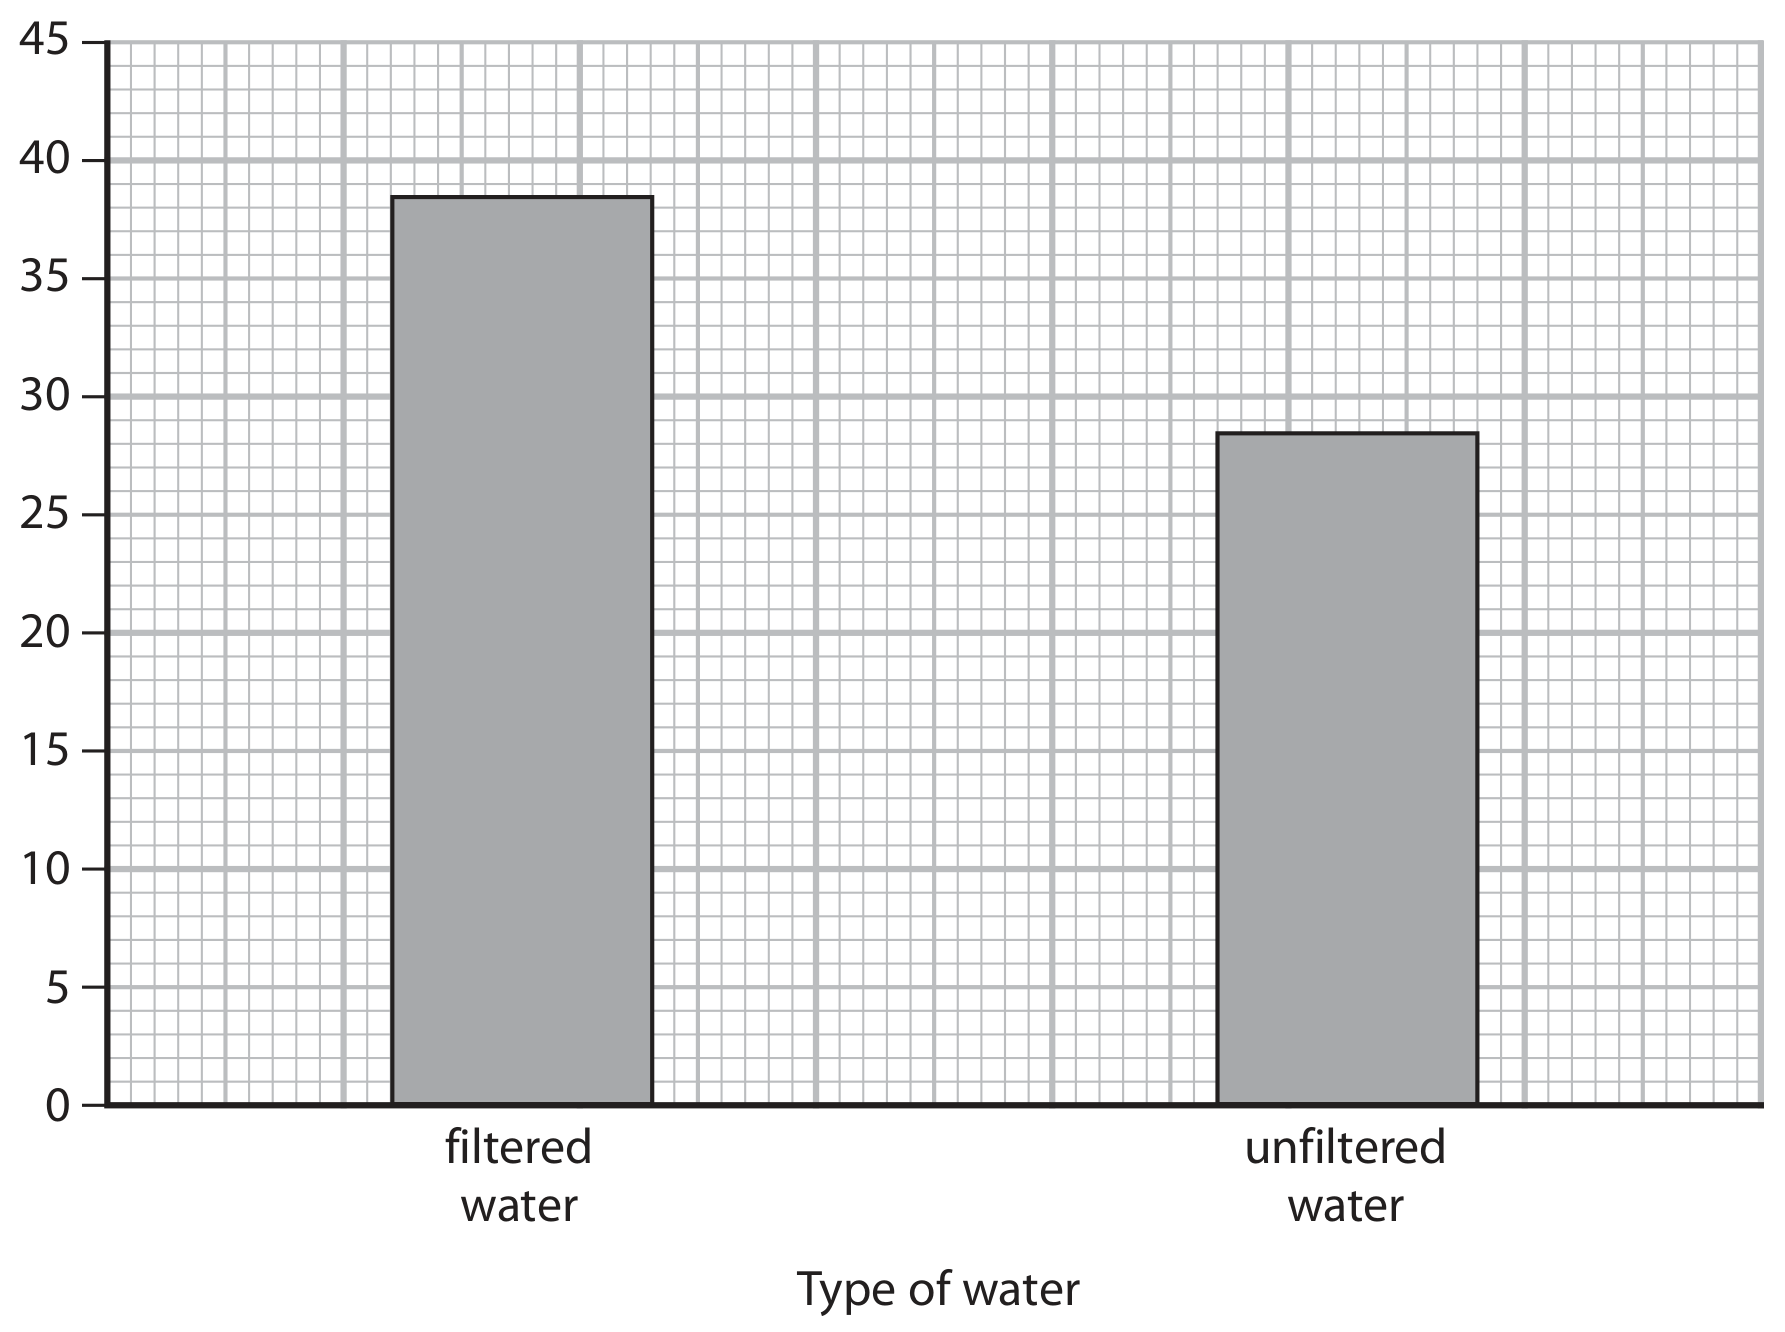
A scientist uses this method to investigate the effect of water quality on the growth of fish.
- fill a pond with filtered water
- fill another pond with unfiltered water
- place the same mass of fish of the same species in each pond
- determine the increase in total mass of fish in each pond after 180 days

The graph shows the scientist's results.

Increase in total mass of fish in kg

Question image

Question 4(a)

(a)

The mean rate of increase in total mass of the fish in the filtered water is 0.214 kg per day.

Calculate the difference between the mean rate of increase in the total mass of the fish in filtered and unfiltered water.
difference in mean rate = kg per day

[ 3 ]

Question 4(b)

(b)

Unfiltered water contains more bacteria.

Explain why unfiltered water containing more bacteria affects the growth of fish.

[ 3 ]

Question 4(d)

(c)

Give a method the scientist could use to control interspecific predation in the ponds.

[ 1 ]

Question 4(c)

[Maximum number: 5]

Fish farming is often used to produce protein rich food.

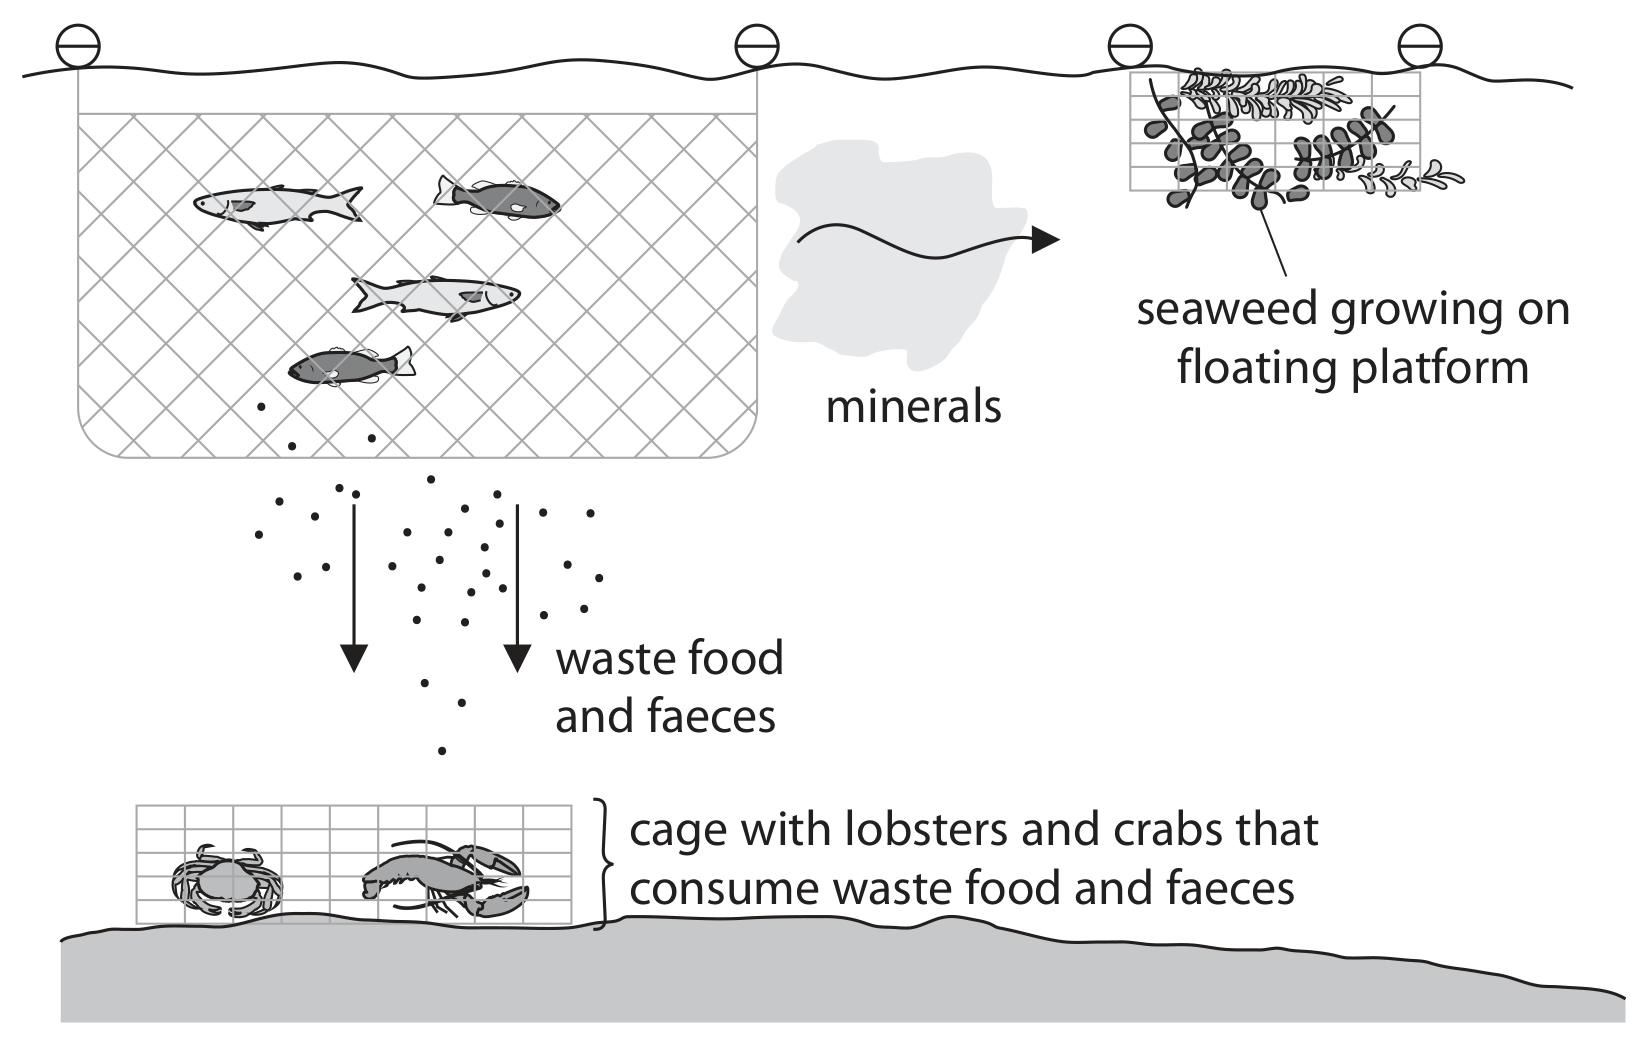
Multi-trophic level aquaculture is a method of fish farming that has been developed to reduce environmental pollution and increase profits.

The diagram shows a multi-trophic level aquaculture system.

Question image

Explain how the multi-trophic level aquaculture system reduces environmental pollution, and increases the profits of fish farming.

Use information from the diagram and your own knowledge to support your answer.

Question 5

[Maximum number: 10]

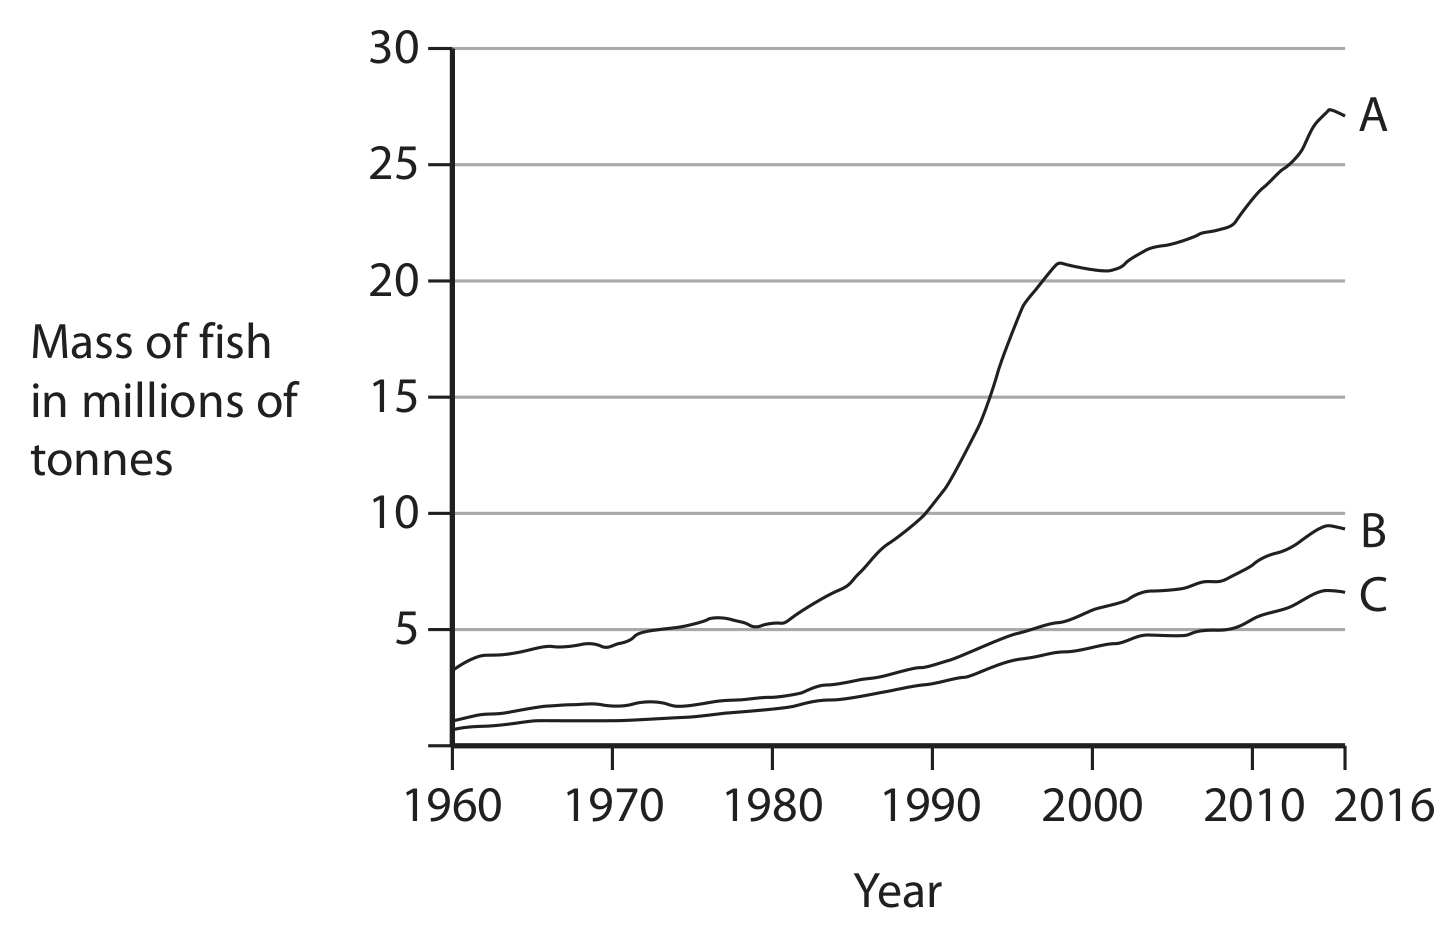
Graph 1 shows the mass of fish caught by traditional fishing in tonnes from 1960 to 2016 in three countries.

Graph 1

Graph 1

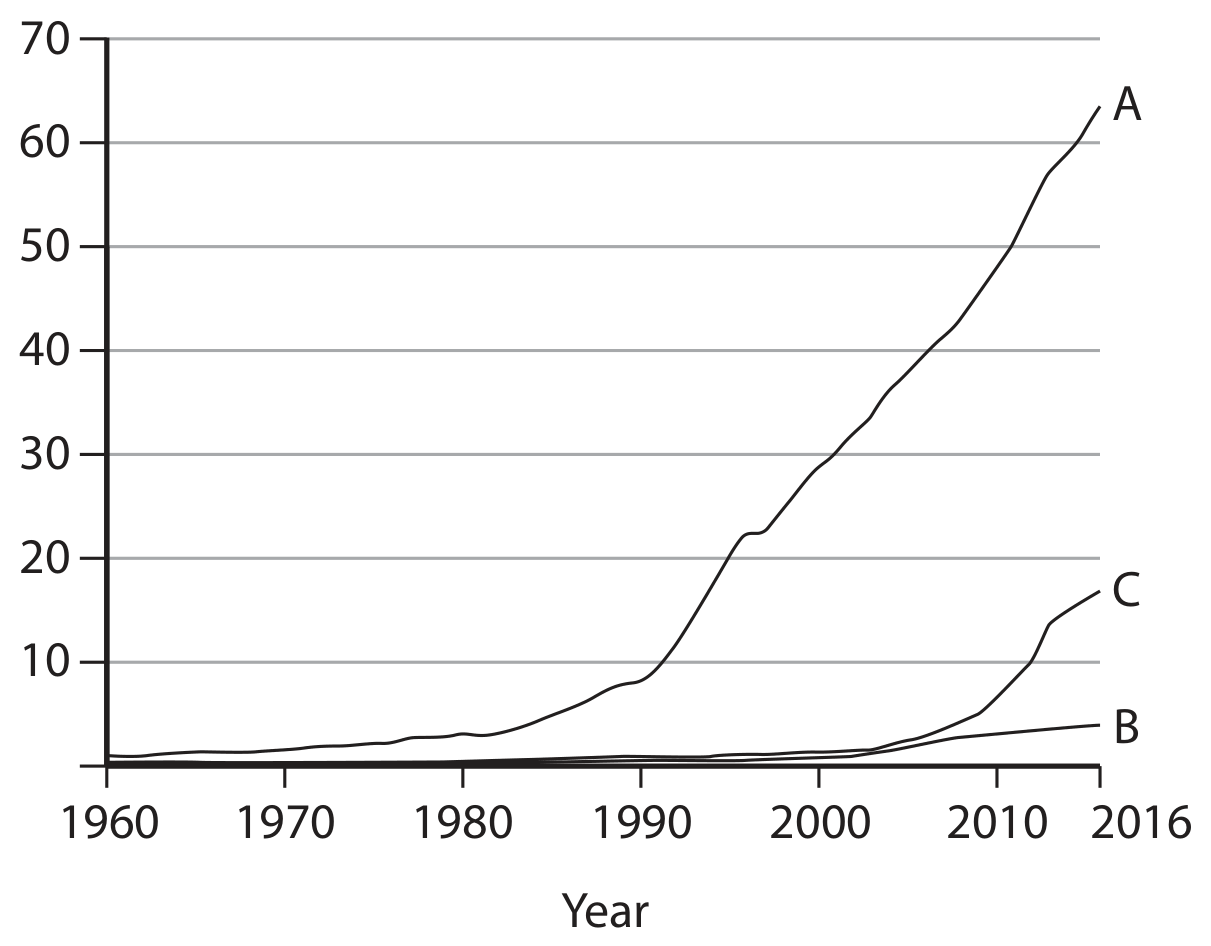
Graph 2 shows the mass of fish produced by fish farming from 1960 to 2016 in the same three countries.

Mass of fish in millions of tonnes

Graph 2

Graph 2

Question 5(a)

(a)

Comment on the changes in the mass of fish caught by traditional fishing and the mass of fish produced by fish farming from 1960 to 2016.

Use information from the graphs to support your answer.

[ 5 ]

Question 5(b)

(b)

Explain the methods a fish farmer can use to maximise production of fish.

[ 5 ]

Question 6

[Maximum number: 7]

The photograph shows a fish called tilapia. This type of fish is often grown in fish farms.

Question 6(b)

(a)

Scientists have produced genetically modified (GM) tilapia that grow faster.

Scientists investigate the growth of these GM tilapia compared with non-genetically modified (non-GM) tilapia.

This is the scientists' method.
- set up two equally sized tanks containing water
- put non-GM tilapia into one tank
- put an equal mass of GM tilapia into the second tank
- feed the fish in each tank the same mass of protein pellets

The mass of each type of fish was measured at the start of the investigation and after seven months.

A measure called the feed conversion index was also calculated for each type of fish.

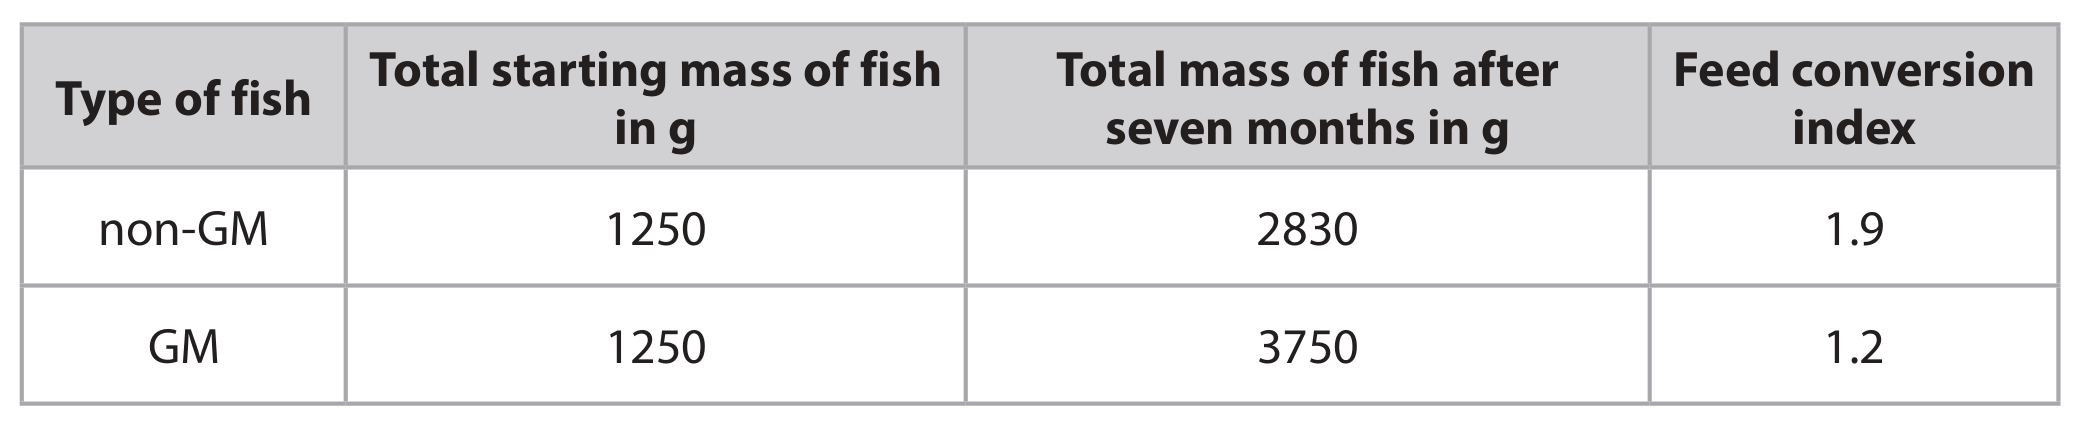
The table shows the scientists' results.

Table
[ 7 ]

Question 6(b)(ii)

(i)

The feed conversion index is a measure of the mass of protein pellets used compared with the increase in mass of tilapia.

It is calculated using this formula.

 feed conversion index = total mass of protein pellets used  increase in mass of tilapia \text { feed conversion index }=\frac{\text { total mass of protein pellets used }}{\text { increase in mass of tilapia }}

Use the information in the table to calculate the mass of protein pellets given to the non-GM tilapia.

[ 1 ]

Question 6(b)(iv)

(ii)

Both groups of fish were fed the same mass of pellets and placed into the same sized tanks of water.

Give one other abiotic factor that the scientists should keep constant.

[ 1 ]

Question 6(b)(v)

(iii)

The scientists conclude that farming GM tilapia is better for the environment than farming non-GM tilapia. This is because the GM tilapia would result in less nitrate in the water and cause less spread of disease.

Evaluate this conclusion.
Use the information in the table and your own knowledge in your answer.

[ 5 ]

Question 7

[Maximum number: 12]

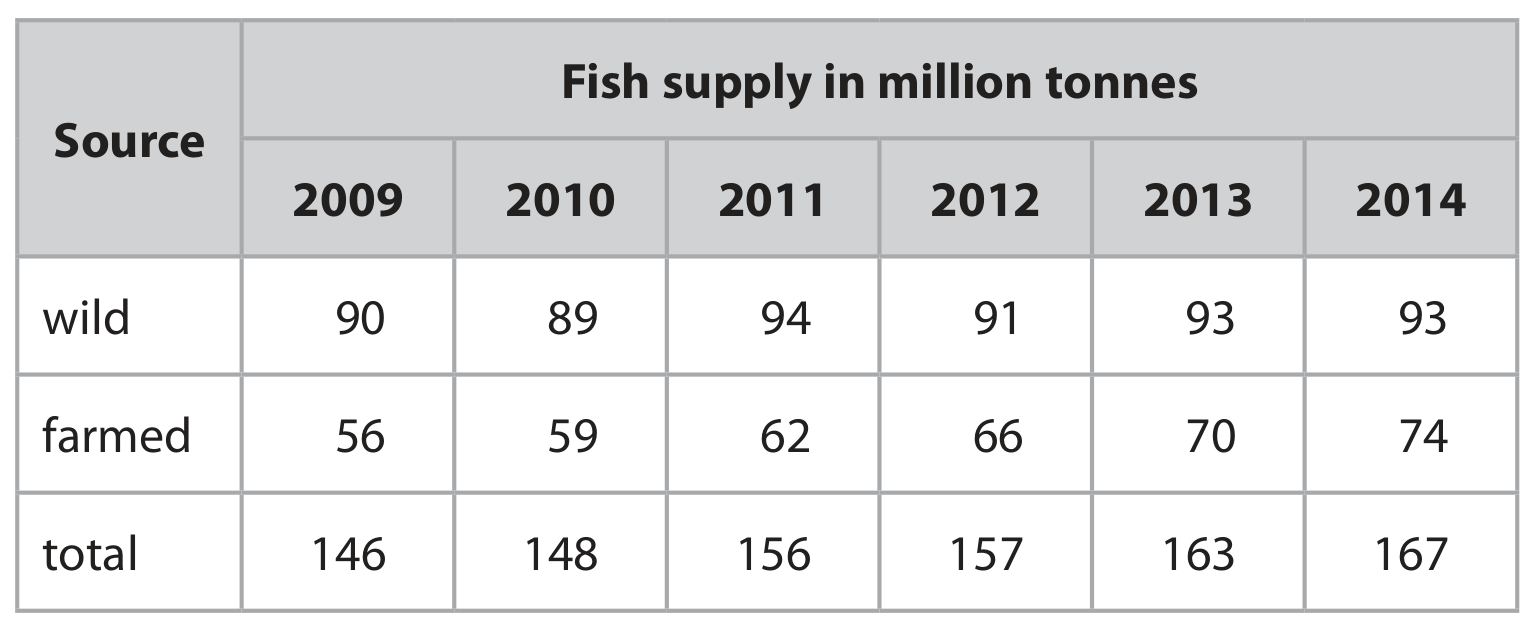
The table shows information about world fish supply from 2009 to 2014.

Table

Question 7(a)(i)

(a)

Calculate the difference between the percentage of total fish production that is farmed in 2009 and the percentage of total fish production that is farmed in 2014.
difference =

[ 3 ]

Question 7(a)(ii)

(b)

Describe the changes in fish supply from 2009 to 2014.

[ 3 ]

Question 7(b)

(c)

Farming large numbers of fish can cause problems for fish farmers.

Discuss how fish farmers solve these problems.

[ 6 ]
0 selected