
Question 3(b)(ii)
[Maximum number: 2]
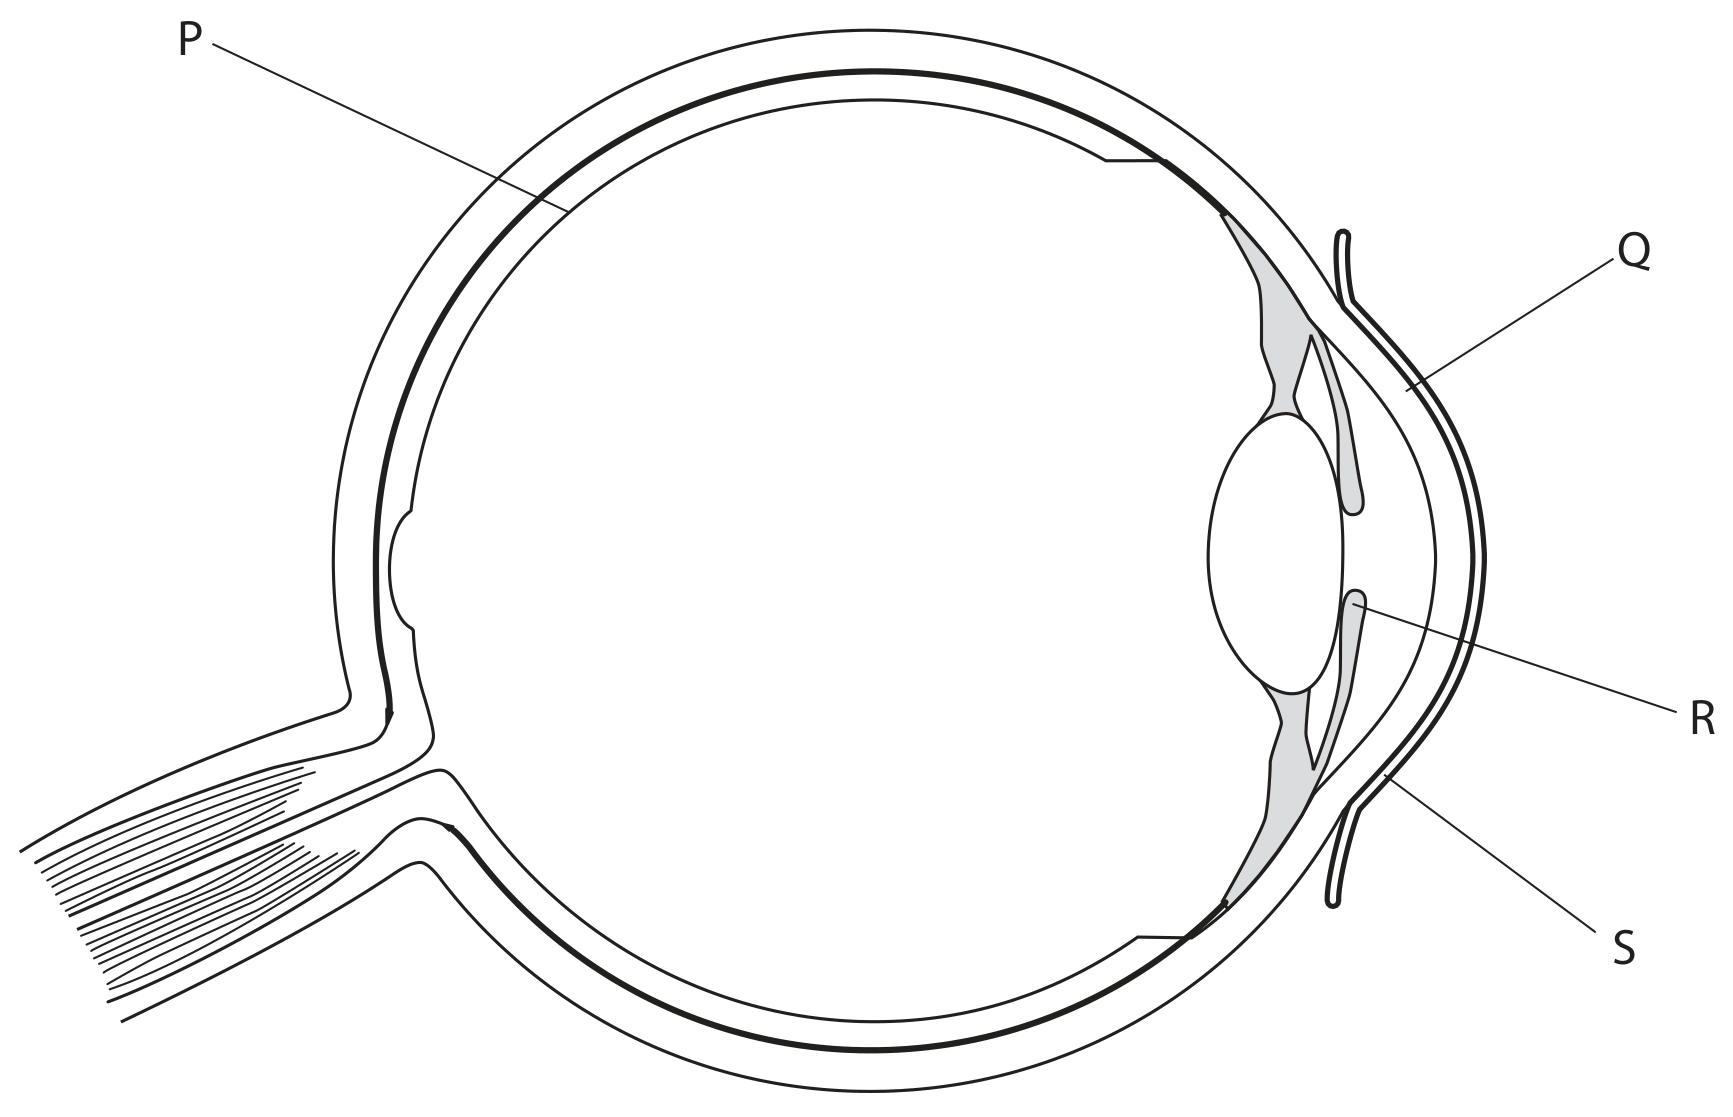
The diagram shows a human eye with some structures labelled.
A teacher investigates the effect of light intensity on pupil diameter.
This is the teacher's method.
- cover a student's eyes with a mask
- set the light intensity in the room to a low level
- remove the mask and wait 20 seconds
- record an image of the student's pupil and iris with a camera
- measure the diameter of the pupil on the image using a ruler
- repeat two more times at the same light intensity
The teacher repeats the experiment at different light intensities.
The table shows the teacher's results.
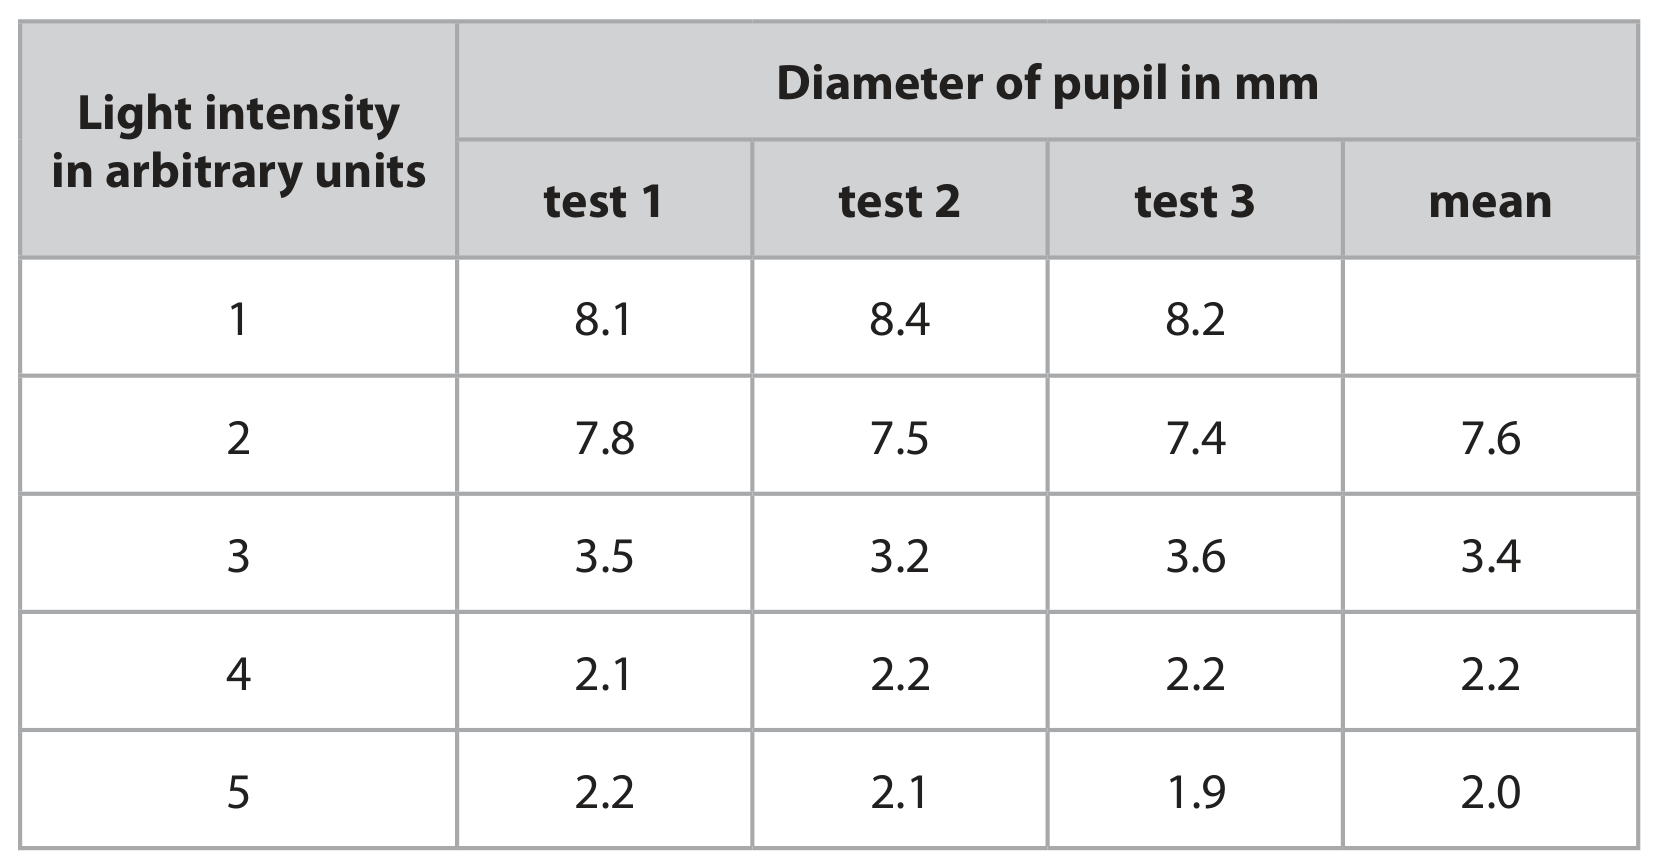
With reference to data in the table, describe the effect of increasing light intensity on the diameter of the pupil.