

Question 3(b)(iii)
[Maximum number: 4]
Diagram 1 shows the human urinary system with some structures labelled.
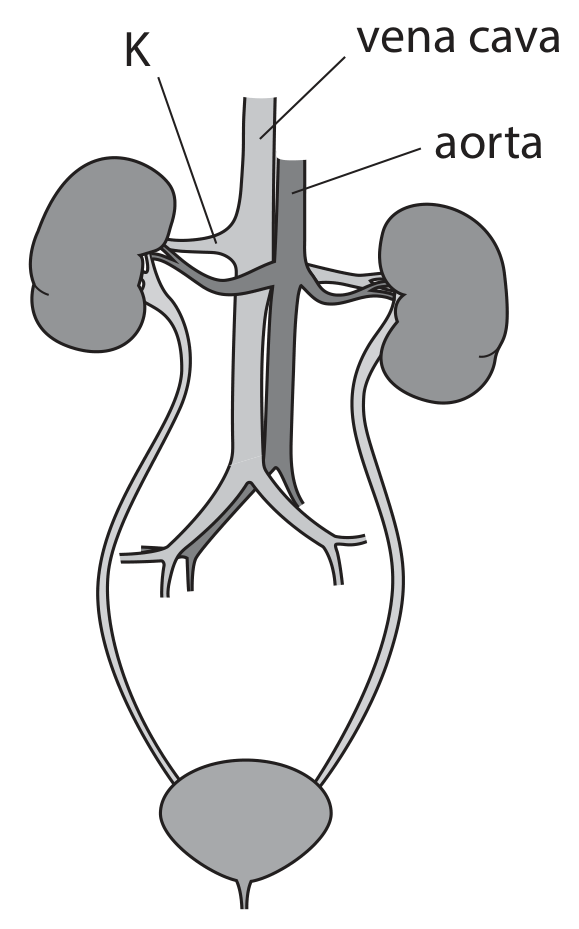
Diagram 1
Diagram 2 shows a nephron with some parts labelled.
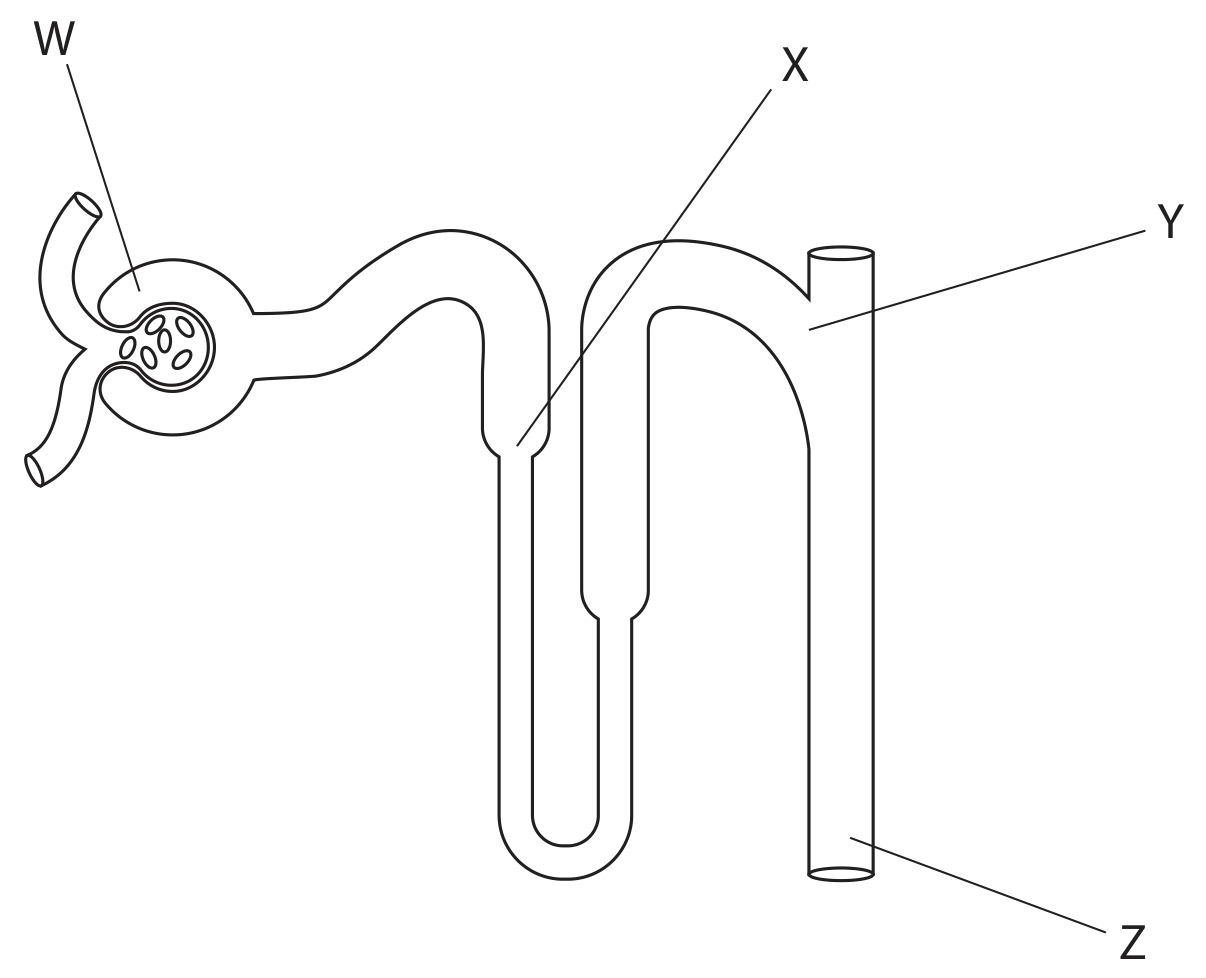
Diagram 2
The table gives the concentrations of glucose and urea in the filtrate at parts W, X, Y and Z .
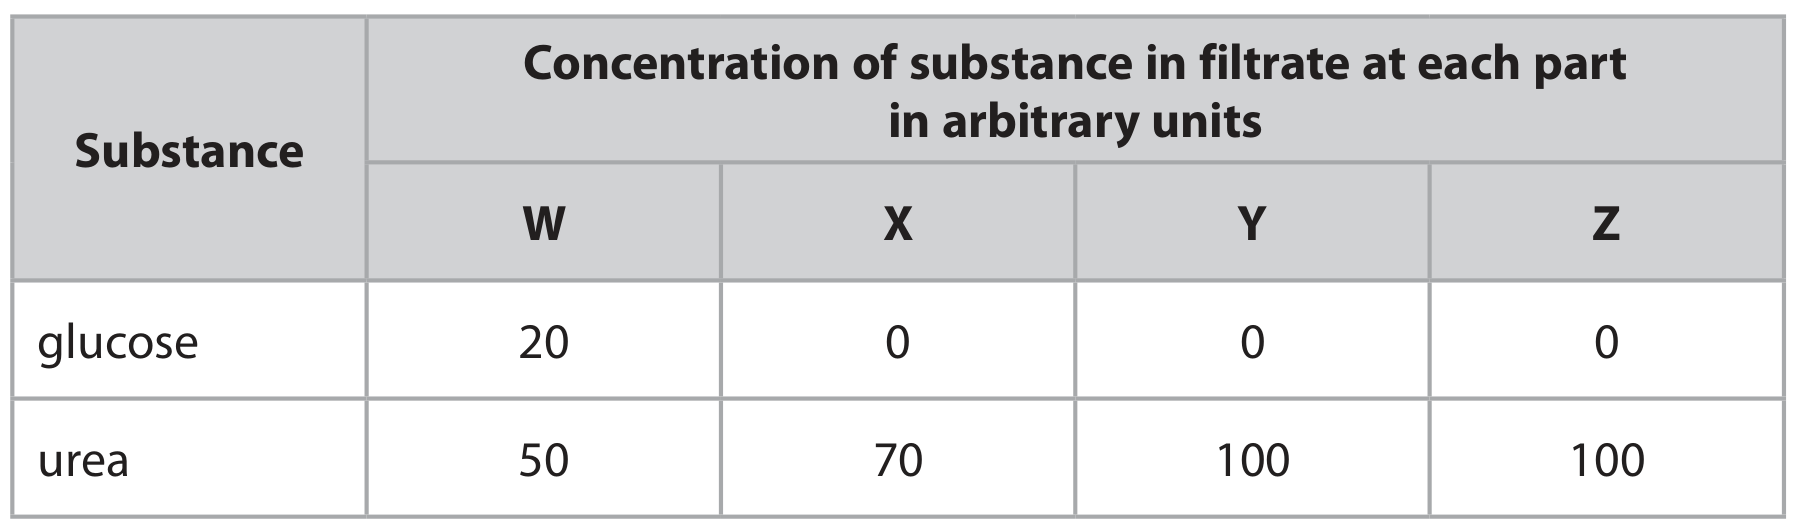
The concentrations in the table are for a person who has drunk water and is not dehydrated.
Explain why the concentration of urea at Z would be different for a person who is severely dehydrated.