Question 4(a)(iii)
[Maximum number: 2]
A boat sails from A to B.
The travel graph shows this journey.
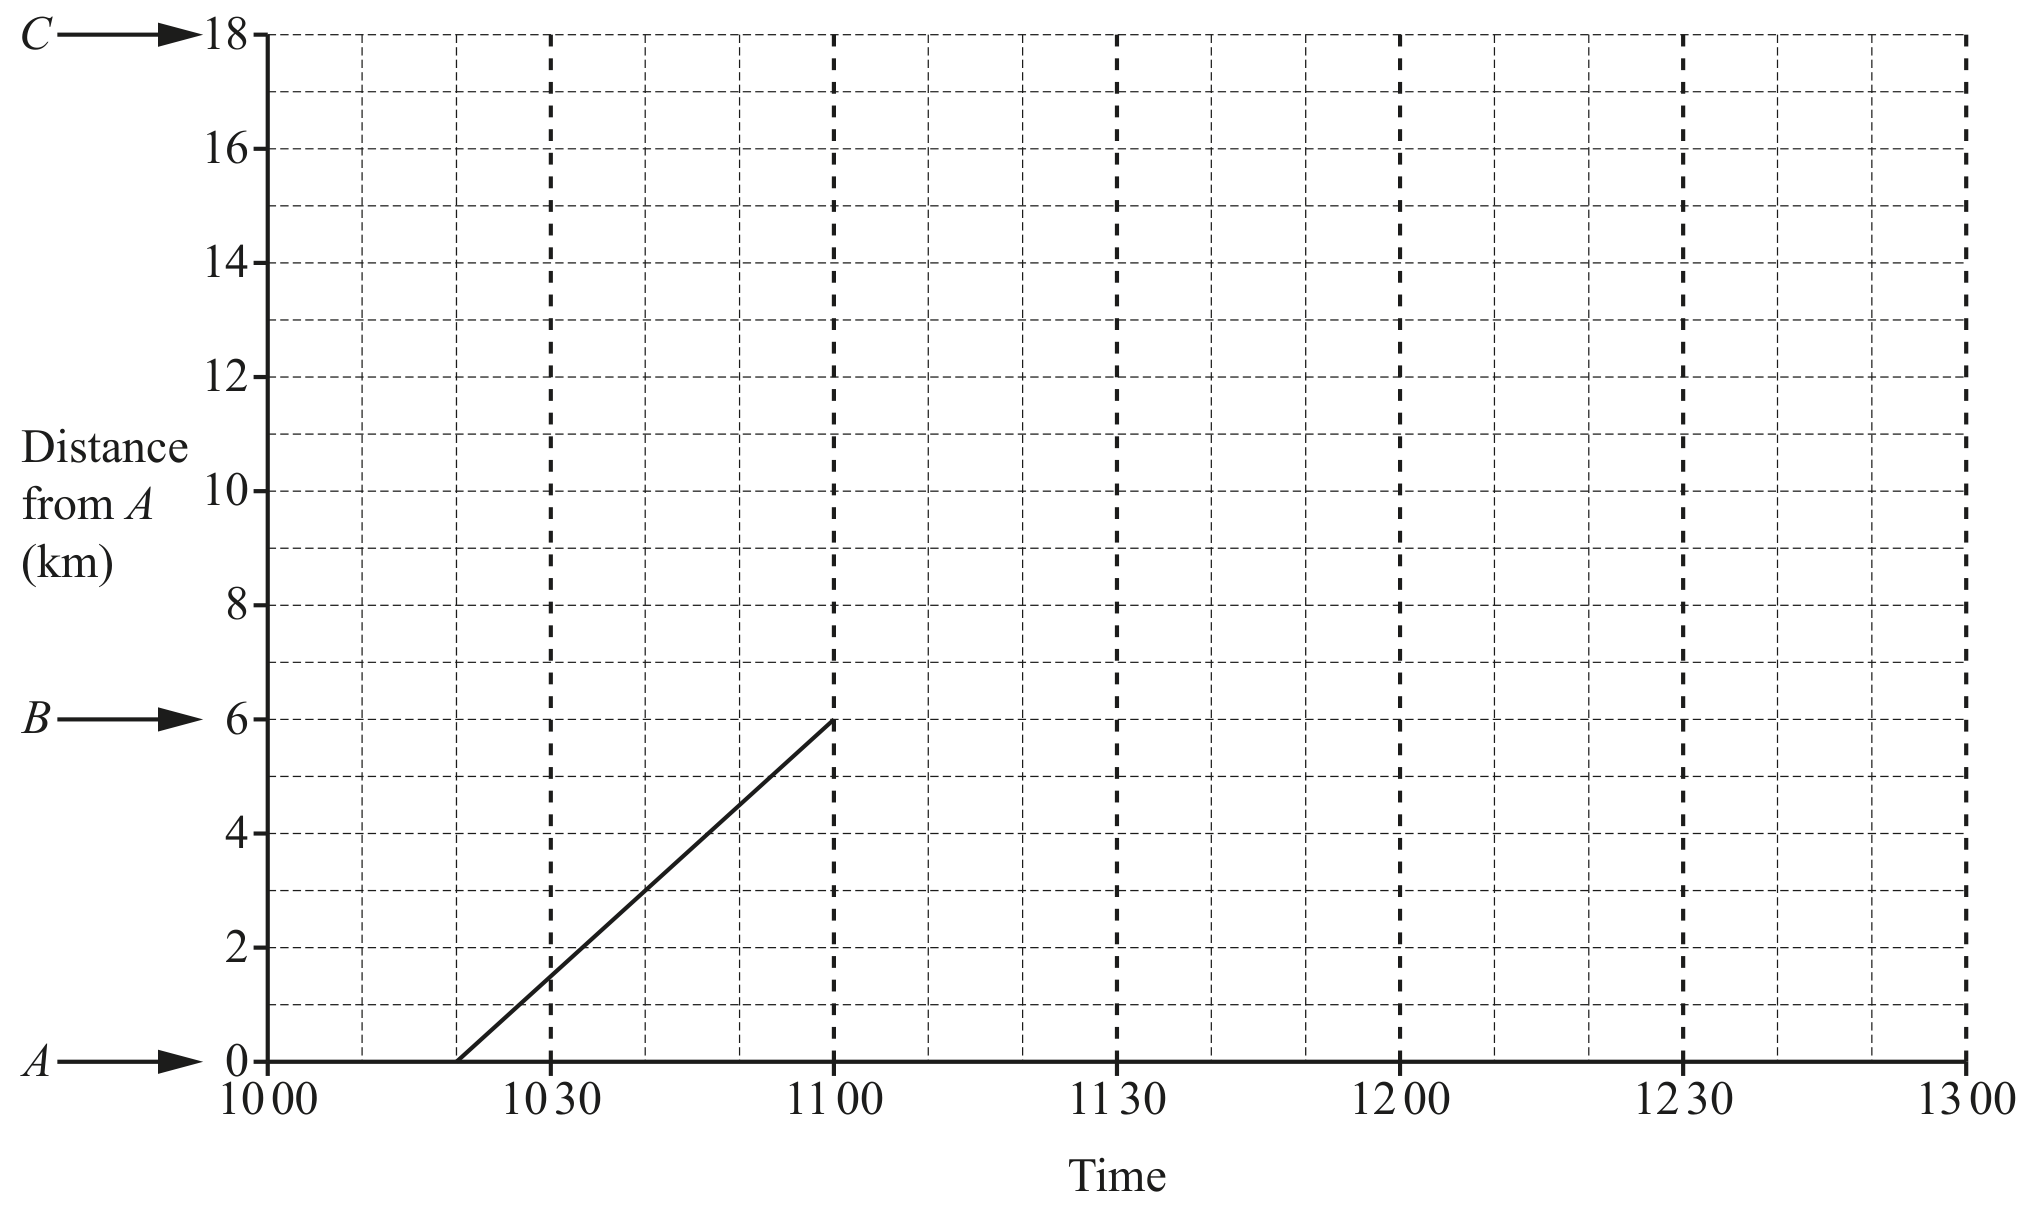
The boat stays at B for 20 minutes.
The boat then sails to C at a constant speed of .
Complete the travel graph.
 EduNinja
A boat sails from A to B.
The travel graph shows this journey.
The boat stays at B for 20 minutes.
The boat then sails to C at a constant speed of .
Complete the travel graph.