CAIE IGCSE Mathematics Core Graphs in Practical Situations
Practise reading and completing travel or cost graphs and using gradients, horizontal sections and intersections to explain real situations.
- Syllabus
- 2028–2030
- Topic
- C2.9
- Level
- Core
Practise reading and completing travel or cost graphs and using gradients, horizontal sections and intersections to explain real situations.
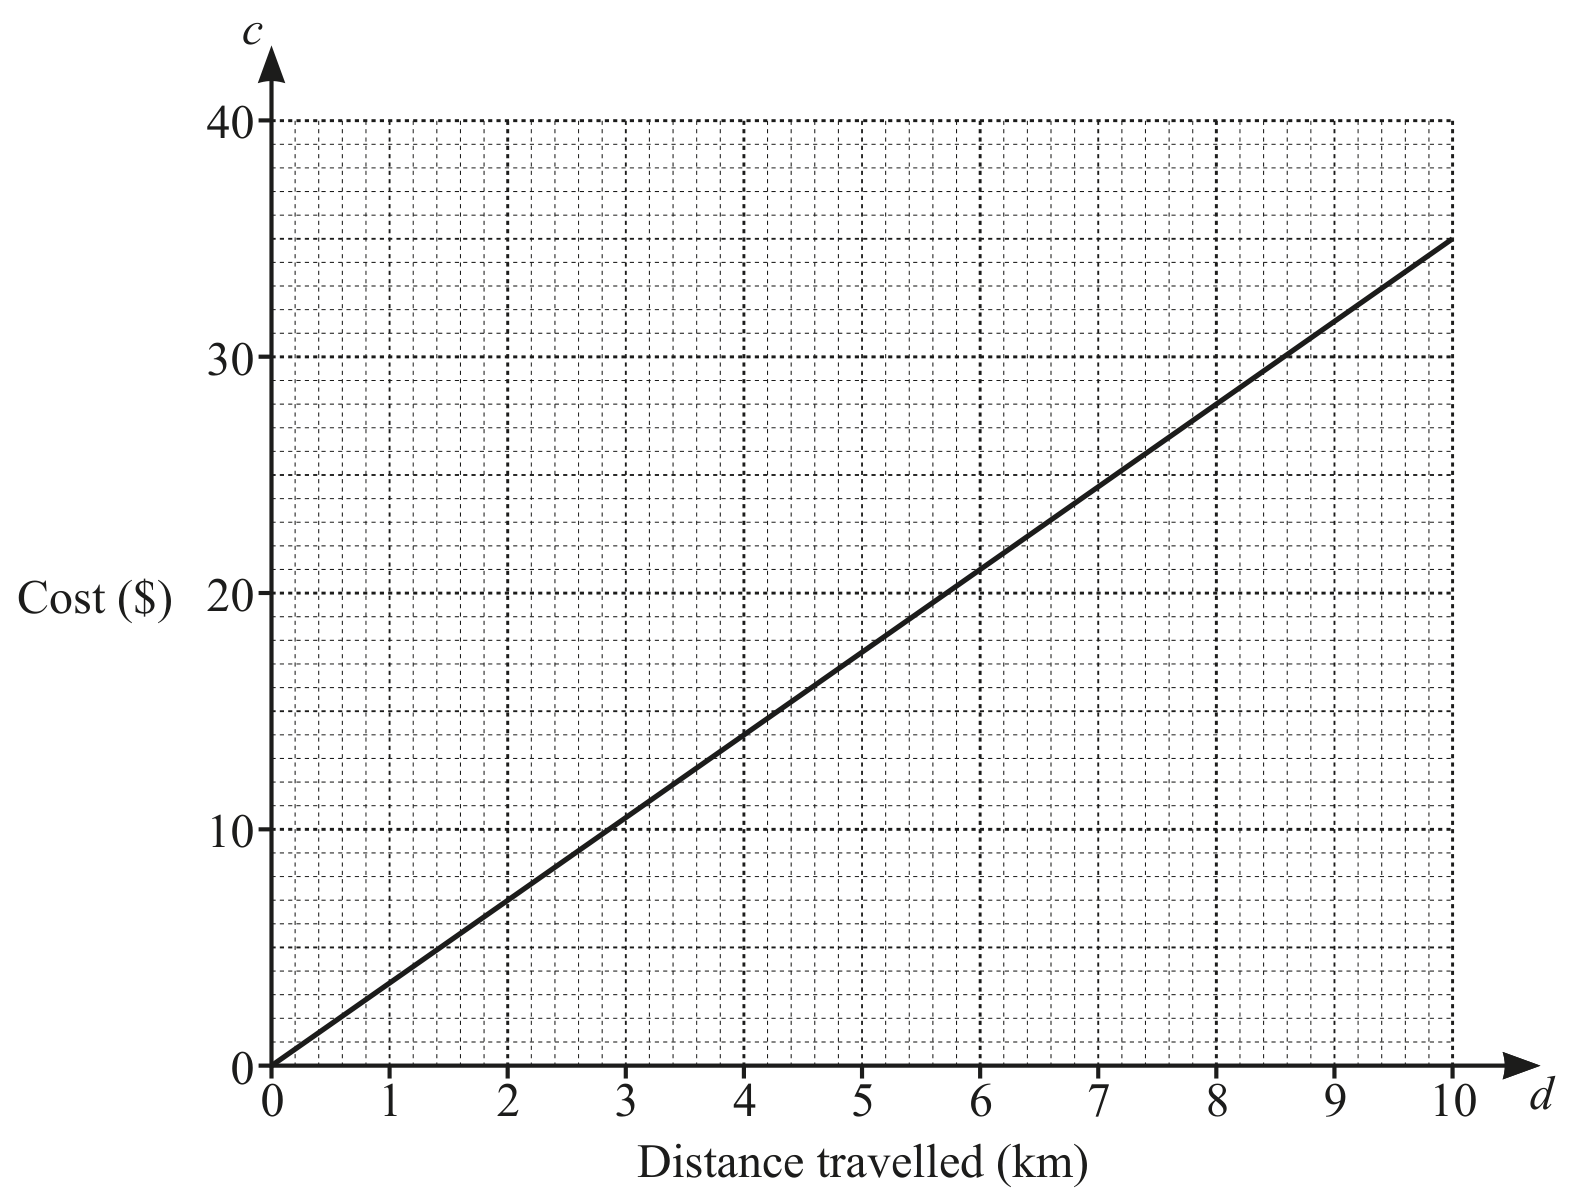
The graph shows the cost, $ c, of travelling a distance, , with Saanvi's Taxis.
Write down the cost of a 4 km journey.
$
Krishna's Taxis cost $ 5 to hire plus $ 2 for each kilometre travelled.
Mrs Singh wants to hire a taxi. She says that Saanvi's Taxis are always cheaper than Krishna's Taxis.
Is Mrs Singh correct?
Give a reason for your answer. Use your graph to help you. because
A boat sails from A to B.
The travel graph shows this journey.
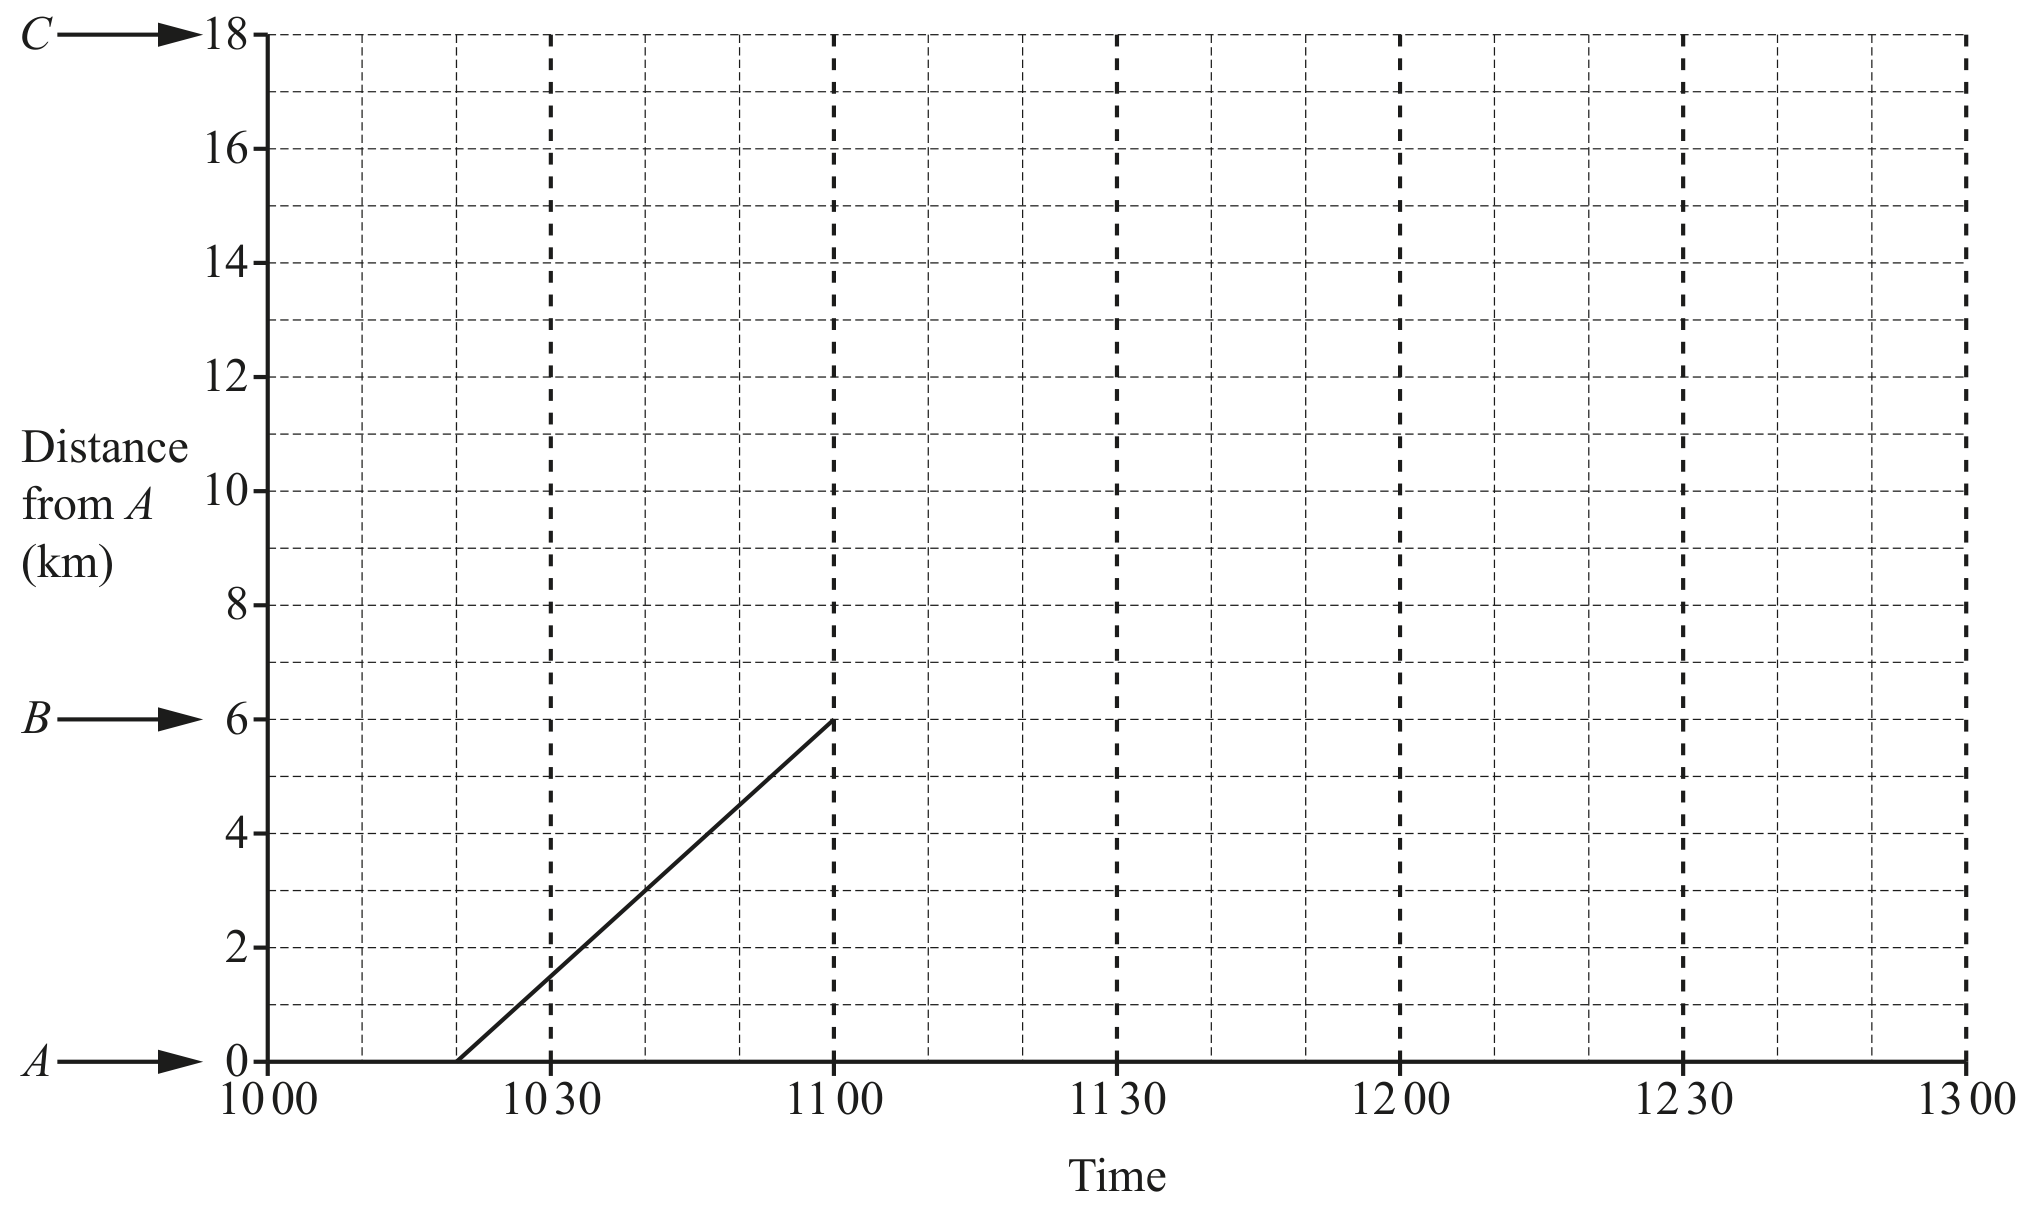
Write down the time that the boat leaves A.
The boat stays at B for 20 minutes.
The boat then sails to C at a constant speed of .
Complete the travel graph.