CAIE IGCSE Mathematics Core C9.5 Scatter diagrams Question Bank
Practise plotting scatter diagrams, judging correlation and using a ruled line of best fit to describe or estimate relationships.
- Syllabus
- 2028–2030
- Topic
- C9.5
- Level
- Core
Practise plotting scatter diagrams, judging correlation and using a ruled line of best fit to describe or estimate relationships.
Ten students eat cereal with milk for breakfast.
The amounts are shown in the table.

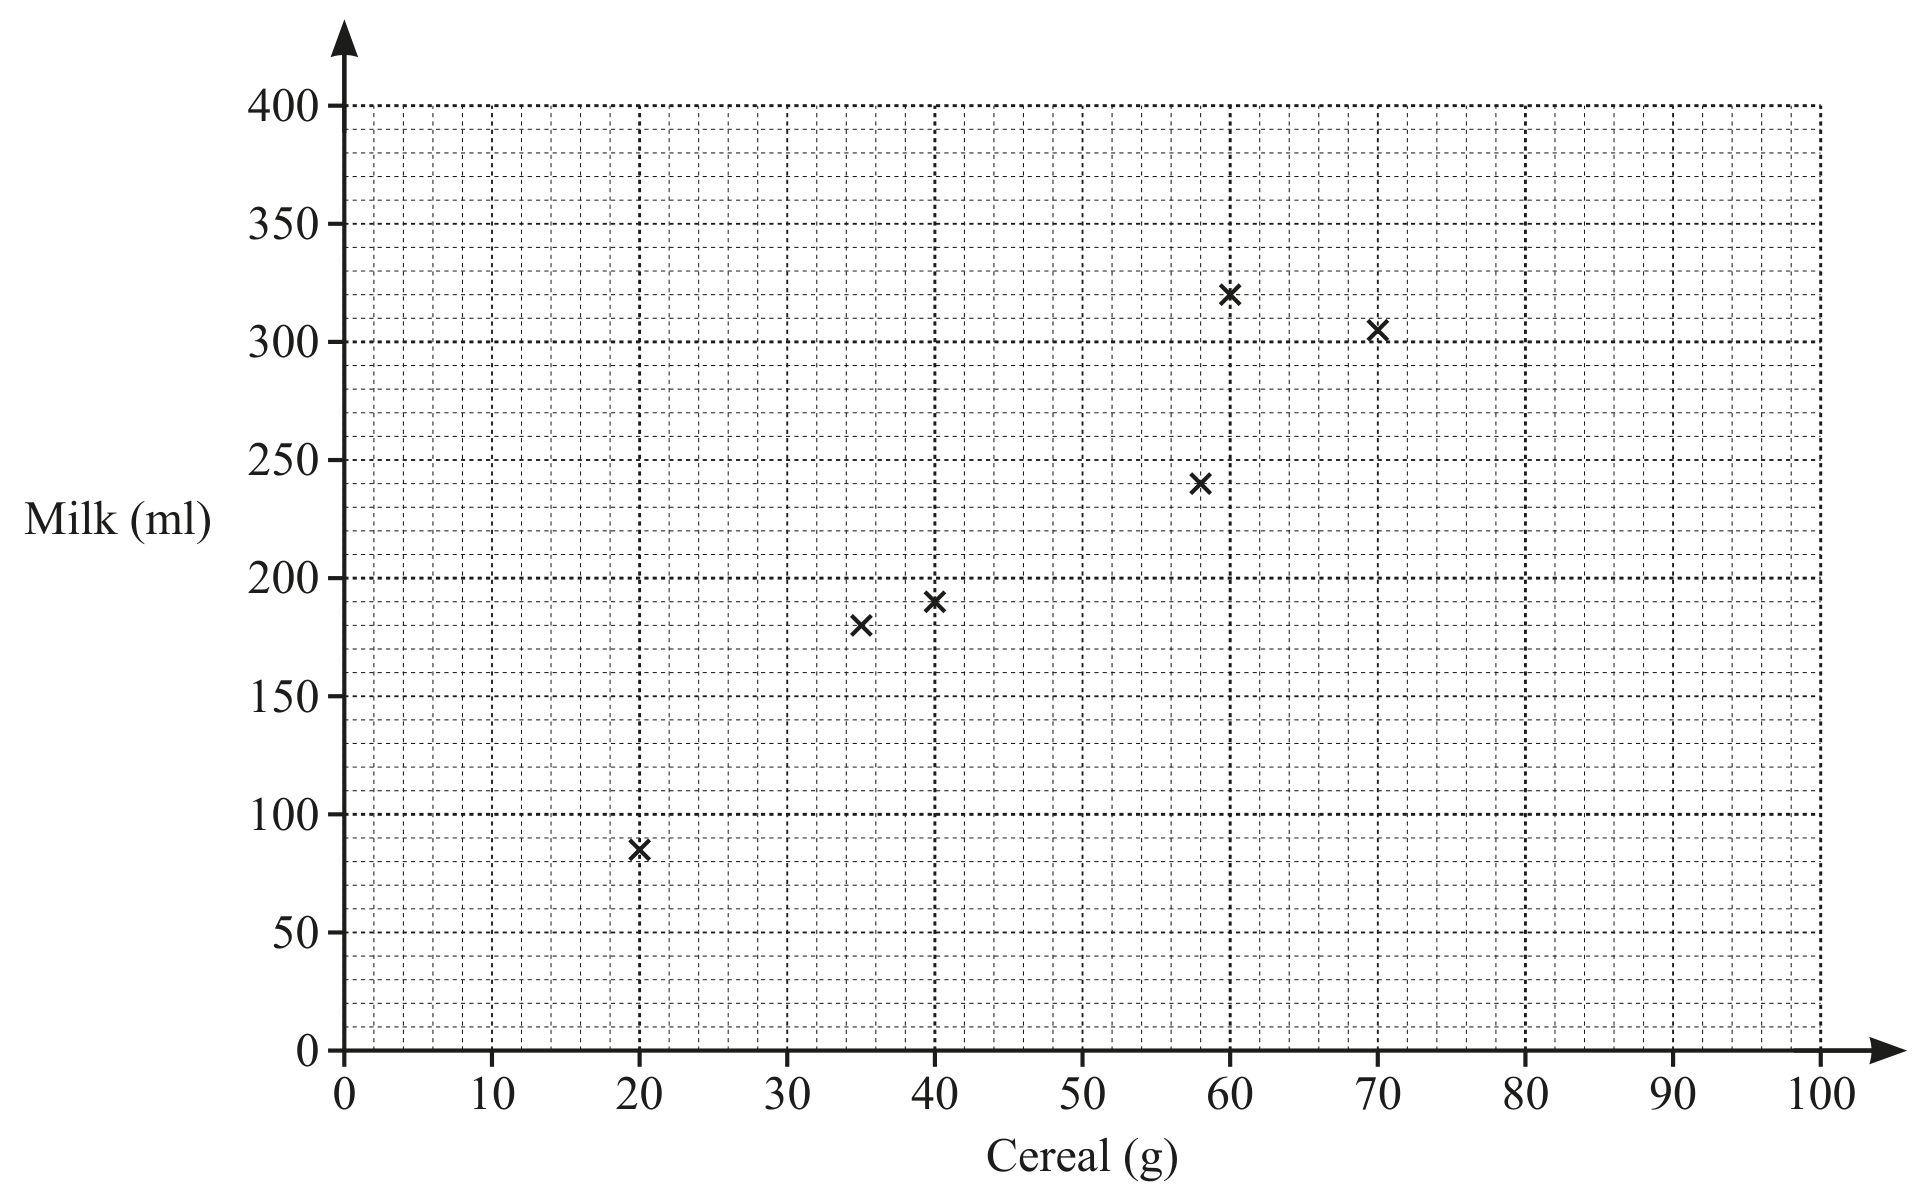
Complete the scatter diagram.
The first six points have been plotted for you.
For these students, describe the relationship between the amount of cereal and the amount of milk.
On the grid, draw a line of best fit.
Another student has 280 ml of milk with her cereal.
Use your line of best fit to estimate an amount of cereal this student has.
___ g
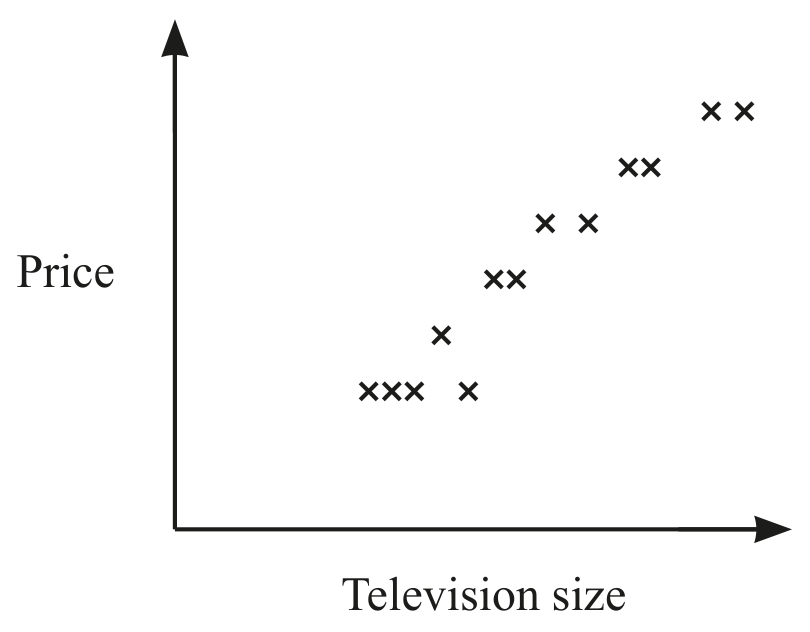
The scatter diagram shows the prices of different sized televisions.
Write down the type of correlation shown in the scatter diagram.