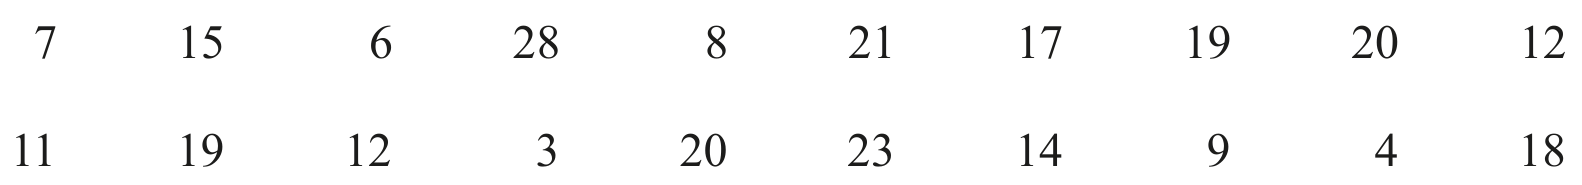
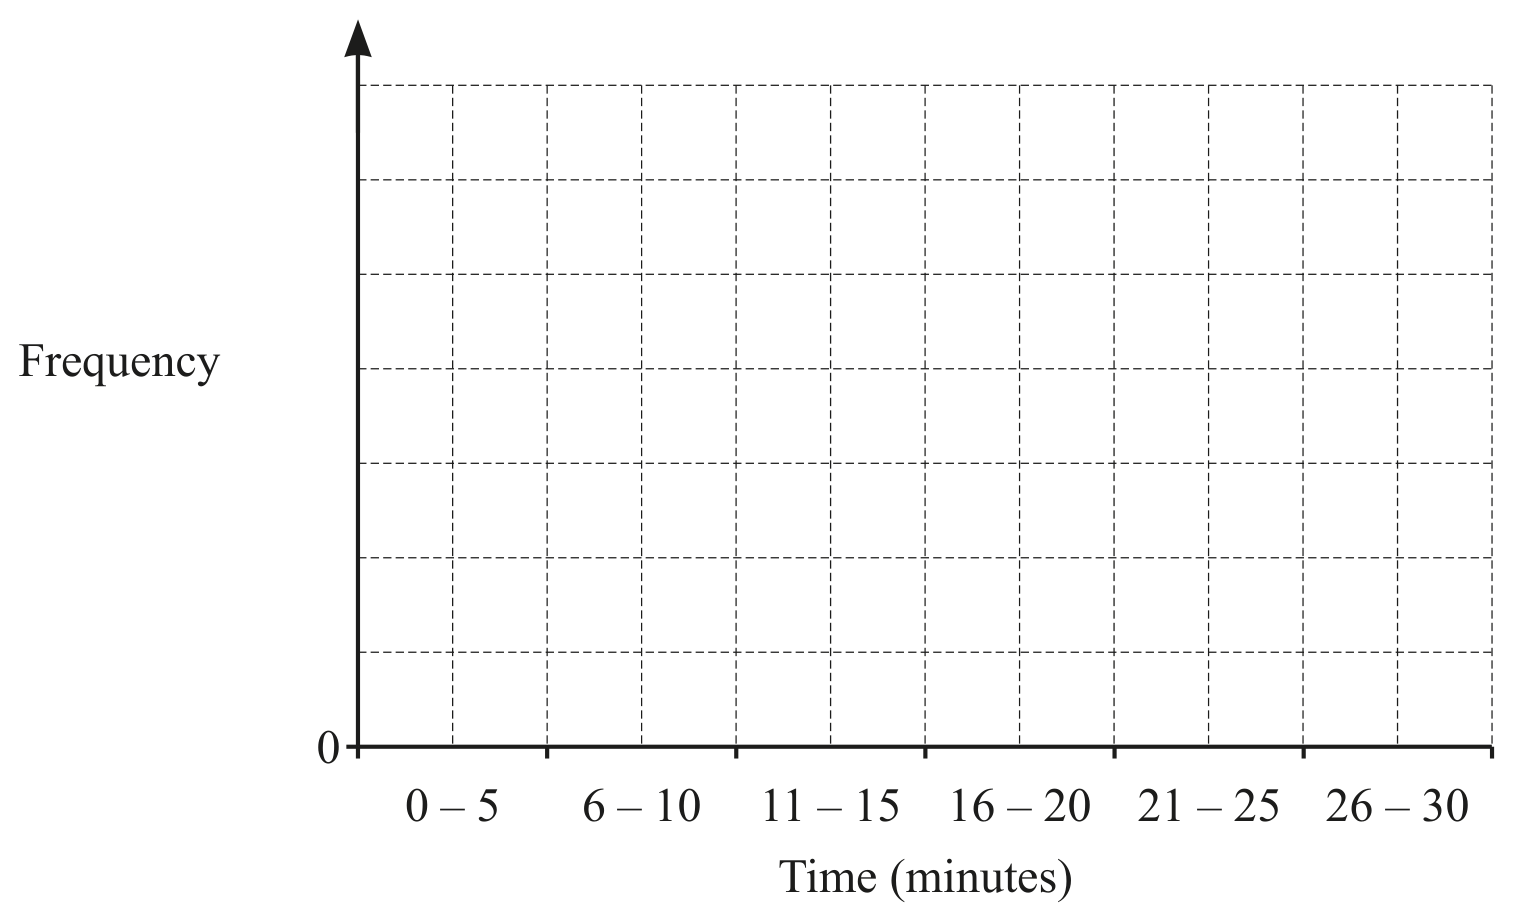
EduNinja
IGCSE | CAIE | Mathematics | Core
Q Bank
Question Bank
Learn
Notes
Notes
Docs
Documents
Premium
Q Bank
Question Bank
Learn
Notes
Notes
Docs
Documents
IGCSE Mathematics Core
C9.4 Statistical charts and diagrams
Question Bank
Knowledge point
C9.4 Statistical charts and diagrams
C9.4.1 Draw and interpret: (a) bar charts (b) pie charts (c) pictograms (d)
C9.4 Statistical charts and diagrams is locked
Log in to preview more questions from this node.
Log in
AI add
All types
All difficulty
0 selected
Open Builder