CAIE IGCSE Mathematics Core Function Graph Questions

Practise completing value tables, plotting smooth function curves and reading roots or intersections to solve equations graphically.

Syllabus
2028–2030
Topic
C2.10
Level
Core

Exam points

  • substitute each x-value accurately to complete a table before plotting ordered pairs
  • plot points at the stated scale and join them with the required smooth curve or straight line
  • solve an equation by reading x-coordinates at an axis, horizontal level or line intersection

C2.10 Graphs of functions question 1

[Maximum number: 8]

Question (a)

(a)

Complete the table of values for y=6xy=\frac{-6}{x}.

Table for Question (a) — CAIE IGCSE Mathematics Core
[ 3 ]

Question (b)

(b)
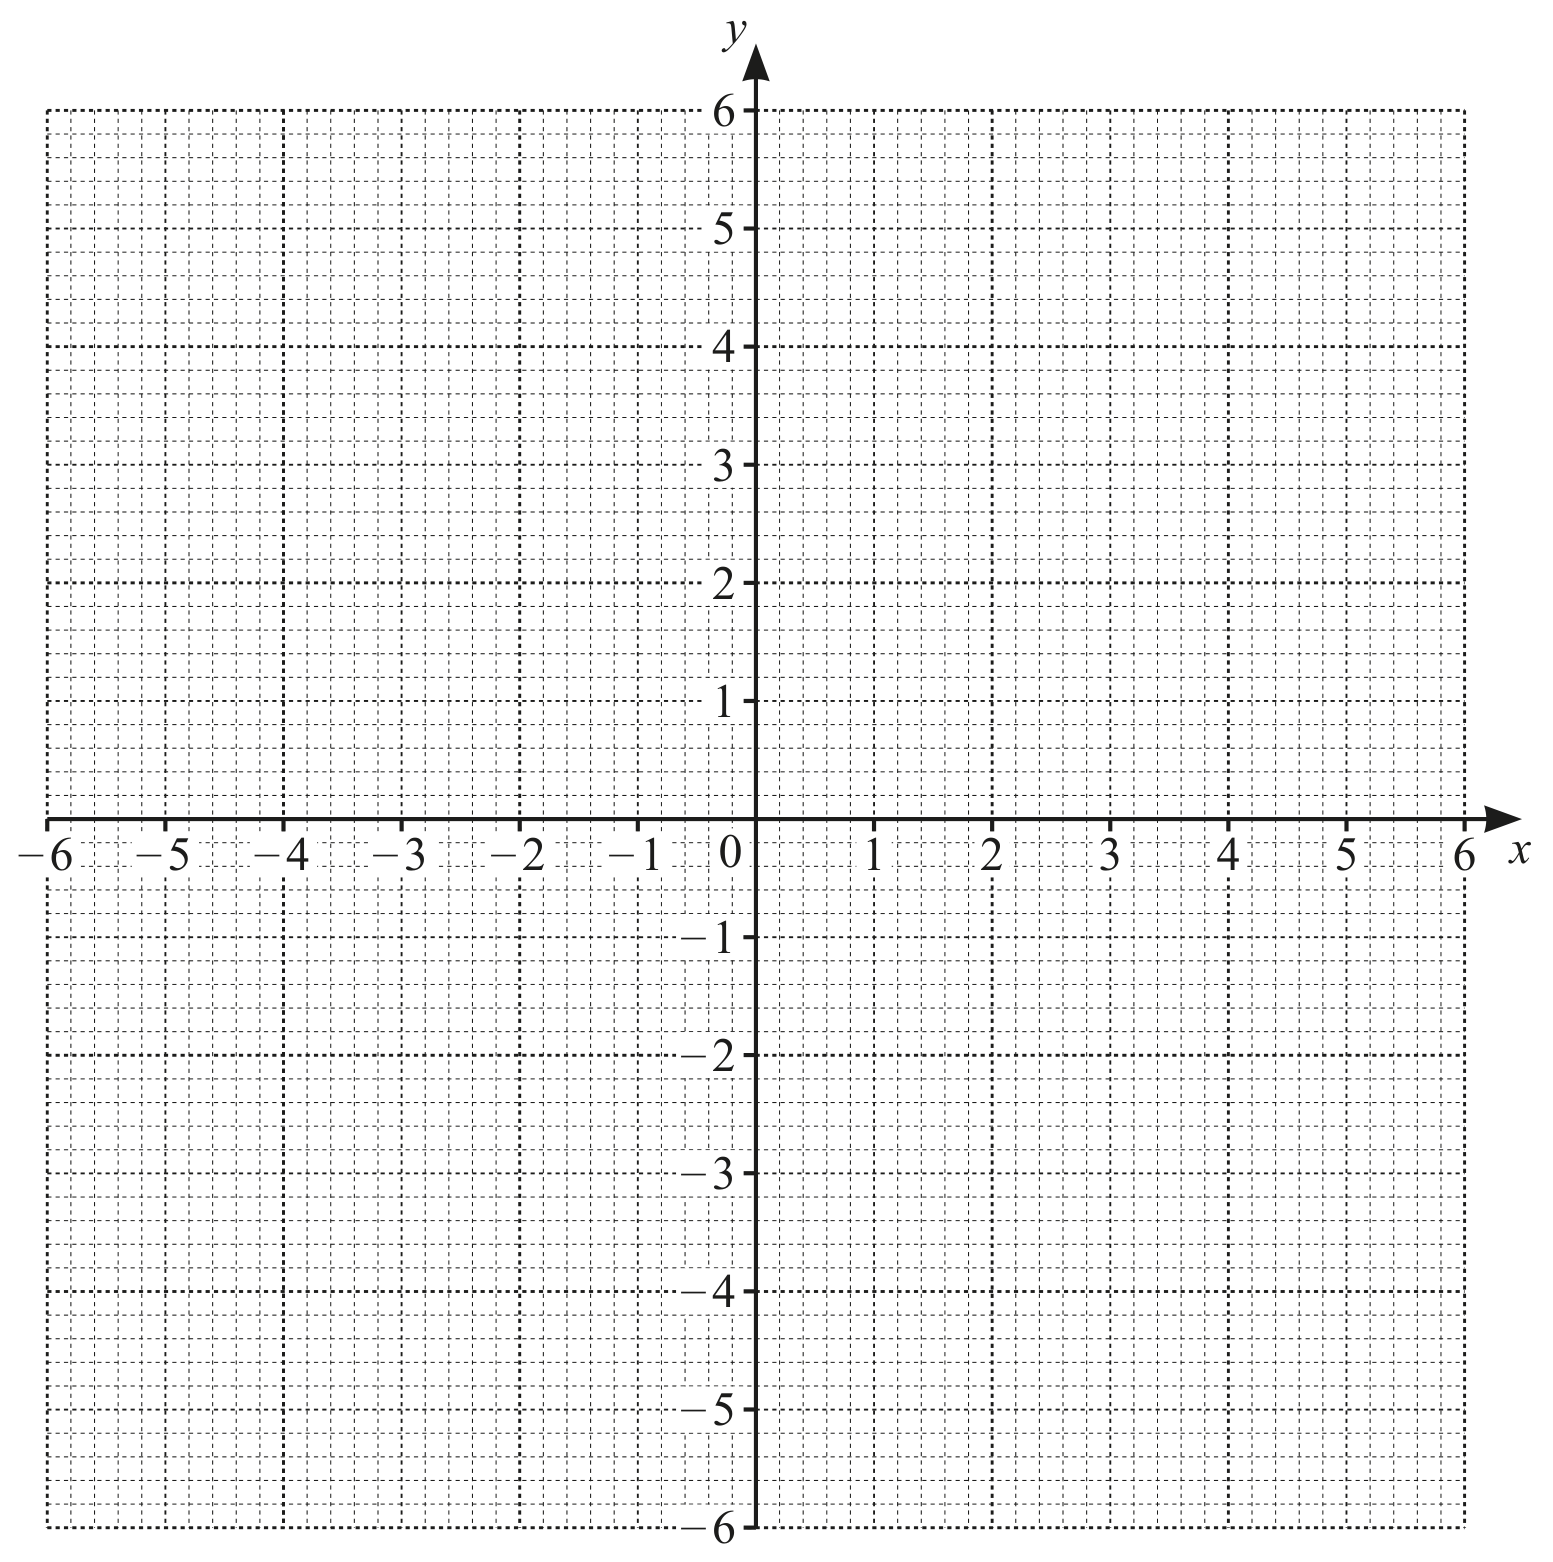
Figure for Question (b) — CAIE IGCSE Mathematics Core

On the grid, draw the graph of y=6xy=\frac{-6}{x} for 6x1-6\leqslant x\leqslant-1 and 1x61\leqslant x\leqslant6.

[ 4 ]

Question (c)

(c)

Use your graph to solve the equation 6x=2.5\frac{-6}{x}=2.5.

x=
[ 1 ]

C2.10 Graphs of functions question 2

[Maximum number: 1]

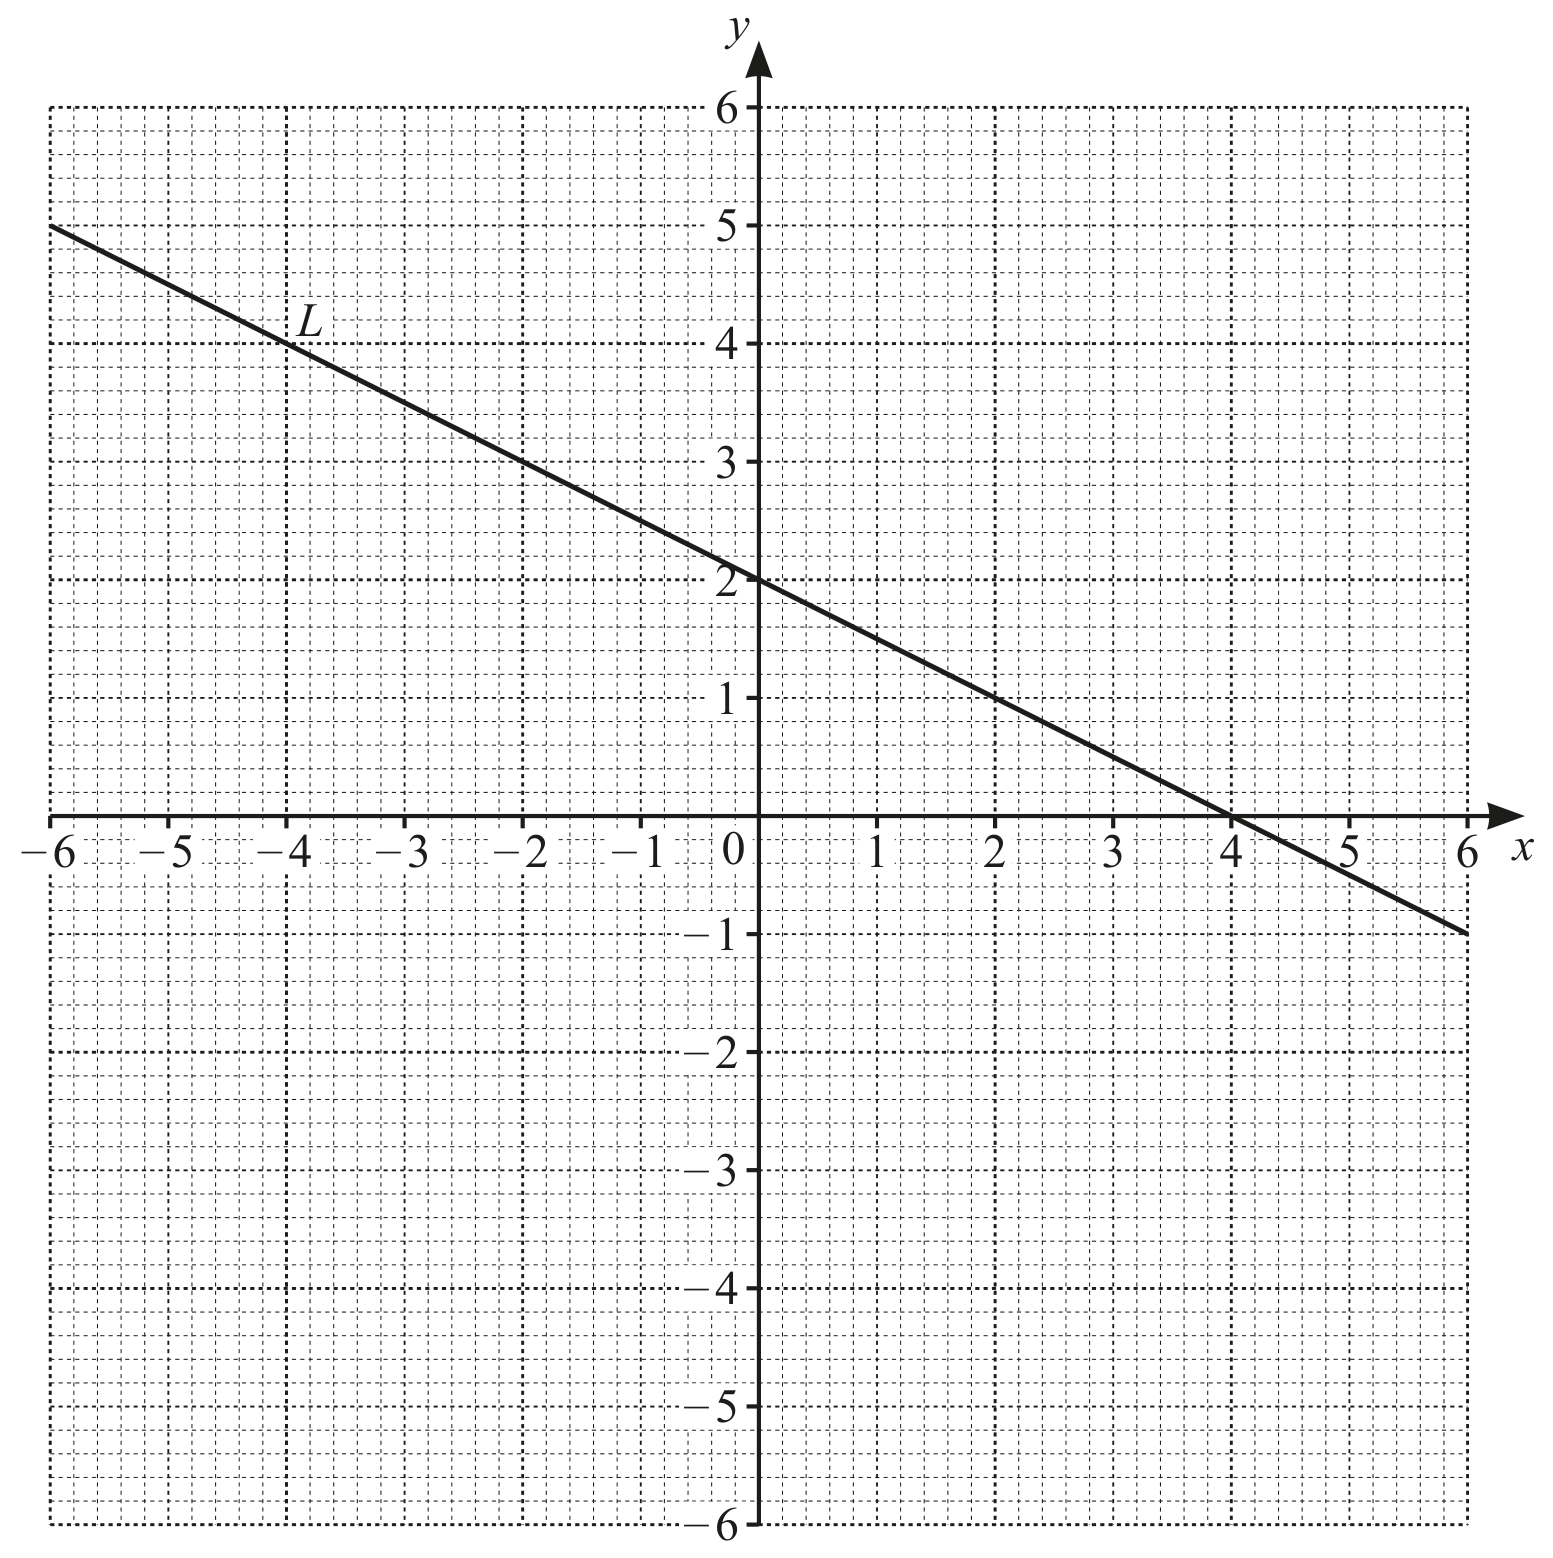
The grid shows a line L.

Figure for Question C2.10 Graphs of functions question 2 — CAIE IGCSE Mathematics Core

Write down the coordinates of the point which lies on both line L$ and the graph of $y=2x+5.

All question bank results loaded