CAIE IGCSE Mathematics Core Statistics Question Bank

Practise organising and interpreting data, calculating averages and spread, and constructing statistical diagrams from raw, grouped and cumulative information.

Syllabus
2028–2030
Topic
9
Level
Core

9. Statistics question 1

[Maximum number: 6]

Miguel works in an office.

Question (a)

(a)
Figure for Question (a) — CAIE IGCSE Mathematics Core

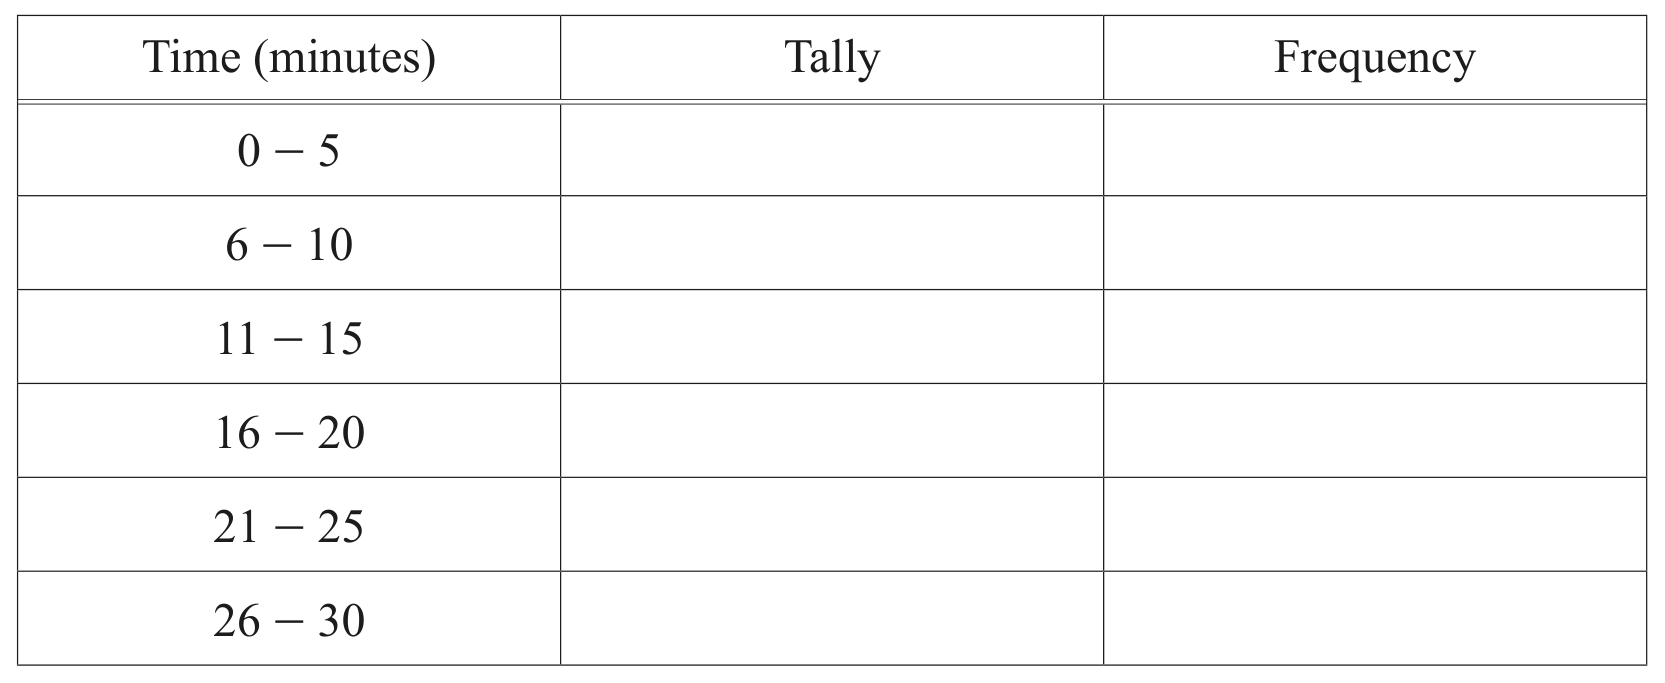
Miguel records the length of time of each telephone call he receives, correct to the nearest minute.
The recorded times are shown in the table.

[ 6 ]

Question (i)

(i)
Figure for Question (i) — CAIE IGCSE Mathematics Core

Complete the frequency table.
You may use the tally column to help you.

[ 2 ]

Question (ii)

(ii)

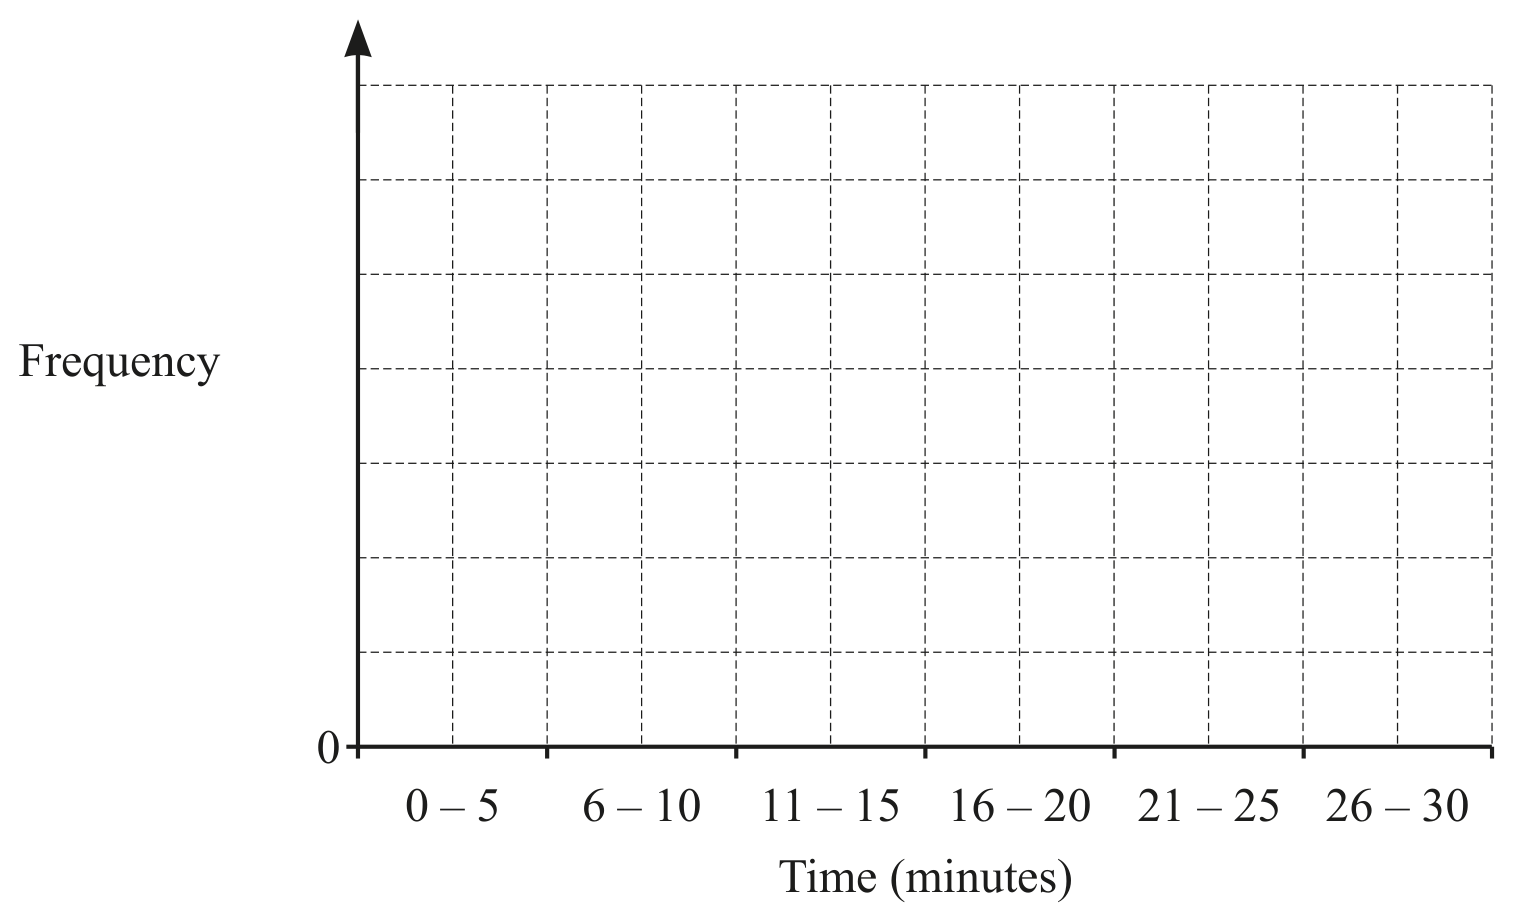
Draw a bar chart to show this information.

Complete the scale on the frequency axis.

Figure for Question (ii) — CAIE IGCSE Mathematics Core
[ 3 ]

Question (iii)

(iii)

Use the bar chart to write down the modal group.

[ 1 ]

9. Statistics question 2

[Maximum number: 4]

Question (a)

(a)

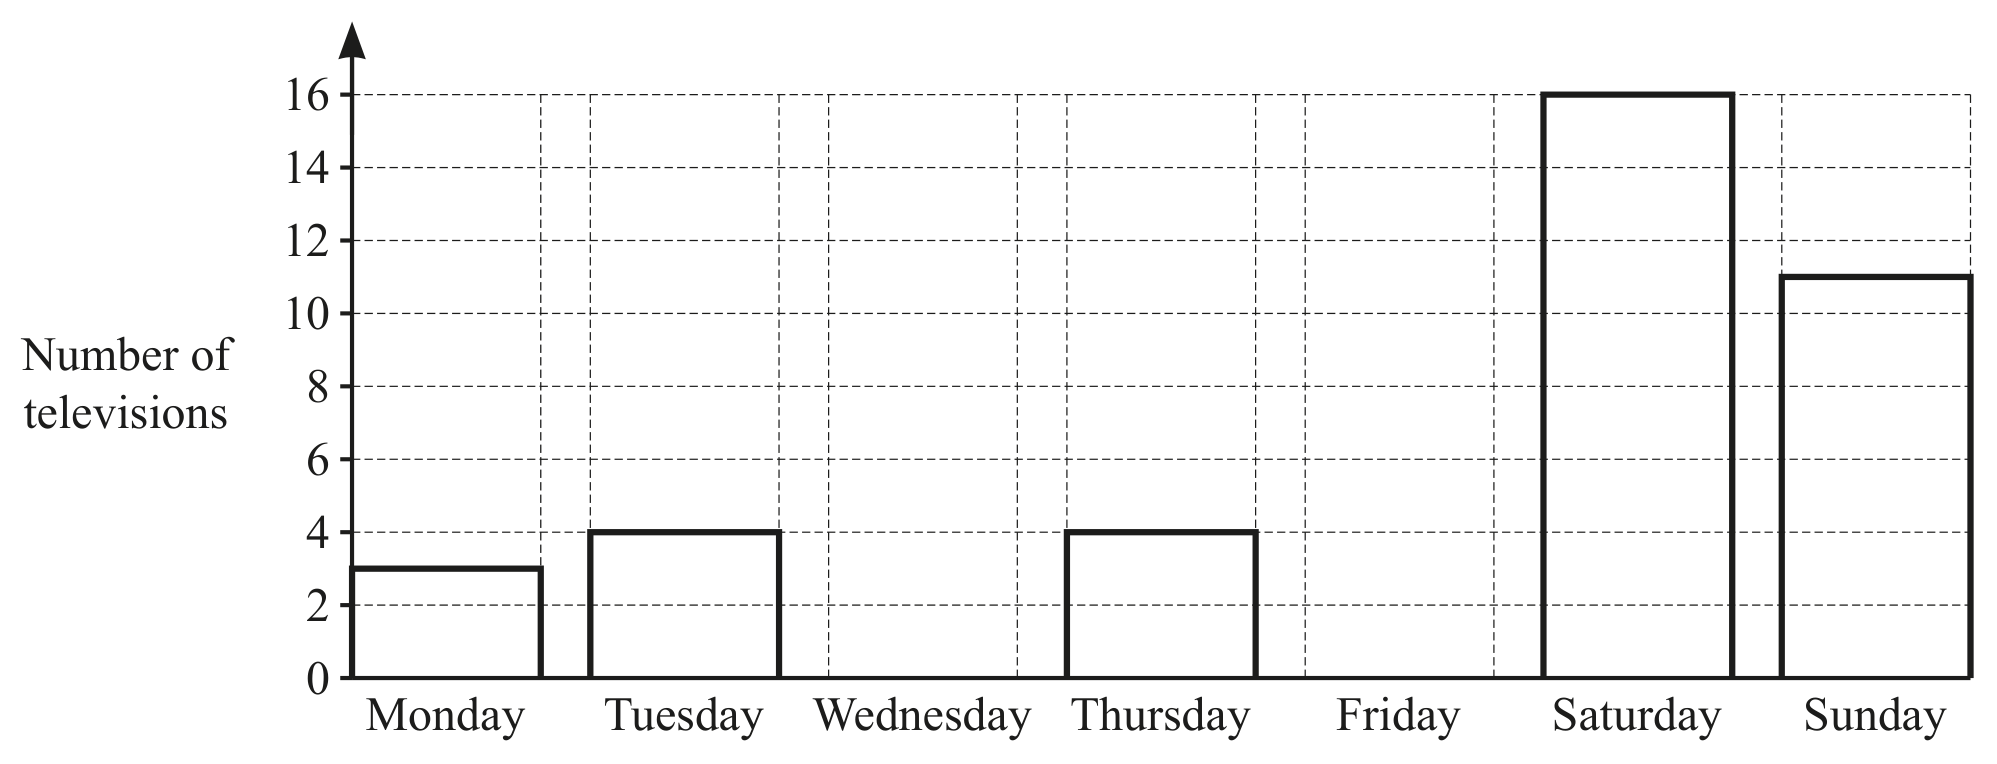
A shop sells 58 televisions in one week.
The bar chart shows the number of televisions that the shop sells on five of the days.

Figure for Question (a) — CAIE IGCSE Mathematics Core
[ 3 ]

Question (i)

(i)

Write down the number of televisions that the shop sells on Monday.

[ 1 ]

Question (ii)

(ii)

Find the fraction of the televisions that the shop sells on Sunday.

[ 1 ]

Question (iii)

(iii)

Write down the mode.

[ 1 ]

Question (b)

(b)
Figure for Question (b) — CAIE IGCSE Mathematics Core

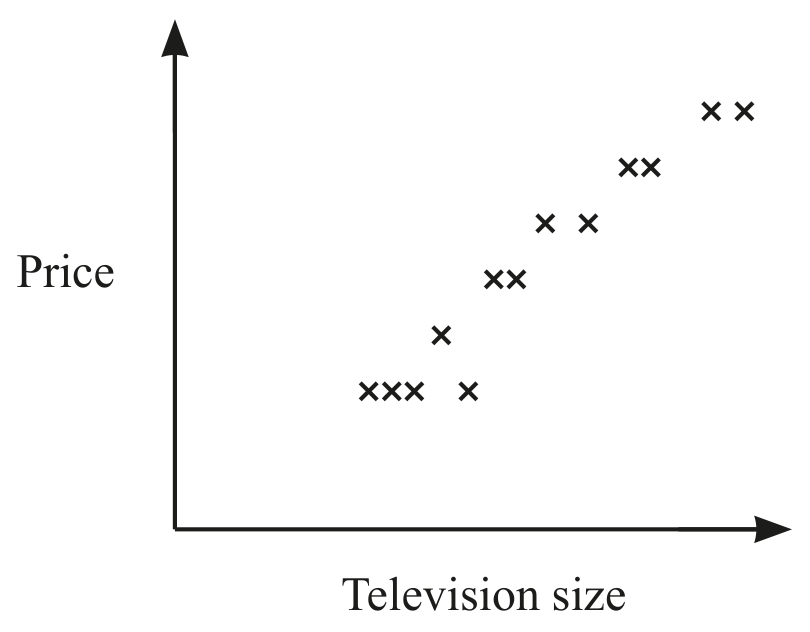
The scatter diagram shows the prices of different sized televisions.

Write down the type of correlation shown in the scatter diagram.

[ 1 ]

9. Statistics question 3

[Maximum number: 5]

Question (a)

(a)

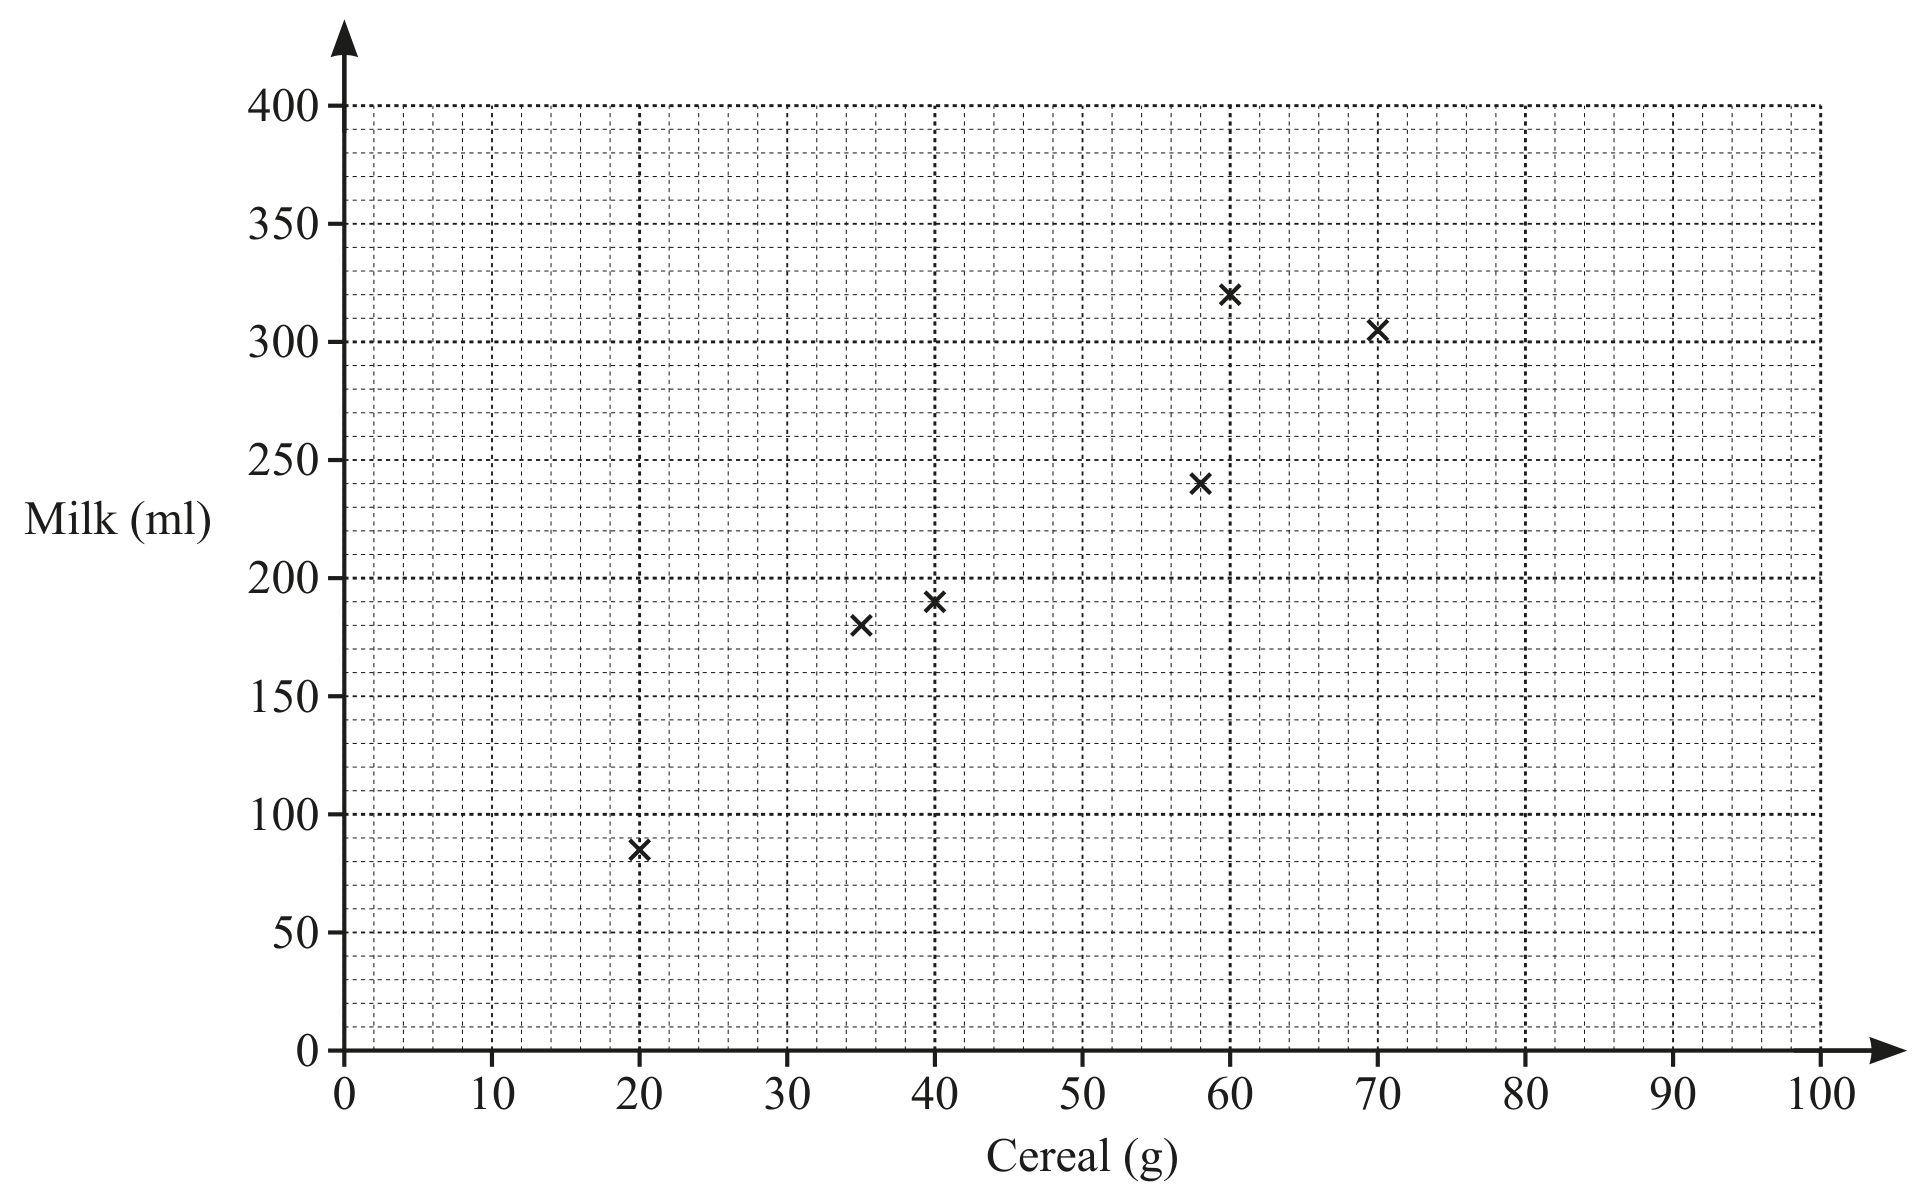
Ten students eat cereal with milk for breakfast.
The amounts are shown in the table.

Table for Question (a) — CAIE IGCSE Mathematics Core
Figure for Question (a) — CAIE IGCSE Mathematics Core
[ 5 ]

Question (i)

(i)

Complete the scatter diagram.

The first six points have been plotted for you.

[ 2 ]

Question (ii)

(ii)

For these students, describe the relationship between the amount of cereal and the amount of milk.

[ 1 ]

Question (iii)

(iii)

On the grid, draw a line of best fit.

[ 1 ]

Question (iv)

(iv)

Another student has 280 ml of milk with her cereal.

Use your line of best fit to estimate an amount of cereal this student has.

___ g

[ 1 ]

9. Statistics question 4

[Maximum number: 10]

Question (a)

(a)

20 students from College A each run 5 km.
The times, correct to the nearest minute, are recorded.

Table for Question (a) — CAIE IGCSE Mathematics Core
[ 6 ]

Question (i)

(i)

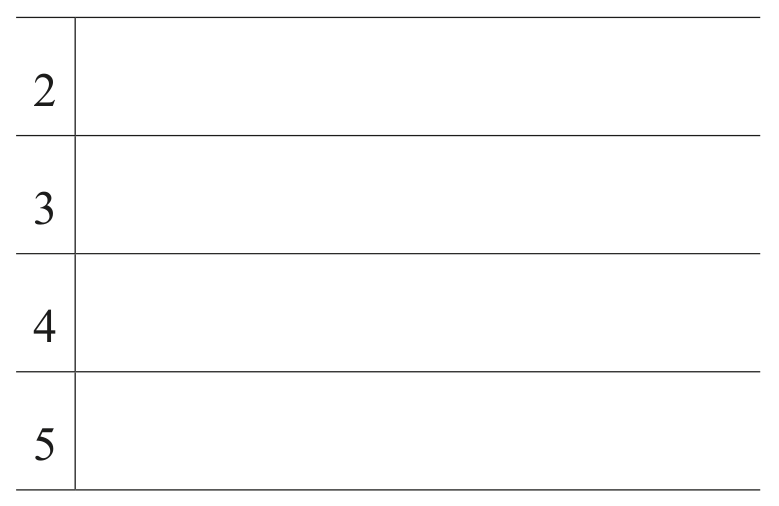
Complete the stem-and-leaf diagram.
Key: 3 | 4 represents 34 minutes.

Table for Question (i) — CAIE IGCSE Mathematics Core
[ 2 ]

Question (ii)

(ii)

Find the range of the times.

___ min

[ 1 ]

Question (iii)

(iii)

Find the median of the times.

___ min

[ 1 ]

Question (iv)

(iv)

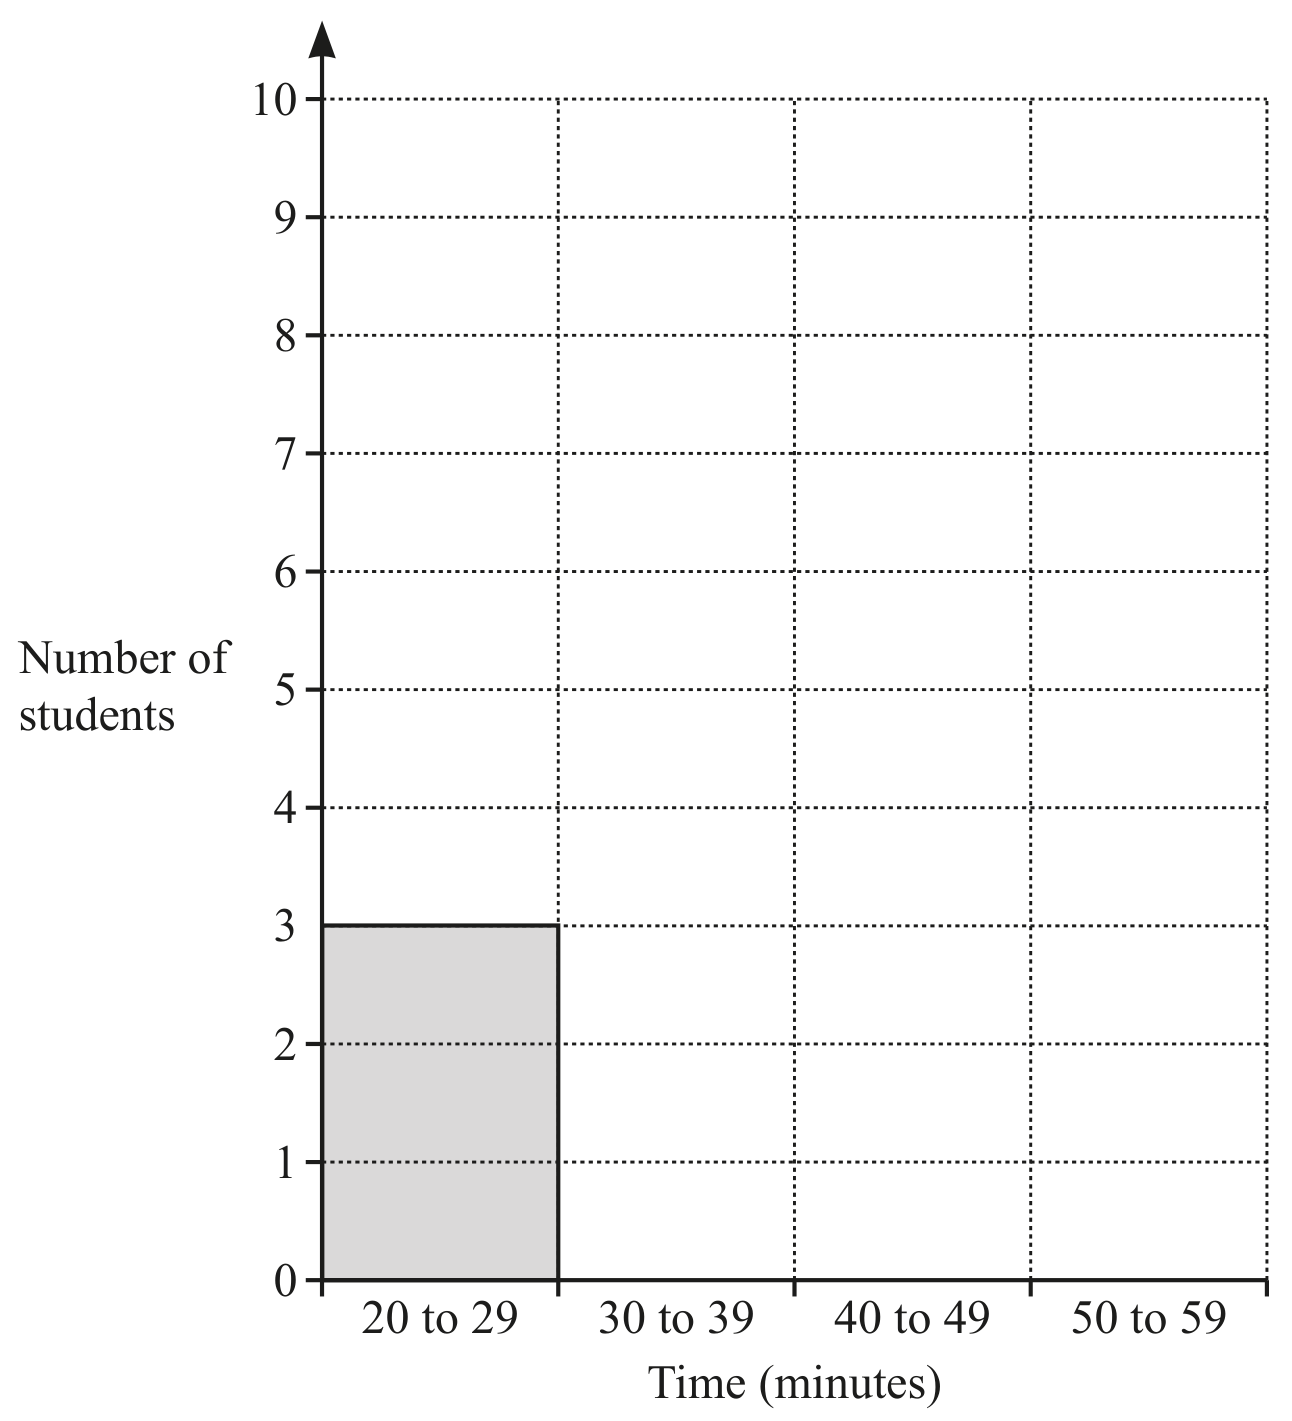
Complete the bar chart for the times of the students.

Figure for Question (iv) — CAIE IGCSE Mathematics Core
[ 2 ]

Question (b)

(b)

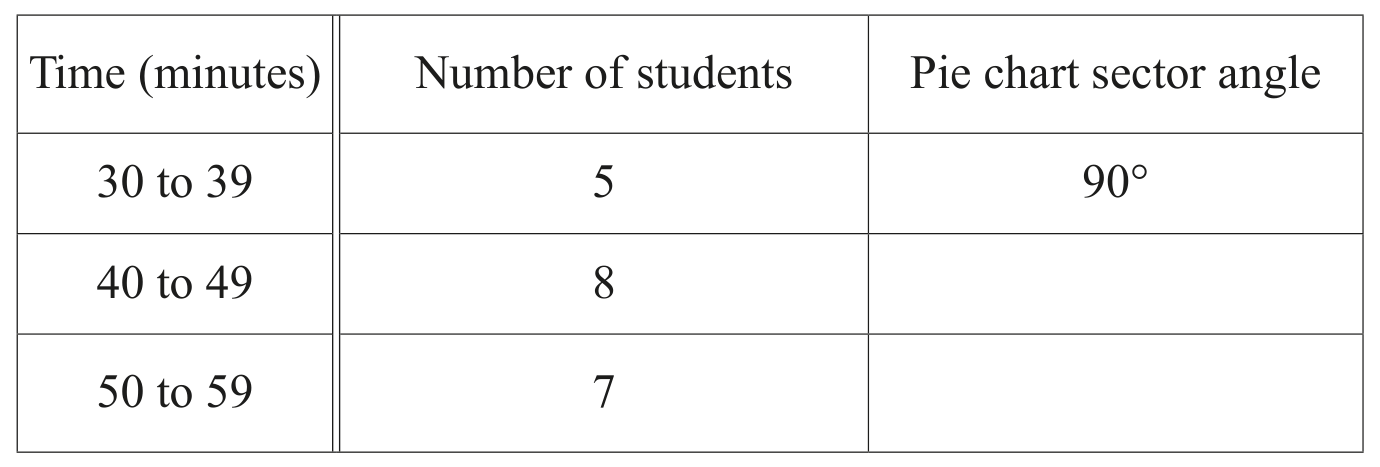
20 students from College B each run 5 km .

Their times, correct to the nearest minute, are recorded and the results are shown in the table.

Table for Question (b) — CAIE IGCSE Mathematics Core
[ 2 ]

Question (i)

(i)

Complete the pie chart.

[ 2 ]

Question (c)

(c)

Write down two comments comparing the times of students from College A with the times of students from College B.

1

2

[ 2 ]
All question bank results loaded