EduNinja

IB Biology HLC4.2 Transfers of energy and matterQuestion Bank

Question 1

[Maximum number: 3]

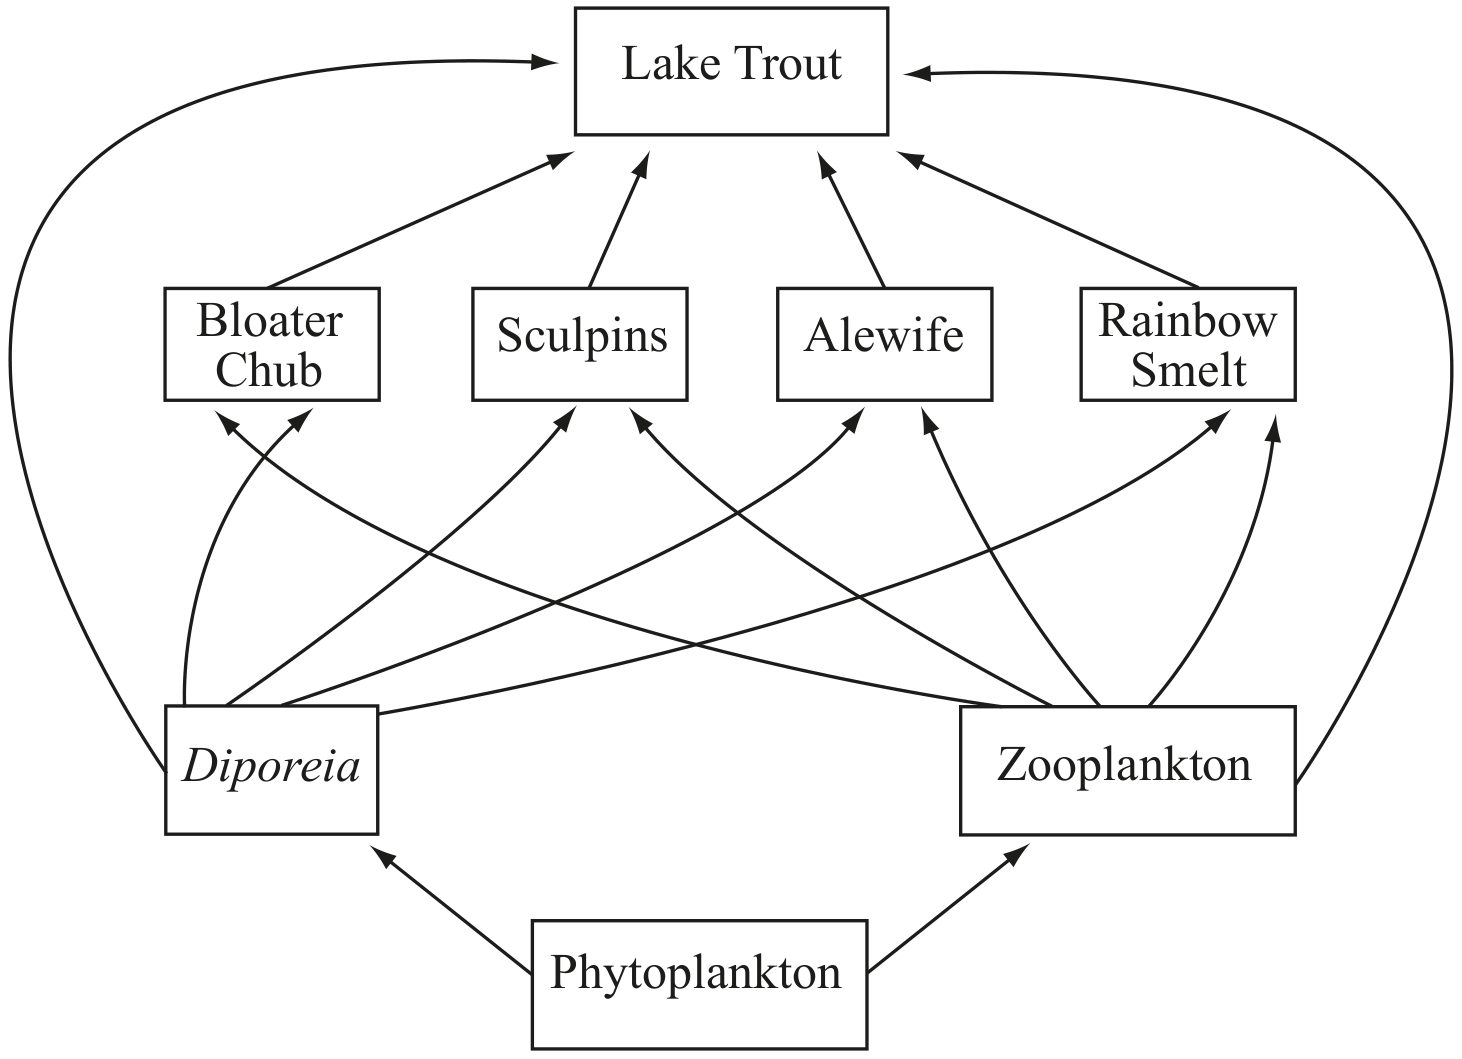
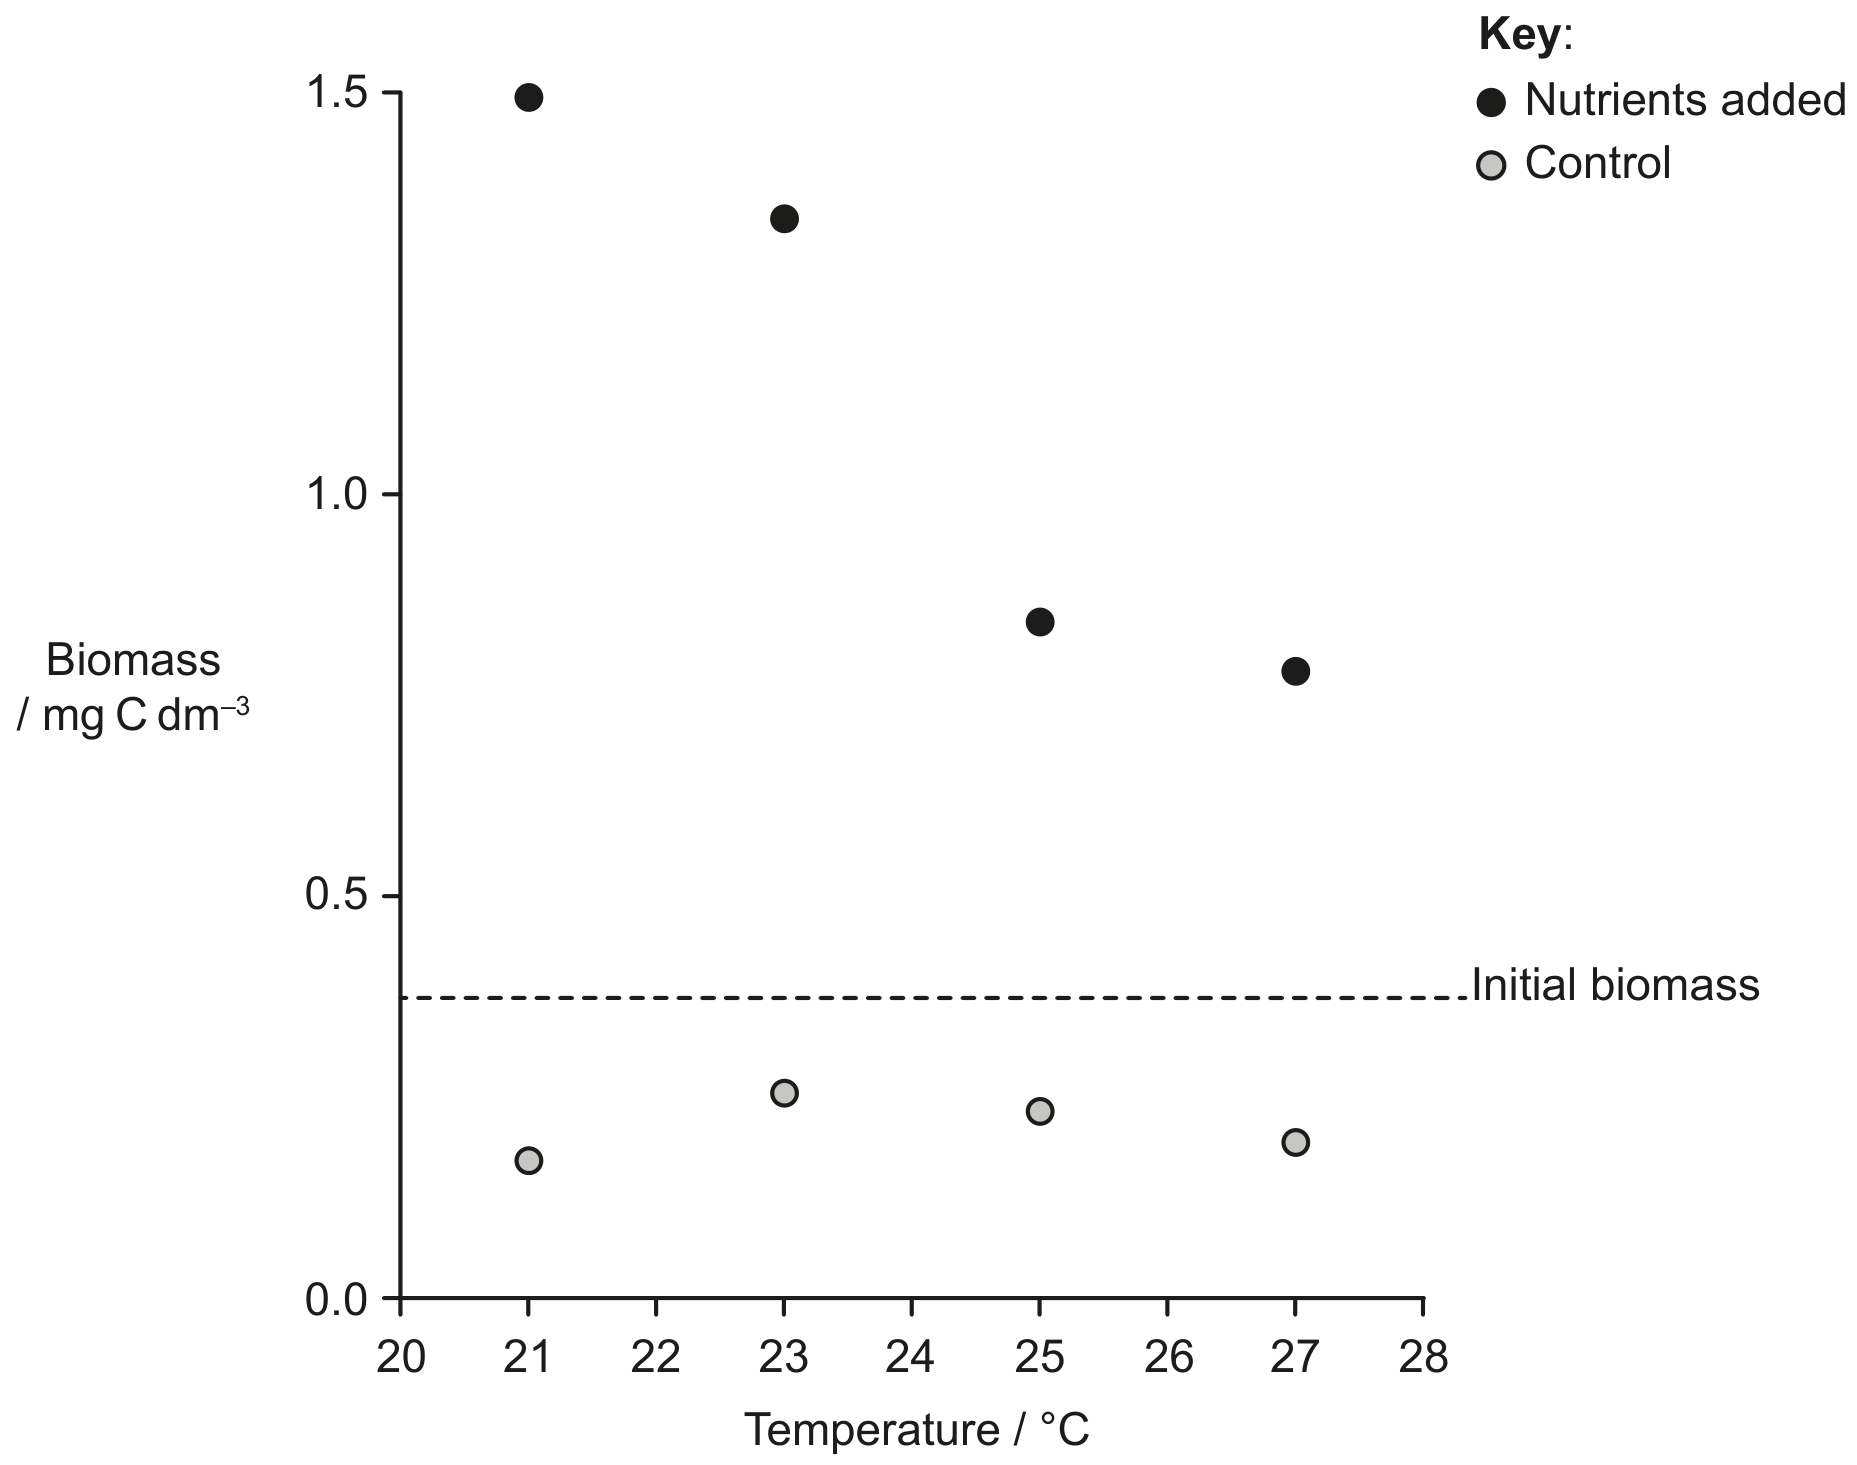
A community living in the water of an estuary was used to investigate how climate change may affect ecological systems. The food web in this community included phytoplankton (producers), zooplankton (consumers) and saprotrophic bacteria. Small plastic mesocosms were set up with water from the estuary containing only these three groups of organisms. The mesocosms were subjected to four different temperatures and two nutrient levels (control and nutrients added) to replicate local variations of the conditions in the estuary during springtime warming.

The graph shows the biomass of the community for each of the eight mesocosms at the end of the experimental period. Biomass was measured in terms of the amount of carbon present. The horizontal line indicates the initial biomass.

Question image

Question 1(e)

(a)

In a larger study, California grassland was exposed to elevated temperature and nitrate concentration for five years. The graph shows the total biomass production in individual and in combined treatments. Error bars denote one standard error.

Question image

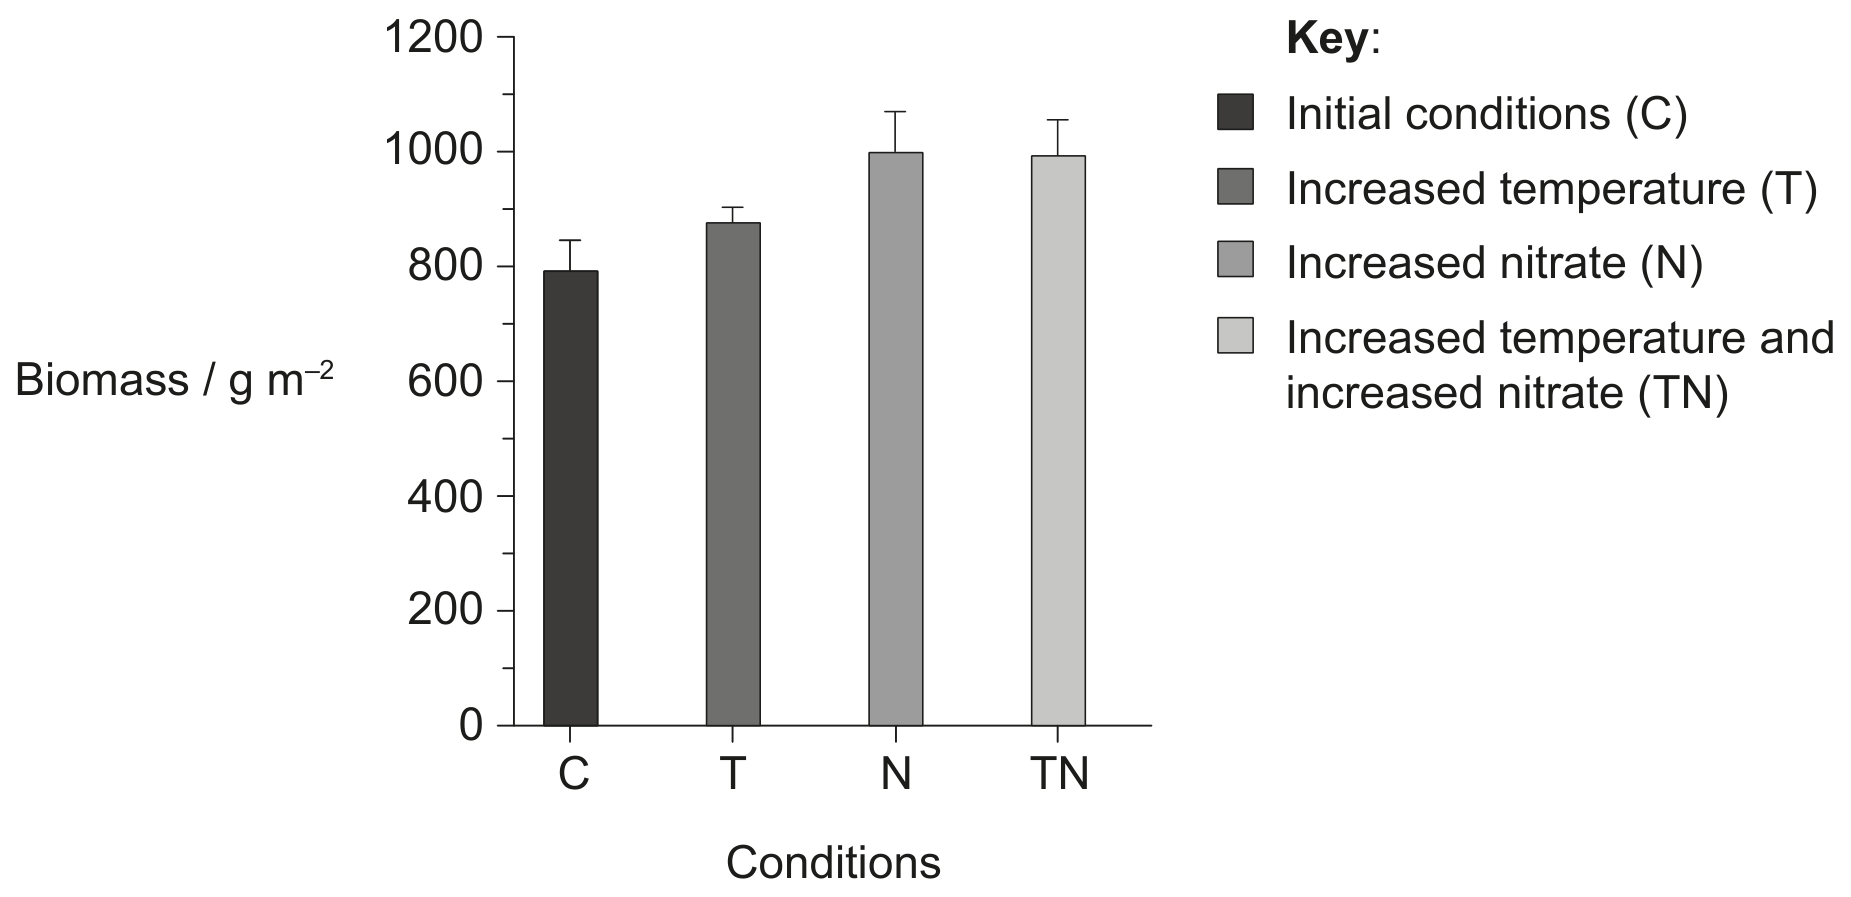
Describe the effects of temperature and nitrate concentration on biomass.

[ 3 ]

Question 1

[Maximum number: 6]

Remote sensing satellites are used to monitor the Earth's ecosystems. One measure of ecosystem status is leaf area index (LAI), which is the total area of leaves in square metres per square metre ( m2 m2\mathrm{m}^{2} \mathrm{~m}^{-2} ) of the Earth's surface. The graph shows LAI estimates, calculated using data from the Global Inventory Monitoring and Modelling System (GIMMS), during the period from 1981 to 2011. The data points are monthly averages in four latitudinal zones in the northern hemisphere.

Question image

Question 1(d)

(a)

The data in the graph show a long-term trend in global LAI.

[ 2 ]

Question 1(d)(ii)

(i)

Global ecosystem modelling suggests that most of the change in LAI is due to increases in atmospheric carbon dioxide. Explain how rising atmospheric carbon dioxide ( CO2\mathrm{CO}_{2} ) concentration could cause the observed change in LAI.

[ 2 ]

Question 1(e)

(b)

The 2015 Paris Agreement sets out an international framework for avoiding dangerous climate change. A key aspect is conserving and enhancing sinks of greenhouse gases, including forests.

Free air carbon dioxide enrichment (FACE) experiments are being used to investigate whether increases in atmospheric CO2\mathrm{CO}_{2} concentration will cause biomass increases in existing forests. Three FACE experiments have been running for at least ten years in young, developing forests. Photosynthesis rates are measured in 25 to 30 m diameter plots. In control plots, carbon dioxide concentrations remain at current atmospheric levels (ambient CO2). In treatment plots, the CO2 concentration is raised by 50 % (elevated CO2\mathrm{CO}_{2} ).

The table gives some details of these experiments and the highest annual net primary production recorded during the period of the experiment. Net primary production is the mass of carbon absorbed and fixed by photosynthesis in plants that is not released due to plant respiration.

Question image

State the effect of elevated CO2\mathrm{CO}_{2} on net primary production in these young, developing forests.

[ 1 ]

Question 1(g)

(c)

In each forest, there are two or three trial plots per CO2 treatment. The bar chart shows the allocation of carbon from net primary production to different parts of the trees in these trial plots.

Question image

Evaluate the evidence from the bar chart that increases in carbon dioxide cause increases in carbon storage in young, developing forests.

[ 3 ]

Question 3

[Maximum number: 3]

The graph shows global CO2\mathrm{CO}_{2} contributions from the use of fuels since 1825. Emissions estimates for the years since 1950 are based on energy data from the United Nations while emissions estimates for years prior to 1950 have been constructed using a variety of sources.

Question image

Question 3(a)

(a)

Calculate the percentage increase in the use of liquid fuels from 1950 to 1975.

[ 1 ]

Question 3(b)

(b)

Referring to the data, compare and contrast the changes in the use of the different fuels between 1950 and 1975.

[ 2 ]

Question 2

[Maximum number: 1]

Water is the medium in which most processes of life occur.

Question 2(c)

(a)

State the trophic level of zooplankton.

[ 1 ]

Question 14

[Maximum number: 1]

The diagram shows a simplified Lake Michigan foodweb. Which pair of terms describes the trophic level of lake trout?

Question image

herbivore

detritivore

tertiary consumer

primary consumer

Question 14

[Maximum number: 1]

What is the classification of an organism that is able to make organic compounds from inorganic nutrients?

A

Autotroph

B

Consumer

C

Detritivore

D

Saprotroph

Question 14

[Maximum number: 1]

The diagram shows the food web for an aquatic ecosystem in which letters R-Z represent individual species.

Question image

Which organism is a tertiary consumer?

A

Organism T

B

Organism \cup

C

Organism W

D

Organism Y

Question 14

[Maximum number: 1]

In a woodland ecosystem, each tree provides food for numerous aphids which feed on the sap of the tree. The aphids are eaten by carnivorous beetles, as shown in the food chain.

Which pyramid of energy represents this relationship?

A
Question image
B
Question image
C
Question image
D
Question image

Question 14

[Maximum number: 1]

What happens in both respiration and photosynthesis?

A

Triose phosphates are decarboxylated.

B

NADPH is produced.

C

ATP is produced.

D

Electrons pass through ATP synthase.

Question 14

[Maximum number: 1]

The three-toed sloth, Bradypus variegatus, lives in tree tops where it feeds on leaves. It also feeds on algae and fungi which live in its fur.

Question image

In which trophic group should the three-toed sloth be classified?

A

Autotroph

B

Consumer

C

Detritivore

D

Saprotroph

0 selected