EduNinja

IB Biology HLC4.1 Populations and communitiesQuestion Bank

Question 1

[Maximum number: 2]

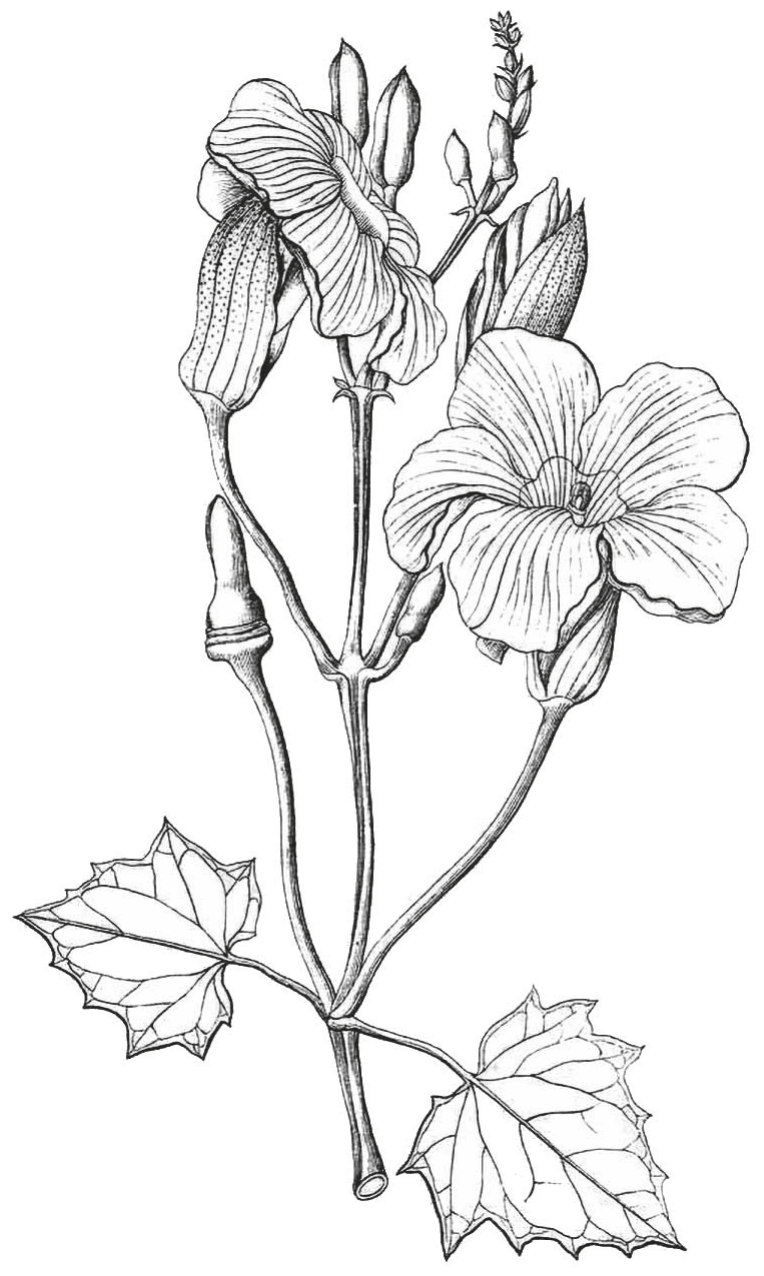
The drawing shows part of a Thunbergia grandiflora plant. It has been widely cultivated as an ornamental garden plant.

Question image

Question 1(b)

(a)

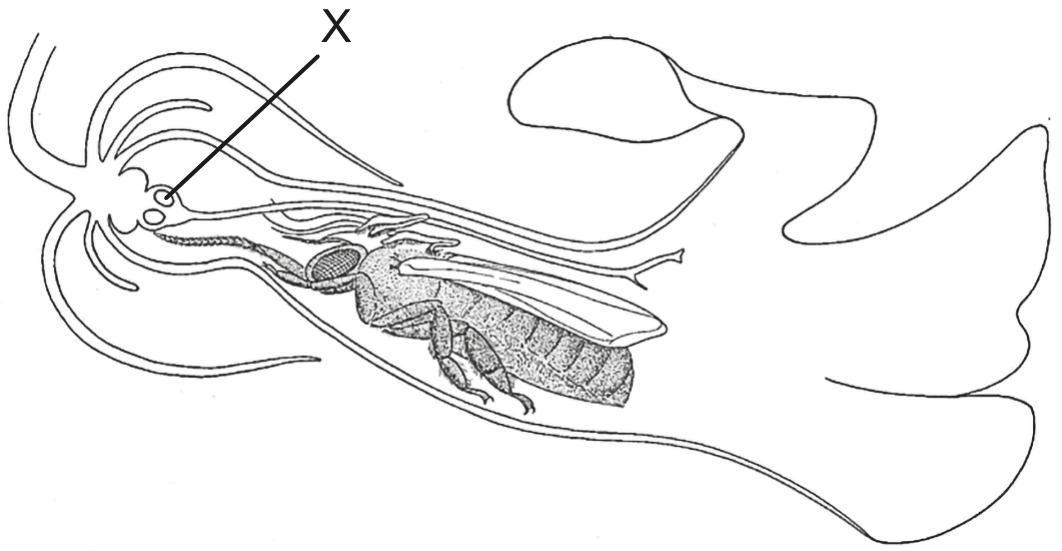
The drawing shows a section through a T. grandiflora flower, which contains a honeybee (Apis mellifera).

Question image
[ 2 ]

Question 1(b)(ii)

(i)

Outline the relationship the bee has with the T. grandiflora flower.

[ 2 ]

Question 1

[Maximum number: 4]

White sage (Salvia apiana) is a native Californian shrub. Slender oat (Avena barbata) is a grass, originally from the Mediterranean, which was introduced to California. The map shows the distribution of the two species in relation to one another in an area near Santa Ynez, California.

Question image

Question 1(a)

(a)

Using the scale bar, determine the area of quadrat A1, giving the units.

[ 1 ]

Question 1(b)

(b)

Outline how chi-squared can be used to test for an association between the distributions of the two species.

[ 3 ]

Question 1

[Maximum number: 2]

The yeast Metschnikowia bicuspidata is a parasite of a species of zooplankton, Daphnia dentifera. Biologists monitored the infections of D. dentifera populations in a series of lakes in Indiana (USA). An increase in nitrogen compounds dissolved in the lakes causes the phytoplankton populations to increase. D. dentifera feed on phytoplankton.

The graphs show the
- relationship between nitrogen levels dissolved in the water and the size of the parasite epidemic in the D. dentifera population.
- relationship between the size of the parasite epidemic in the D. dentifera population and the change in the resistance (established by comparing the infection of the D. dentifera populations before and after the epidemic).

Question image

Question 1(d)

(a)

Predict the effect of predation by fish on the level of resistance to the parasite in the D. dentifera populations.

[ 2 ]

Question 1

[Maximum number: 2]

To estimate the size of the turtle population, the Fish and Wildlife Research Institute (FWRI) conducted an annual survey along the coast of Florida from 1989 to 2021. They counted the number of turtle nests on selected beaches where turtles lay their eggs. The graphs show the results for the loggerhead turtle (Caretta caretta) and the green turtle (Chelonia mydas).

Question image

Question 1(c)

(a)

Suggest the limitations of only using nesting turtles to estimate the annual population.

[ 2 ]

Question 1

[Maximum number: 3]

Brandt's voles (Lasiopodomys brandtii) are small herbivorous rodents that live in the steppe grassland of Inner Mongolia. These mammals live in large family groups and feed on the roots, stems and leaves of a wide variety of plants that grow near their burrows. Their feeding activities have been found to have a large impact on the grassland vegetation. Researchers investigating the impact of these voles on the vegetation marked out plots of land and recorded how the biomass of two types of grasses, rhizome grasses and bunch grasses, changed in the presence and absence of voles from the years 2013 to 2017.

Question image

Key:

Question image

- voles
- no voles

Question 1(c)

(a)

The voles derive nutrition from only one type of the grasses. Deduce with a reason which type.

In a second study carried out from 2019 to 2020, researchers looked at how the presence of voles changed the plant volume of one type of bunch grass, Achnatherum splendens, in measured plots of land. This was done by measuring the change in plant volume of A. splendens in the plots.

Question image
[ 1 ]

Question 1(i)

(b)

Suggest a reason for the change in the plant volume of A. splendens in the plots over the period of this study.

In a final experiment, the researchers prepared plots containing varying levels of cover of A. splendens, as well as the plants the voles normally feed on. Shrikes were not excluded from the plots. The amount of time the voles spent feeding and the mortality rate of the voles was recorded over a 3 -week period.

Question image
Question image
[ 1 ]

Question 1(j)

(c)

Describe, with a reason, the condition that favours survival of the voles.

[ 1 ]

Question 2

[Maximum number: 3]

The diagram shows levels of DDT, a pesticide, in an aquatic food web in Lake Kariba, Africa. Numbers represent ppm (parts per million) of DDT in fat tissue.

Question image

Question 2(c)

(a)

Outline how the population size of tilapia could be estimated.

[ 3 ]

Question 13

[Maximum number: 1]

Over time, the hull of a sunken ship may become colonized by a wide range of marine organisms. What term is used to describe all of the organisms living in and on a sunken ship?

A

A community

B

An ecological niche

C

A population

D

An ecosystem

Question 4

[Maximum number: 1]

The pavement ant (Tetramorium caespitum) eats organic matter found within its territory. Individual ants leave their nest to forage for food. When they find a suitable source of food they return and communicate to other ants in the colony where the food can be found. The diagram shows the path of one ant when foraging for food and returning to the nest after finding food.

Question image

Question 4(e)

(a)

State one advantage to an insect of living in a colony.

[ 1 ]

Question E1

[Maximum number: 2]

In order to investigate the hypothesis that honeybees (Apis mellifera) have an instinct to forage for either nectar or pollen, but not both, researchers installed different feeders containing either nectar alone or pollen alone. They collected four different groups of honeybees (those arriving at the nectar feeders, arriving at the pollen feeders, departing from the nectar feeders and departing from the pollen feeders) and measured the abundance of eight peptides in their brains. The relative difference of these brain peptides was then calculated by subtracting the abundance in nectar foragers from the abundance in pollen foragers and is shown by the bars on the graphs below.

Change in peptide abundance between nectar and pollen foragers / arbitrary units

Change in peptide abundance between nectar and pollen foragers / arbitrary units

Question E1(d)

(a)

Discuss how this type of foraging behaviour could optimize food intake.

[ 2 ]

Question 14

[Maximum number: 1]

In an area of forest measuring 100 m by 100 m , samples were taken to estimate the number of silver maple (Acer saccharinum) trees in the forest. The number of trees counted in each of five areas of 400 m2400 \mathrm{~m}^{2} was recorded.

Question image

Approximately how many silver maple trees are in the 10000 m210000 \mathrm{~m}^{2} area of forest?

A

5

B

25

C

125

D

625

0 selected