EduNinja

IB Biology HLC1.3 PhotosynthesisQuestion Bank

Question 1

[Maximum number: 5]

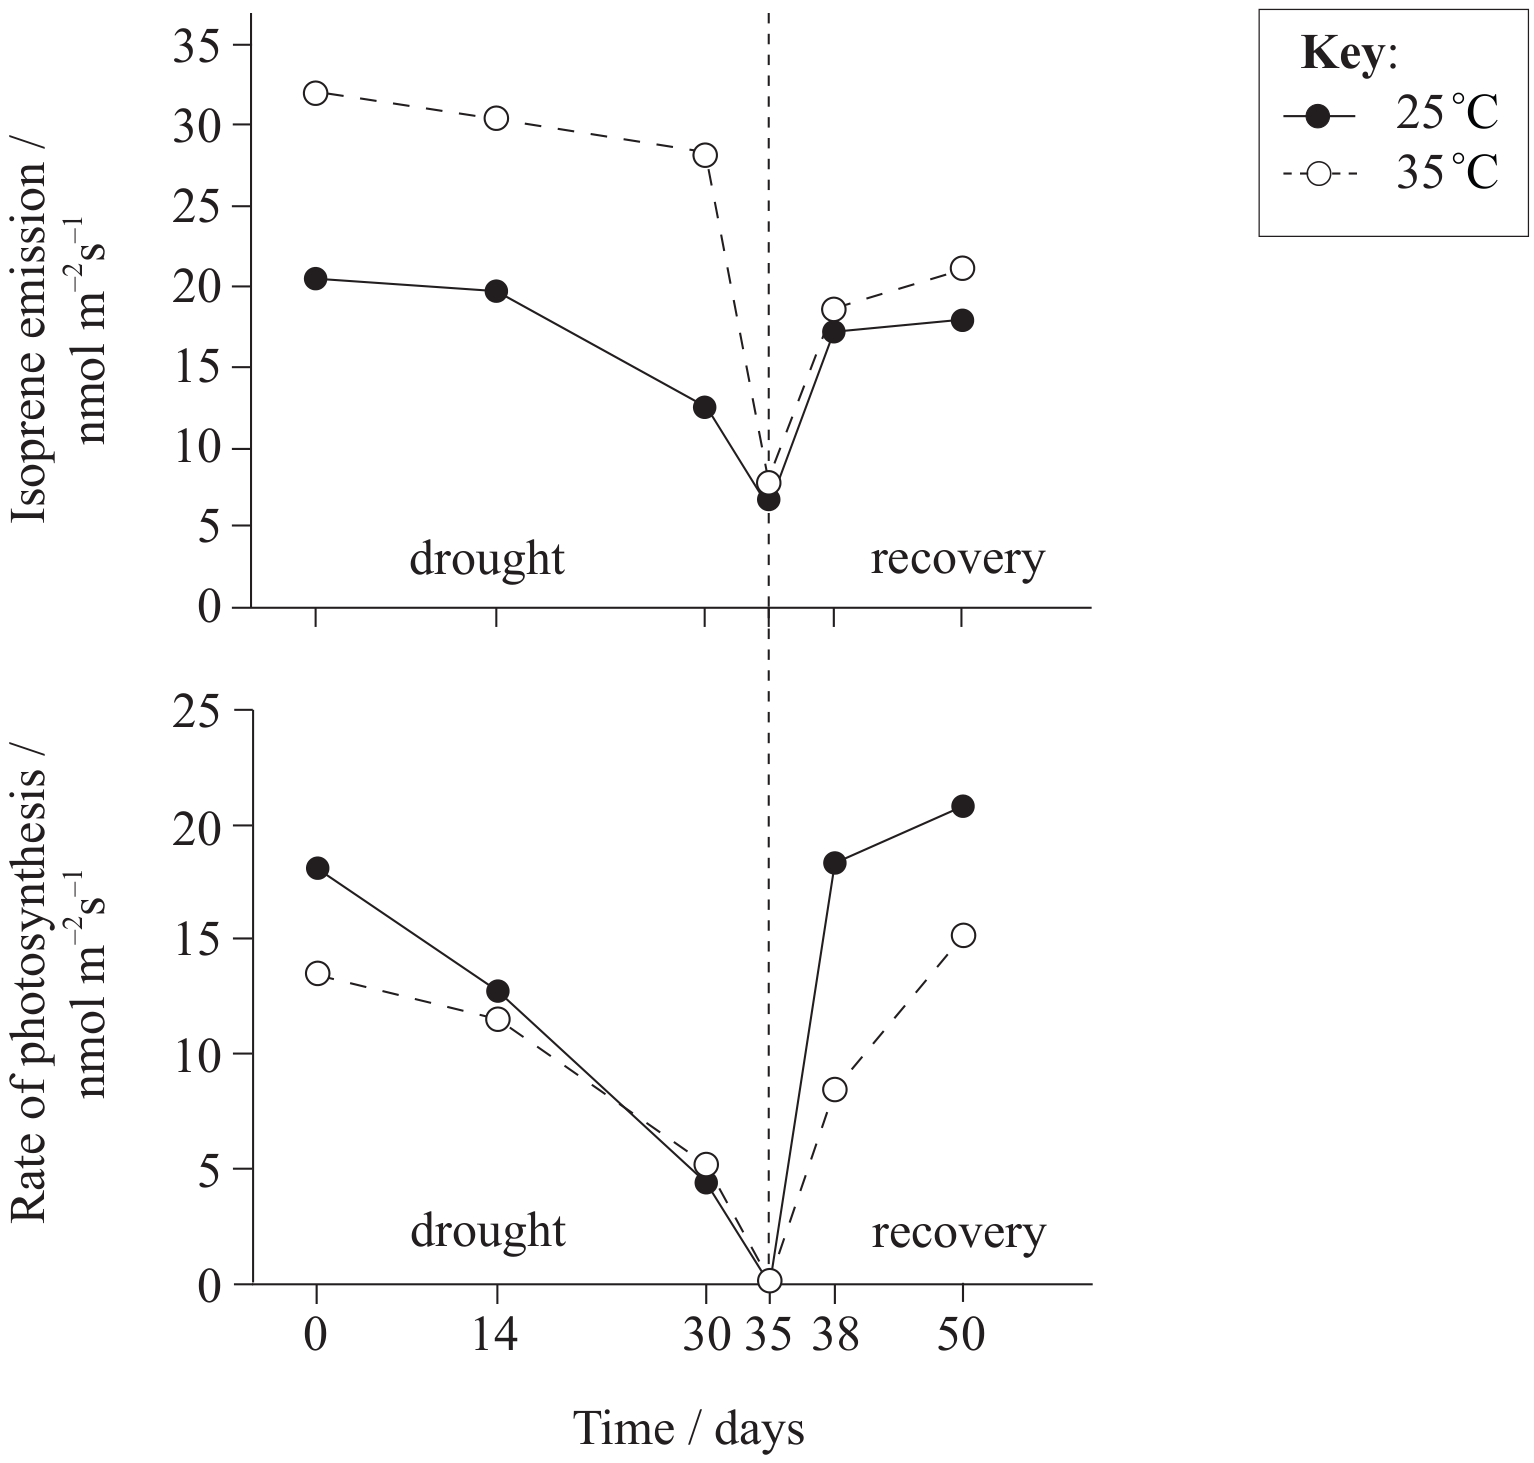
Isoprene is a chemical synthesized and emitted in large amounts by some plant species, especially oak (Quercus sp.) and poplar (Populus sp.) trees. It has been suggested that isoprene increases the tolerance of plants to high temperatures, which can cause a decrease in photosynthesis rates.

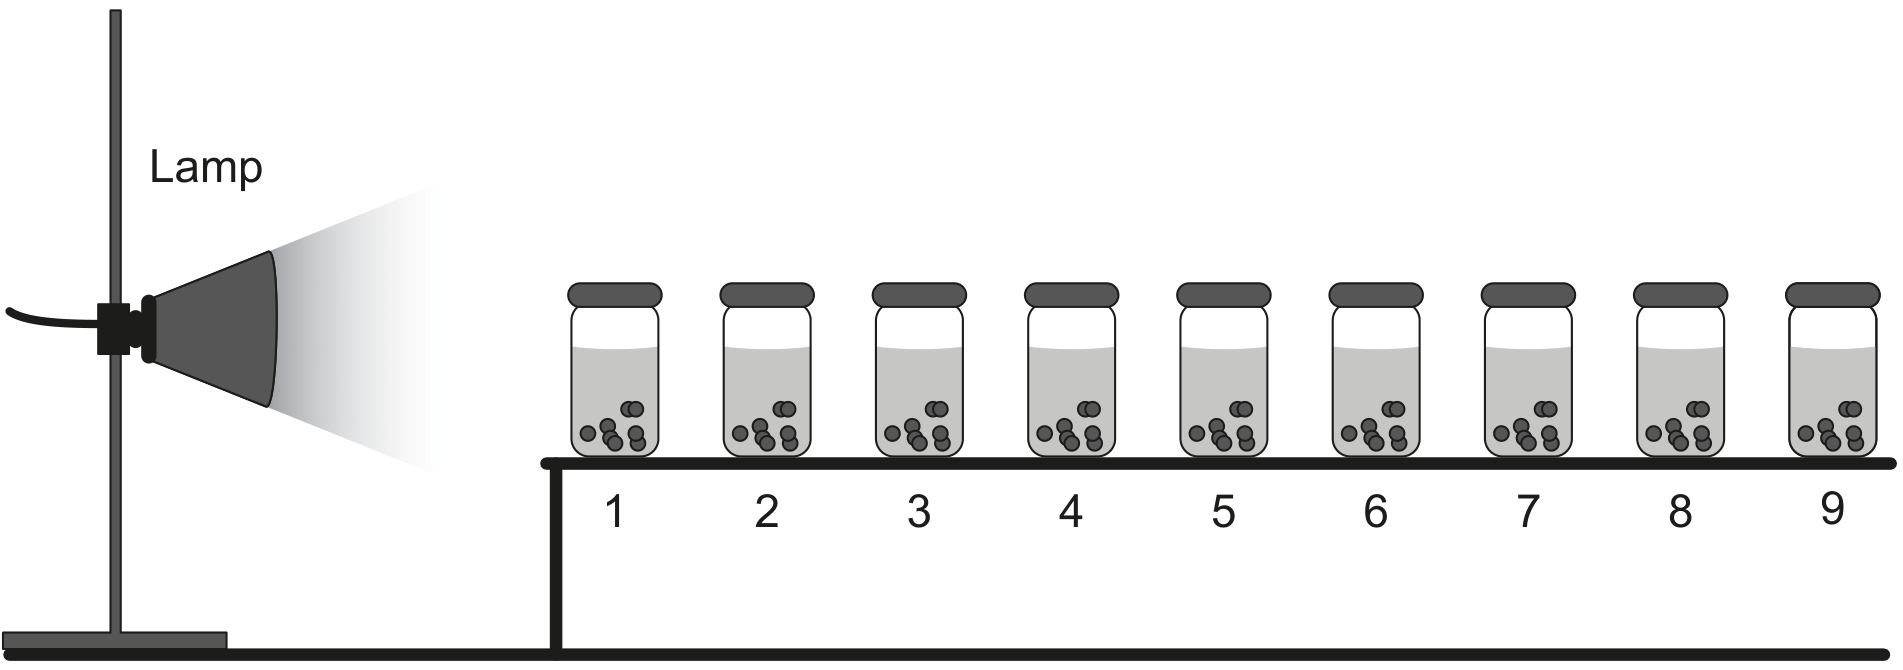
Black poplar (Populus nigra) plants were subjected to two raised temperatures and to drought. Measurements of photosynthesis and isoprene emission were made during a 35-day-long drought stress (drought period) and 3 and 15 days after re-watering stressed plants (recovery period). The rate of photosynthesis was recorded as the carbon dioxide taken up per unit of leaf area per second.

Question image

Question 1(b)

(a)

Suggest why heat treatment may reduce photosynthesis rates.

[ 2 ]

Question 1(f)

(b)

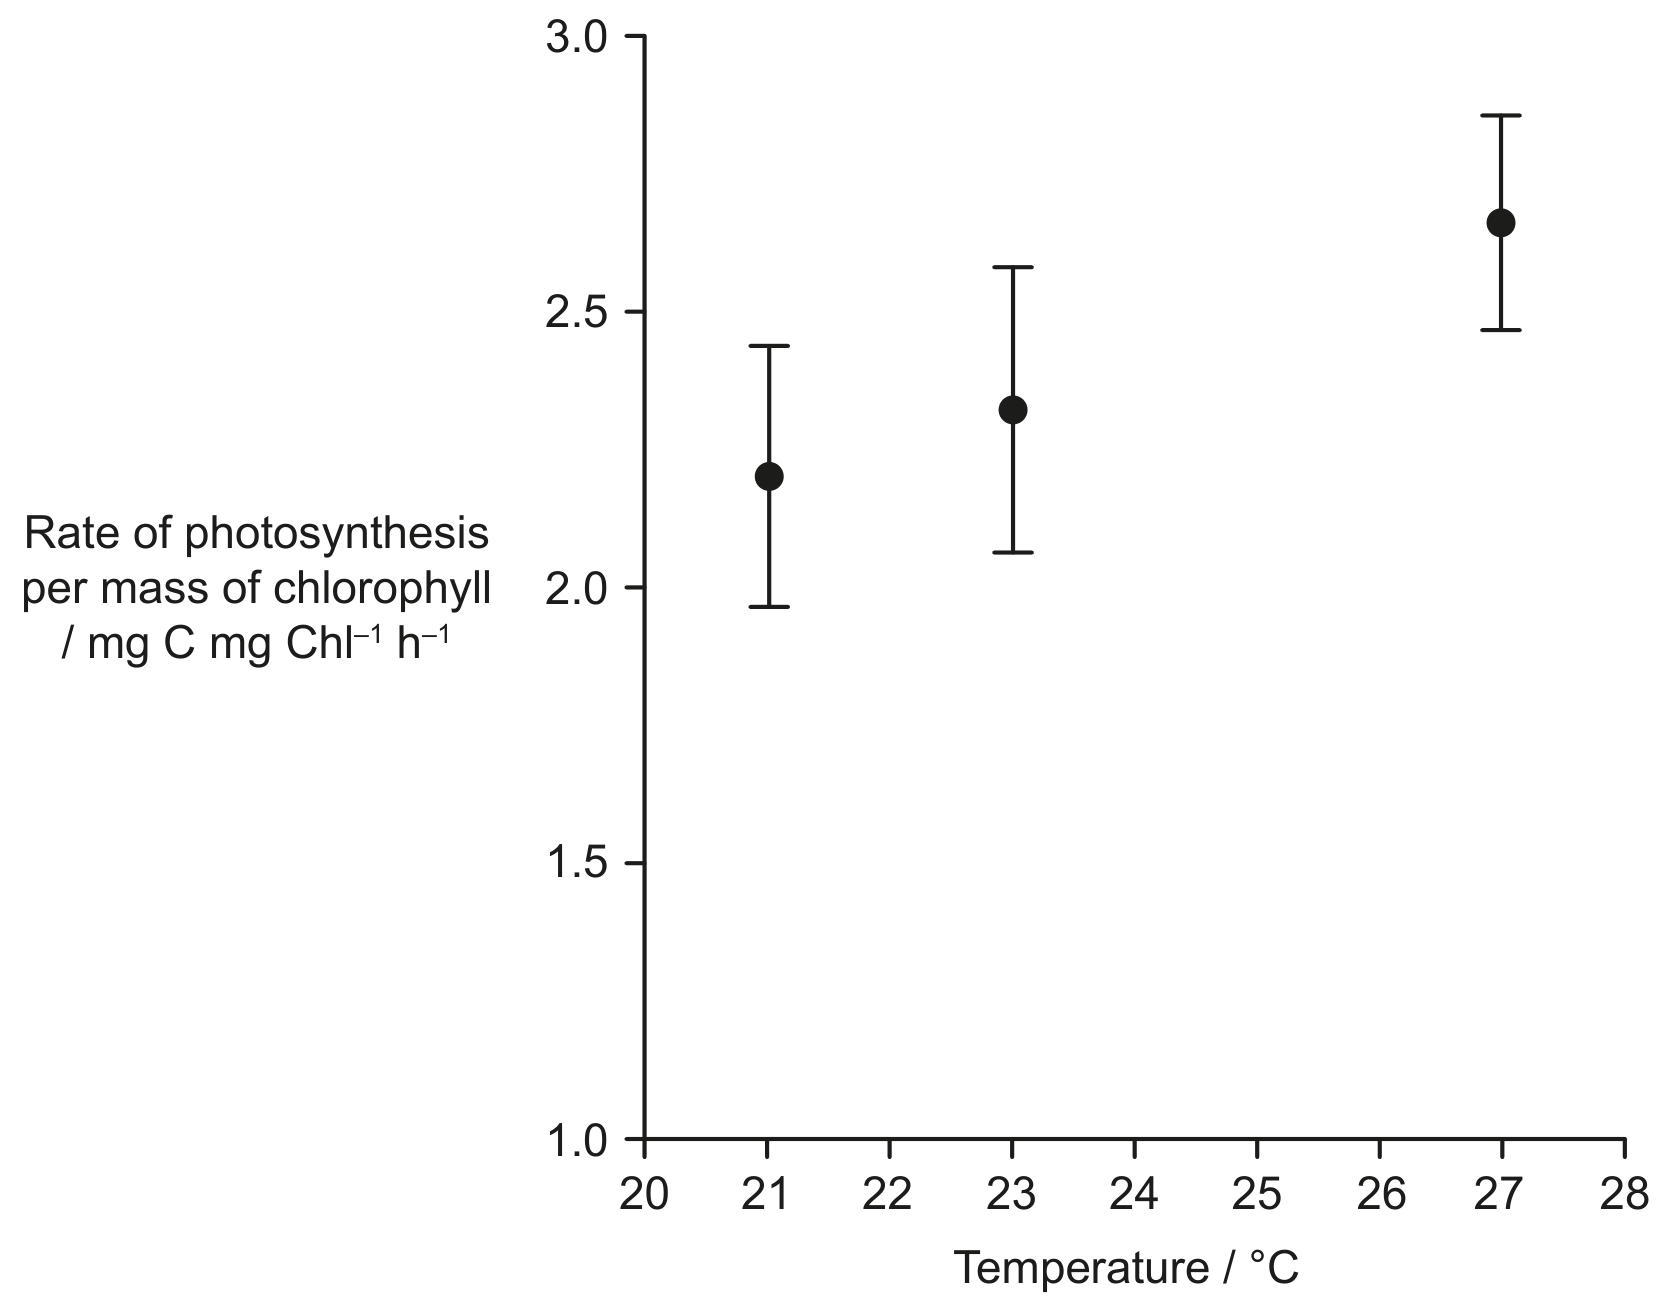
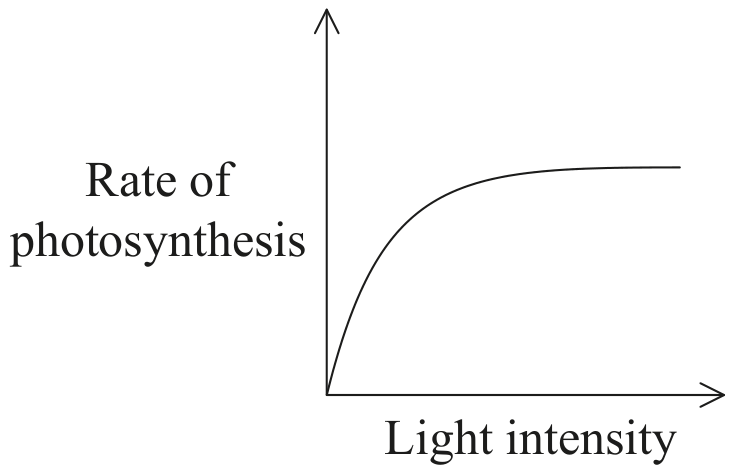
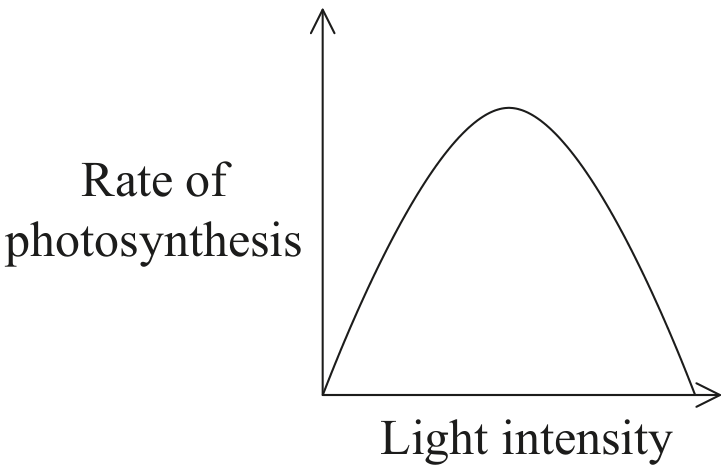
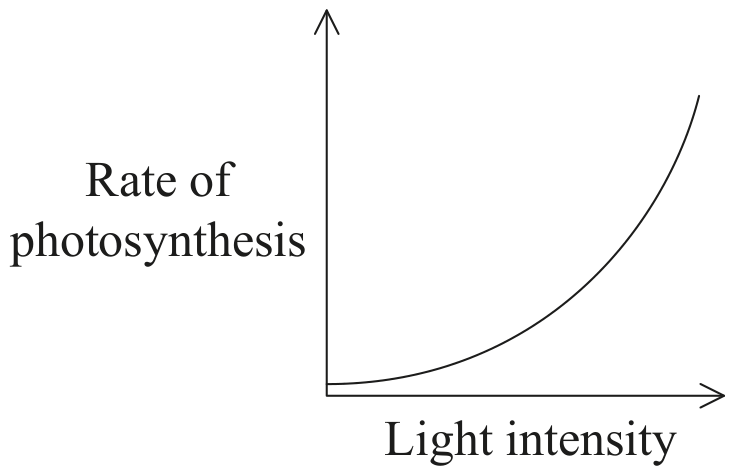
State the effect of heat treatment on the rate of photosynthesis.

[ 1 ]

Question 1(j)

(c)

Explain the evidence provided by the data in the bar chart for the hypothesis that isoprene improves plants' tolerance to high temperatures.

[ 2 ]

Question 1

[Maximum number: 6]

RfR_{\mathrm{f}} values for photosynthetic pigments may be determined using the technique of thin-layer chromatography (TLC).

Question image

Question 1(a)

(a)

Outline what happens when spinach extract is spotted on a TLC plate and placed into a container of solvent.

[ 2 ]

Question 1(b)

(b)

Explain what the RfR_{\mathrm{f}} values represent in chromatography.

[ 3 ]

Question 1(c)

(c)

State two photosynthetic pigments that could be identified using chromatography.
1.
2.

[ 1 ]

Question 1

[Maximum number: 2]

A community living in the water of an estuary was used to investigate how climate change may affect ecological systems. The food web in this community included phytoplankton (producers), zooplankton (consumers) and saprotrophic bacteria. Small plastic mesocosms were set up with water from the estuary containing only these three groups of organisms. The mesocosms were subjected to four different temperatures and two nutrient levels (control and nutrients added) to replicate local variations of the conditions in the estuary during springtime warming.

The graph shows the biomass of the community for each of the eight mesocosms at the end of the experimental period. Biomass was measured in terms of the amount of carbon present. The horizontal line indicates the initial biomass.

Question image

Question 1(c)

(a)

Chlorophyll concentration was used as an estimate of the photosynthetic capacity of the community. The rate of photosynthesis and mass of chlorophyll per unit volume were measured in a mesocosm at three different temperatures.

Question image

Explain the effect of temperature on the rate of photosynthesis in this mesocosm.

[ 2 ]

Question 7

[Maximum number: 1]

What occurs during photosynthesis?

A

Water is oxidized by releasing two electrons to NADPH.

B

Glycerate-3-phosphate (GP) is oxidized by releasing two electrons to photosystem II.

C

NAD is reduced by accepting two electrons from ATP.

D

NADP is reduced by accepting two electrons from photosystem I.

Question 7

[Maximum number: 1]

Which group(s) produce(s) oxygen as a by-product of photosynthesis?

I. Algae
II. Cyanobacteria
III. Fungi

A

I only

B

I and II only

C

II and III only

D

I, II and III

Question 7

[Maximum number: 1]

What does an action spectrum for photosynthesis show?

A

The range of conditions over which photosynthesis can occur in a plant

B

The percentage of light absorbed at each wavelength by photosynthetic pigments

C

The percentage of light absorbed at each energy level by a plant

D

The relative amount of photosynthesis at each wavelength of light

Question 3

[Maximum number: 5]

Sodium alginate beads were prepared containing a suspension of Chlorella algae. These beads were placed in nine small jars containing hydrogencarbonate indicator solution. Hydrogencarbonate indicator is commonly used to detect changes in pH .

Table

The jars were placed at different distances from a lamp, which was the only light source. The distances ranged from 40 to 130 centimetres. Jars were placed one at a time to avoid the jars from shading each other. Colour changes were observed.

Question image

Question 3(b)

(a)

The colours of the indicator in the jars ranged from yellow to purple after five hours.

[ 4 ]

Question 3(b)(i)

(i)

Predict the distribution of indicator colours in jars 1 to 9 .

[ 1 ]

Question 3(b)(ii)

(ii)

Explain the scientific reasoning for the predicted distribution of indicator colours in jars 1 to 9.

[ 3 ]

Question 3(c)

(b)

Suggest one other factor that has to be kept constant in all the jars during the experiment.

[ 1 ]

Question 8

[Maximum number: 1]

What is an advantage of free-air carbon dioxide enrichment experiments (FACE)?

A

The carbon dioxide uptake by plants is controlled.

B

Temperature can be controlled.

C

Water can be controlled.

D

Data can more accurately represent future rates of photosynthesis.

Question 8

[Maximum number: 1]

Which graph shows the effect of light intensity on the rate of photosynthesis if other factors are kept constant?

A
Question image
B
Question image
C
Question image
D
Question image

Question 8

[Maximum number: 1]

The diagram shows a chromatogram of the pigments in a leaf. Substance Z is known to have an RfR_{f} of 0.5.

Question image

Solvent front

Sample applied

Table

What are pigments X and Y ?

X

Y

Chlorophyll a

Phaeophytin

Chlorophyll a

Carotene

Chlorophyll b

Carotene

Chlorophyll b

Chlorophyll a

0 selected