EduNinja

IB Biology HLA4.2 Conservation of biodiversityQuestion Bank

Question 6

[Maximum number: 4]

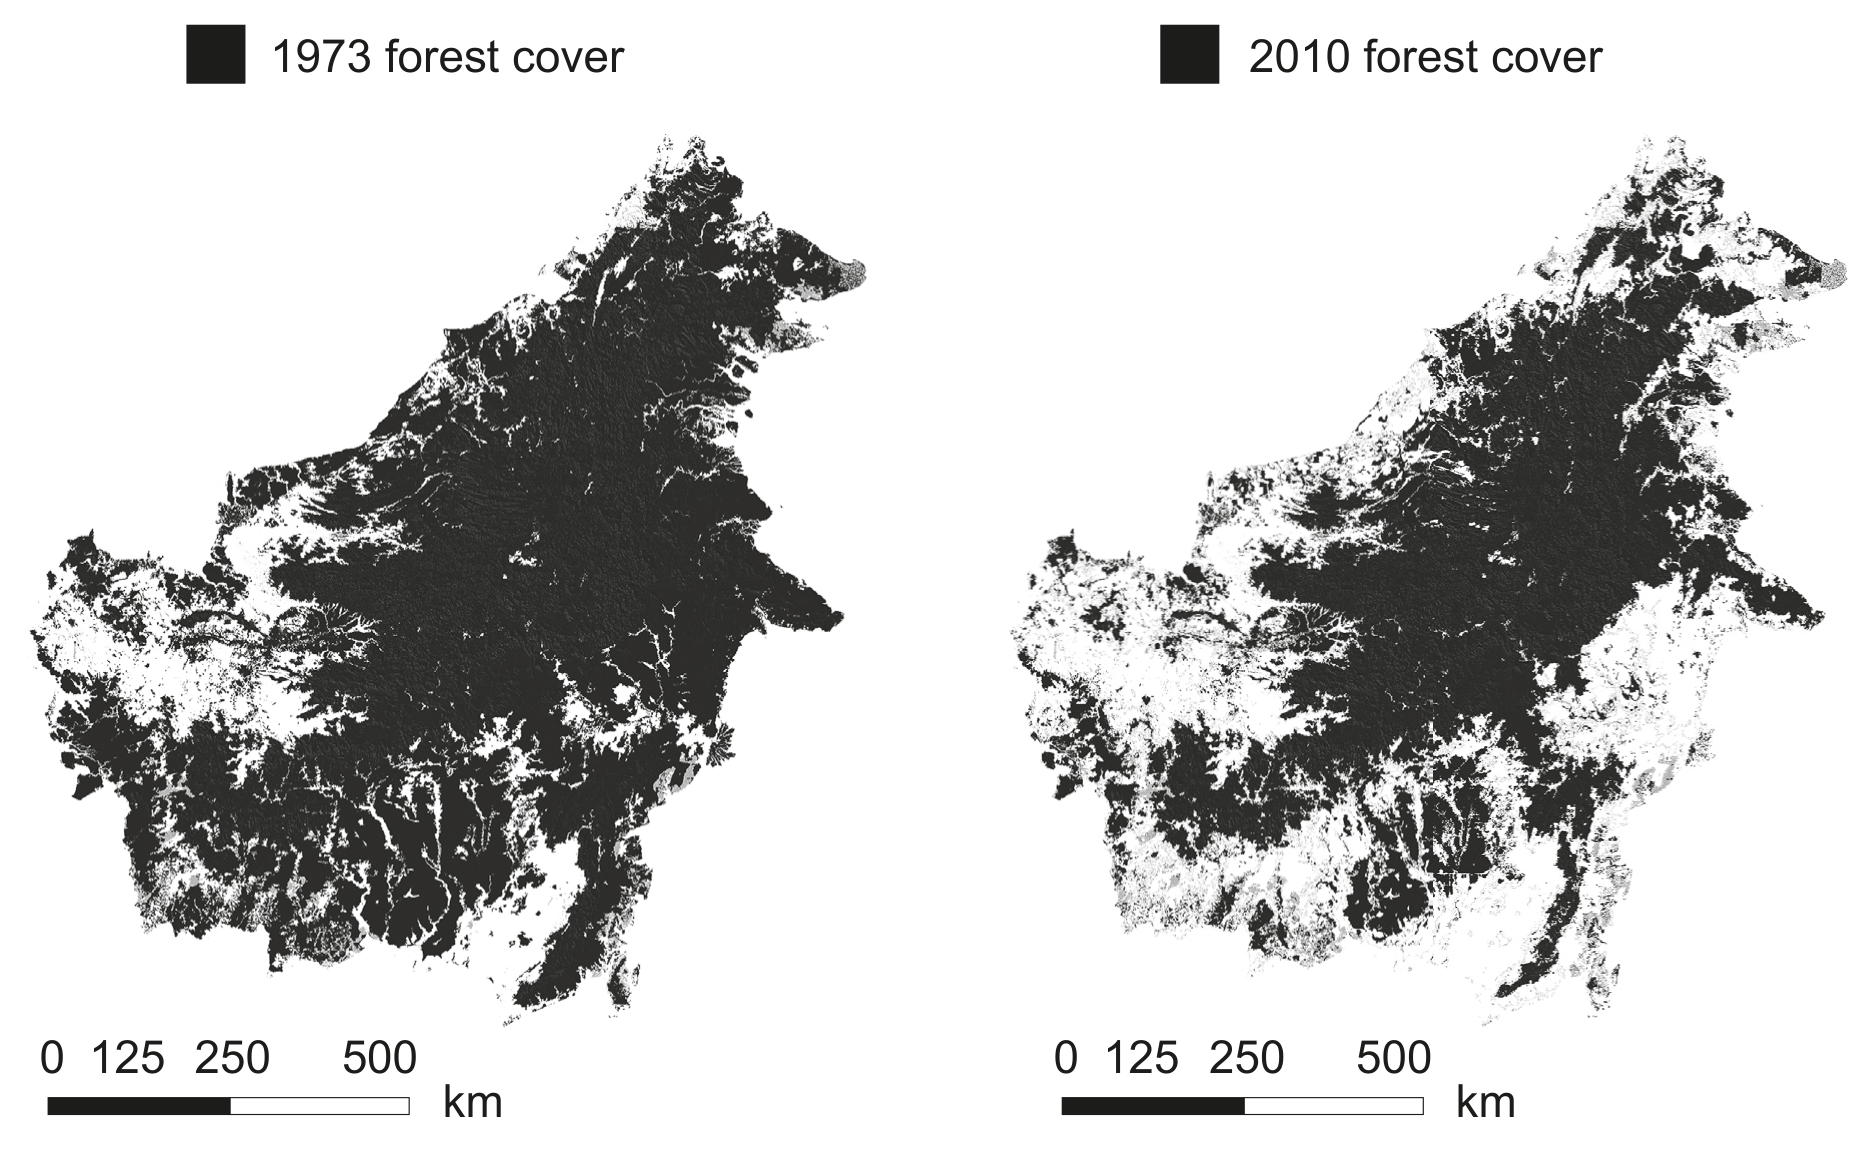
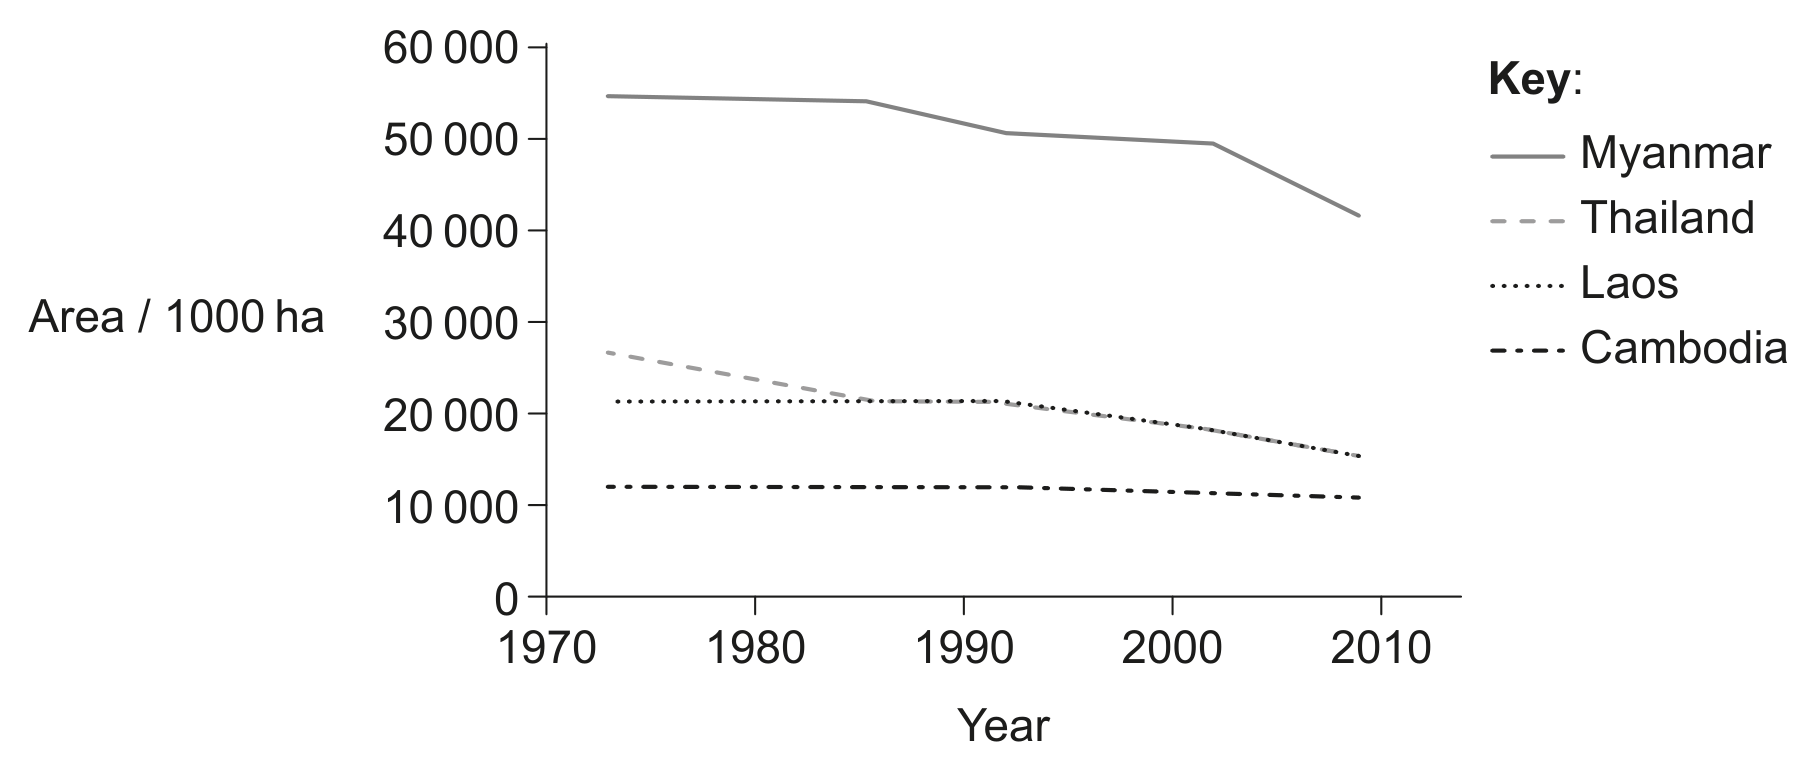
The graph shows the change in forest area in Greater Mekong countries in Southeast Asia between 1973 and 2009. This was mainly due to deforestation.

Question image

Question 6(b)

(a)

State one cause of the current biodiversity crisis, other than deforestation.

[ 1 ]

Question 6(c)

(b)

The EDGE of Existence programme measures Evolutionary Distinctness (ED) and Globally Endangered status (GE).

[ 3 ]

Question 6(c)(i)

(i)

Outline the importance of the EDGE of Existence programme.

[ 2 ]

Question 6(c)(ii)

(ii)

Outline one method of restoration of natural processes in ecosystems by rewilding.

[ 1 ]

Question 34

[Maximum number: 1]

The satellite images show changes in the area covered by forest, much of which is mixed dipterocarp forest, on the island of Borneo in Southeast Asia.

Question image

Which human activities are most likely to have caused the changes shown in the map?

A

Logging and palm oil plantation

B

Logging and rewilding

C

Mining and afforestation

D

Afforestation and palm oil plantation

Question G2

Question G2(c)

(a)

Outline the biogeographical features of nature reserves that promote the conservation of diversity.

[ 3 ]

Question 7

[Maximum number: 2]

The map shows the distribution of chimpanzees (Pan troglodytes) and bonobos (Pan paniscus) on either side of the Congo River as it flows towards the Atlantic Ocean in the Democratic Republic of Congo. Bonobos occupy the dense wet forest south of the Congo River, whereas chimpanzees occupy a forested habitat north of the river. Both species are descended from a common ancestor.

Question image

Question 7(c)

(a)

The bonobo is classified as an endangered species. Explain how deforestation could contribute to the decline in the population size of bonobos.

Answer two questions. One additional mark is available for the construction of your answers for each question. Answers must be written within the answer boxes provided.

[ 2 ]

Question 11

Question 11(a)

Question 11(a)(i)

(a)
(i)

Calculate the Simpson diversity index from the data given for one community, using the formula provided. Show your working.

The formula is D=N(N1)Σn(n1)D=\frac{N(N-1)}{\Sigma n(n-1)}

Table
[ 2 ]

Question 11(a)(ii)

(ii)

The same area was sampled the previous year and found to have a value for D=4.3. Analyse the biodiversity of this community.

[ 2 ]

Question 11(c)

(b)

Discuss in situ conservation of endangered species.

[ 2 ]

Question G1

[Maximum number: 2]

Knowledge of deep-water fish is important for fisheries and marine reserve management. Scientists analysed data from scientific trawls made from 1977 to 1989 (early period) and from 1997 to 2002 (late period). These were at depths from 800 m to 4800 m in the Porcupine Seabight and Porcupine Abyssal Plain area southwest of Ireland. The graphs represent the abundance of fish and the number of species for each of these trawls.

Question image

Question G1(c)

(a)

Discuss the evidence in these data for a decline in the biodiversity of fish between the early period and the late period.

[ 2 ]

Question G3

[Maximum number: 6]

Discuss how international efforts can contribute to the conservation of fish stocks.

Question G3

[Maximum number: 6]

Discuss the advantages of in situ conservation of endangered species, using examples.

Question 11

Question 11(a)

(a)

Distinguish between in situ and ex situ conservation.

[ 1 ]

Question 11(e)

(b)

State one use of the Simpson index in ecology.

[ 1 ]

Question 11

Question 11(d)

(a)

Discuss the advantages in situ conservation has over ex situ conservation.

[ 3 ]
0 selected