
A-Level Edexcel Biology A2 Rates from Linear Graphs

A-Level Edexcel Biology A2 Rates from Linear Graphs
Pearson Edexcel International Advanced Subsidiary/Advanced Level in Biology, Issue 2, February 2021Biology XBI11/YBI11

Review A-Level Edexcel Biology rates from linear graphs through the available evidence on calculating mean change over time with rate units.

How this is tested

  • calculate mean rate of change from linear graph intervals with suitable units

Question 4(a)(i)

[Maximum number: 1]

Glaciers are decreasing in height and retreating due to global warming. The diagram shows a retreating glacier.
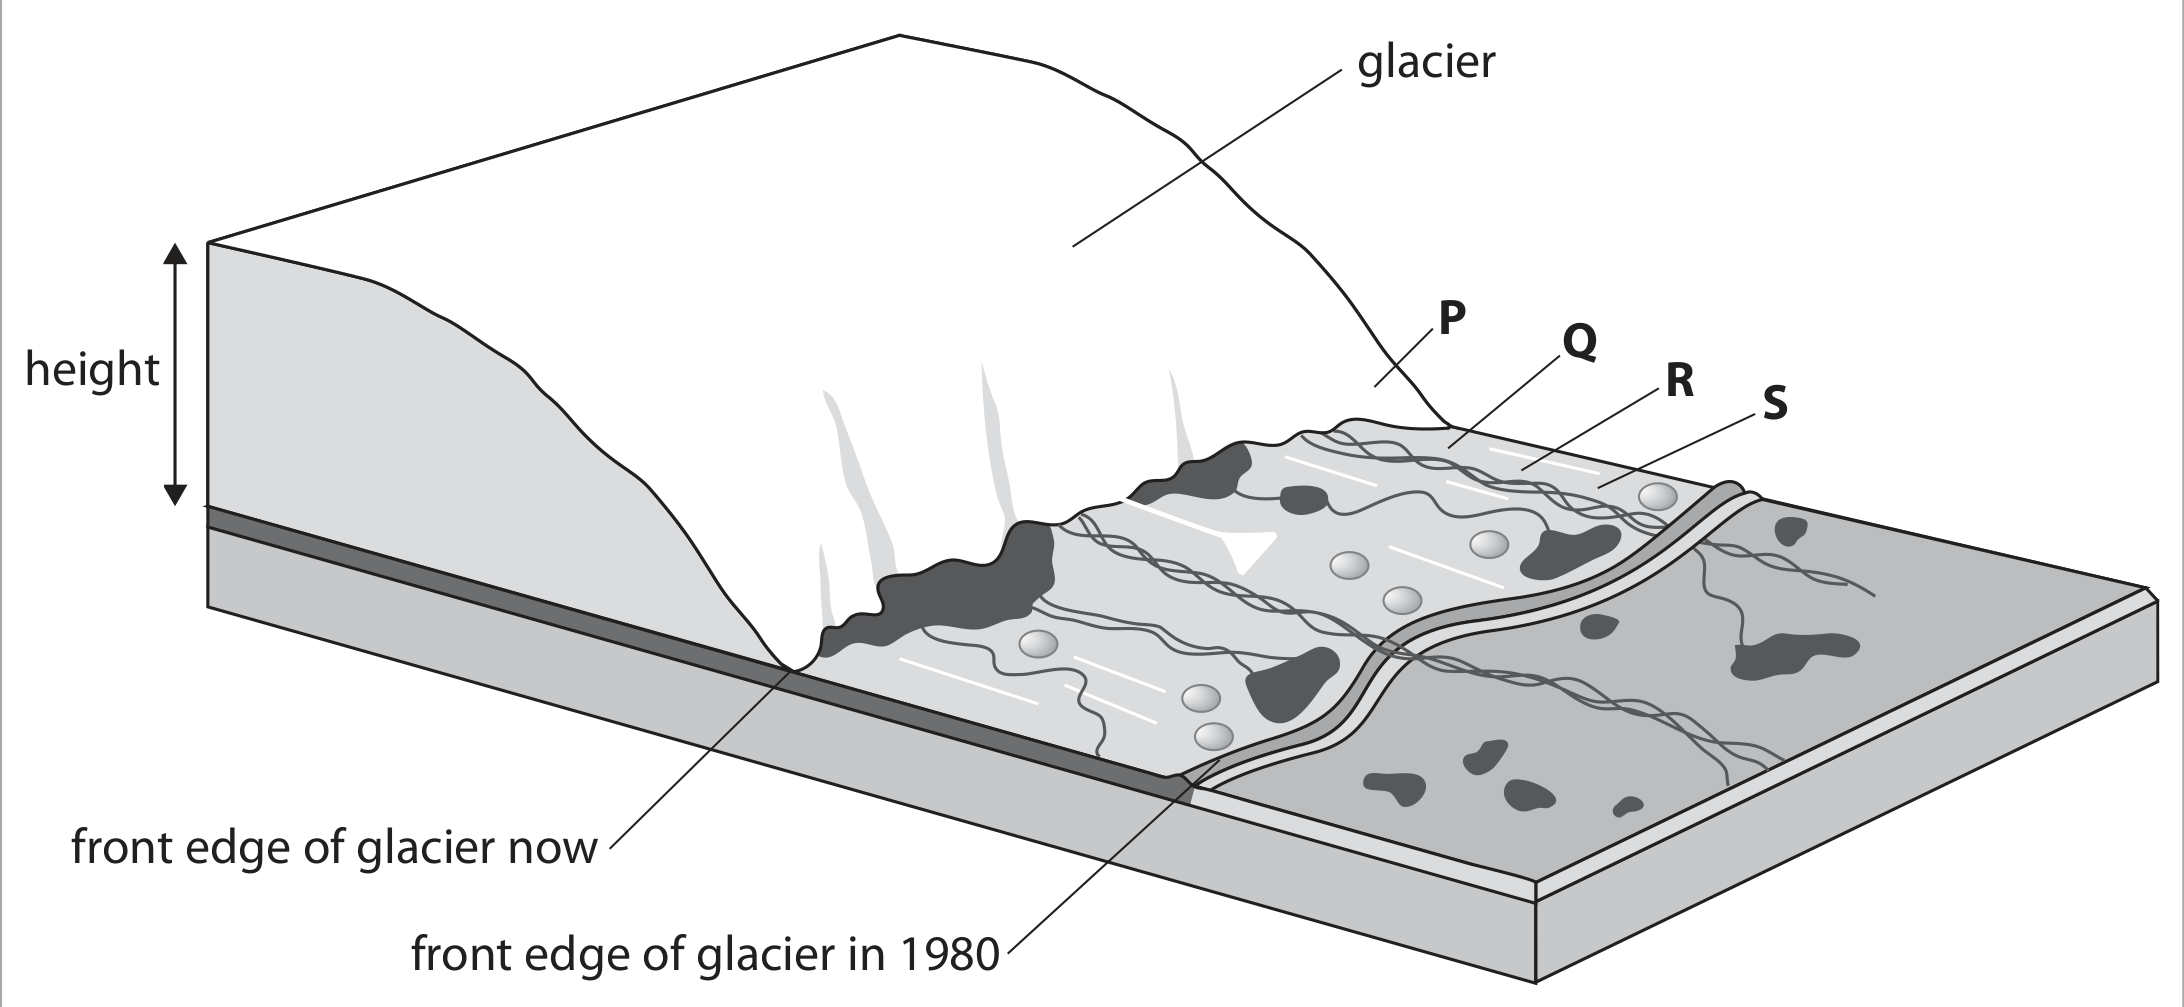
Figure for Question 4(a)(i) — Edexcel A-Level Biology A2

The graph shows the decrease in height of a glacier from 1980 to 2000.
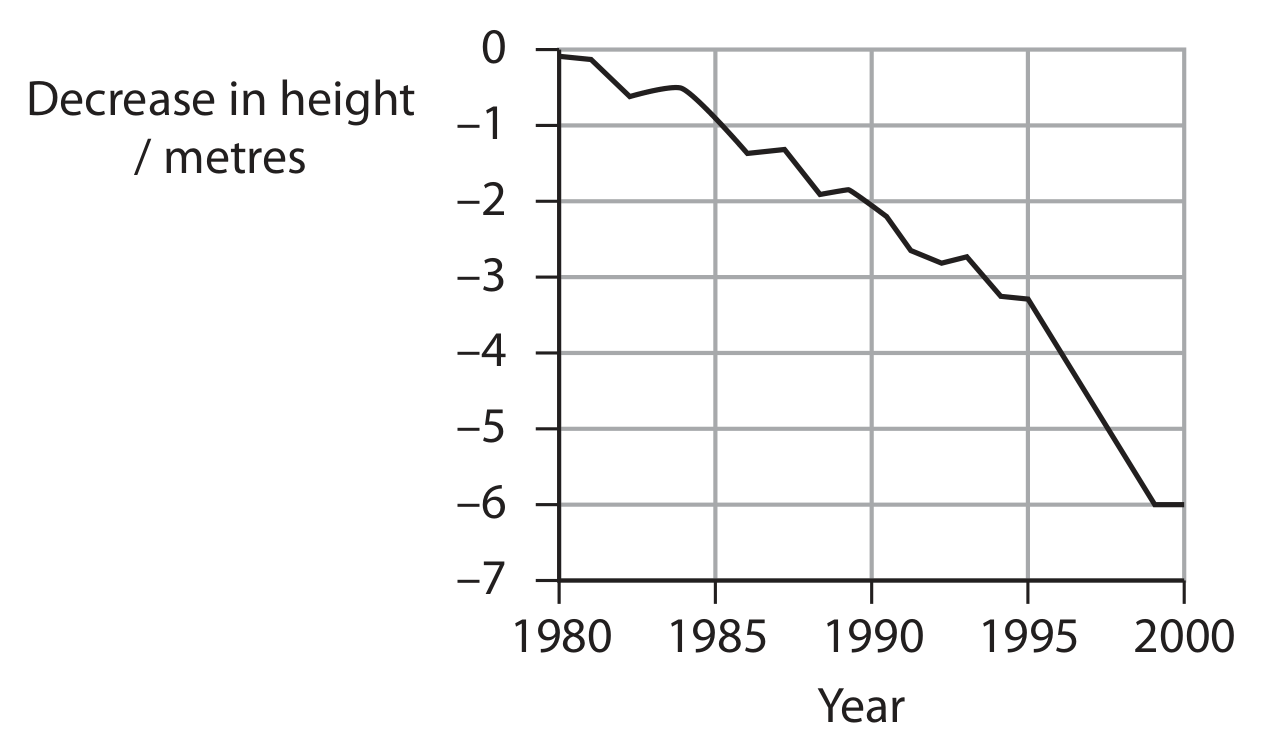
Figure for Question 4(a)(i) — Edexcel A-Level Biology A2

Calculate the mean drop in height from 1980 to 2000. Give suitable units for your answer.