
A-Level Edexcel Biology A2 Graph Intercepts

A-Level Edexcel Biology A2 Graph Intercepts
Pearson Edexcel International Advanced Subsidiary/Advanced Level in Biology, Issue 2, February 2021Biology XBI11/YBI11

Review A-Level Edexcel Biology graph intercepts through the available evidence on why a biological calibration line may not start at the origin.

How this is tested

  • explain graph intercepts or non-origin starts using test sensitivity and colour thresholds

Question 3(b)(ii)

[Maximum number: 1]

Sucrose is a disaccharide made from glucose and fructose.
Glucose is joined to fructose by a 1-2 glycosidic bond.

The concentration of sucrose in a solution can be determined by a test.

The chart shows the steps involved in this test.
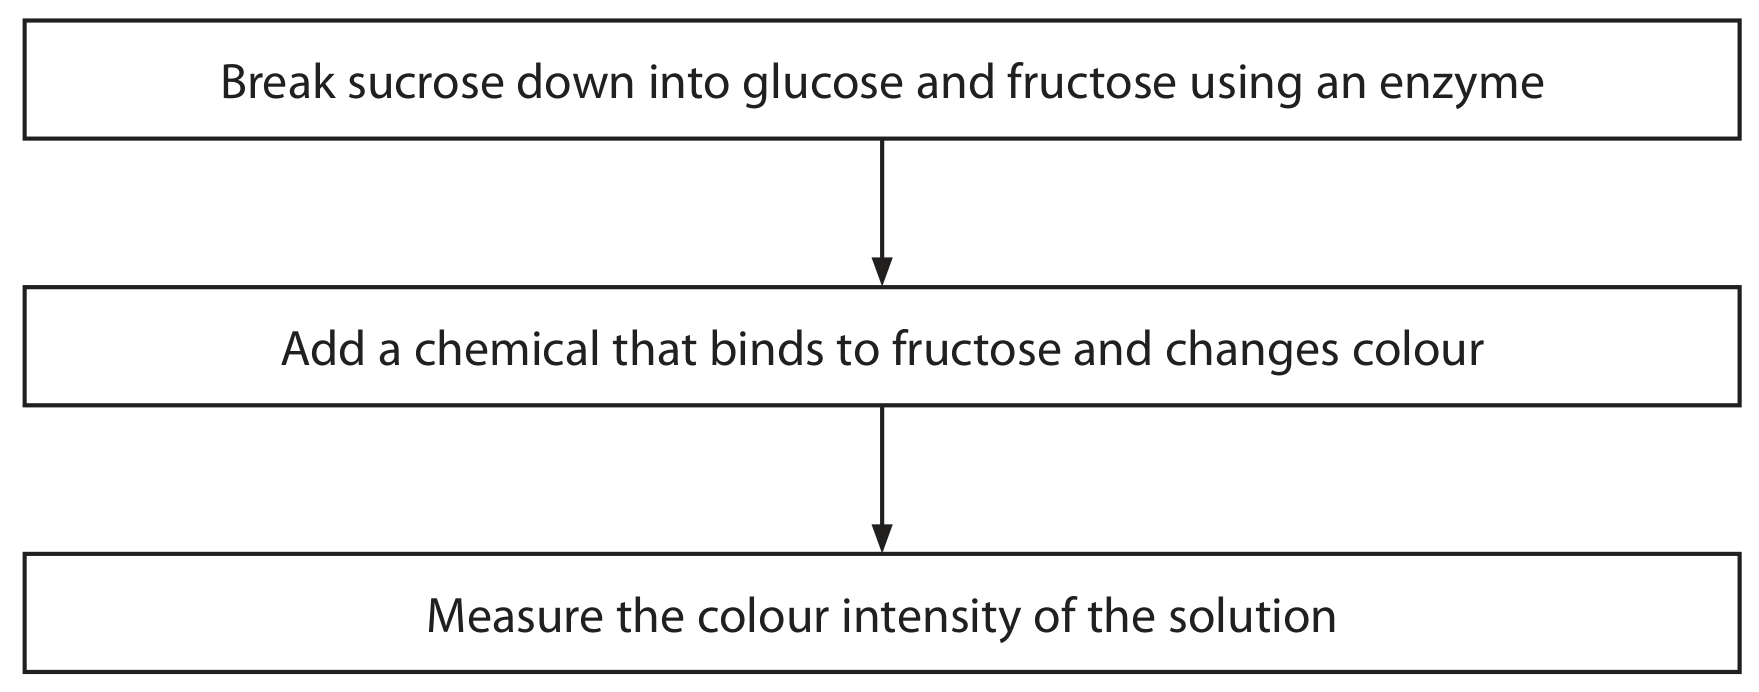
Figure for Question 3(b)(ii) — Edexcel A-Level Biology A2

The colour intensity is directly proportional to the concentration of sucrose. The graph shows this relationship.

Colour intensity / a.u.
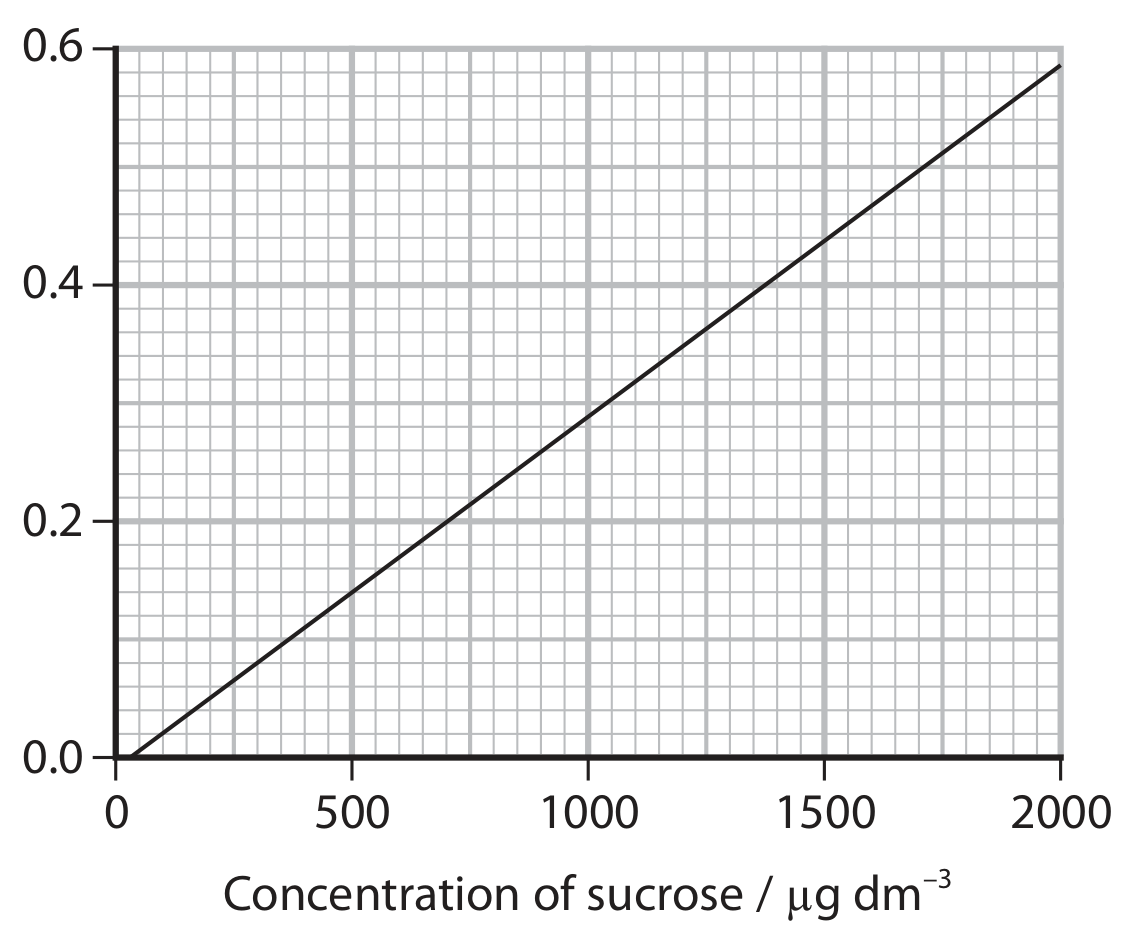
Figure for Question 3(b)(ii) — Edexcel A-Level Biology A2

Suggest why the line does not start at the origin of the graph.