
A-Level Edexcel Biology A2 Scatter Diagrams and Correlation

A-Level Edexcel Biology A2 Scatter Diagrams and Correlation
Pearson Edexcel International Advanced Subsidiary/Advanced Level in Biology, Issue 2, February 2021Biology XBI11/YBI11

Review A-Level Edexcel Biology scatter diagrams and correlation through graph sketches, table comments and cautious interpretation of biological relationships.

How this is tested

  • sketch correlation graphs with correct axes and slope for biological relationships
  • comment on positive, weak or absent correlations without claiming causal links
  • suggest biological or environmental reasons when table variables show no correlation

Question 5(c)(i)

[Maximum number: 2]

Mycobacterium tuberculosis (Mtb) and human immunodeficiency virus (HIV) are two pathogens that infect people. When people infected with either pathogen become infected with the other pathogen the disease is worse.

The graph shows the number of people who have TB and the percentage of the population who have HIV. Each plotted point represents data from a different country. Number of people who have TB per 100000 population
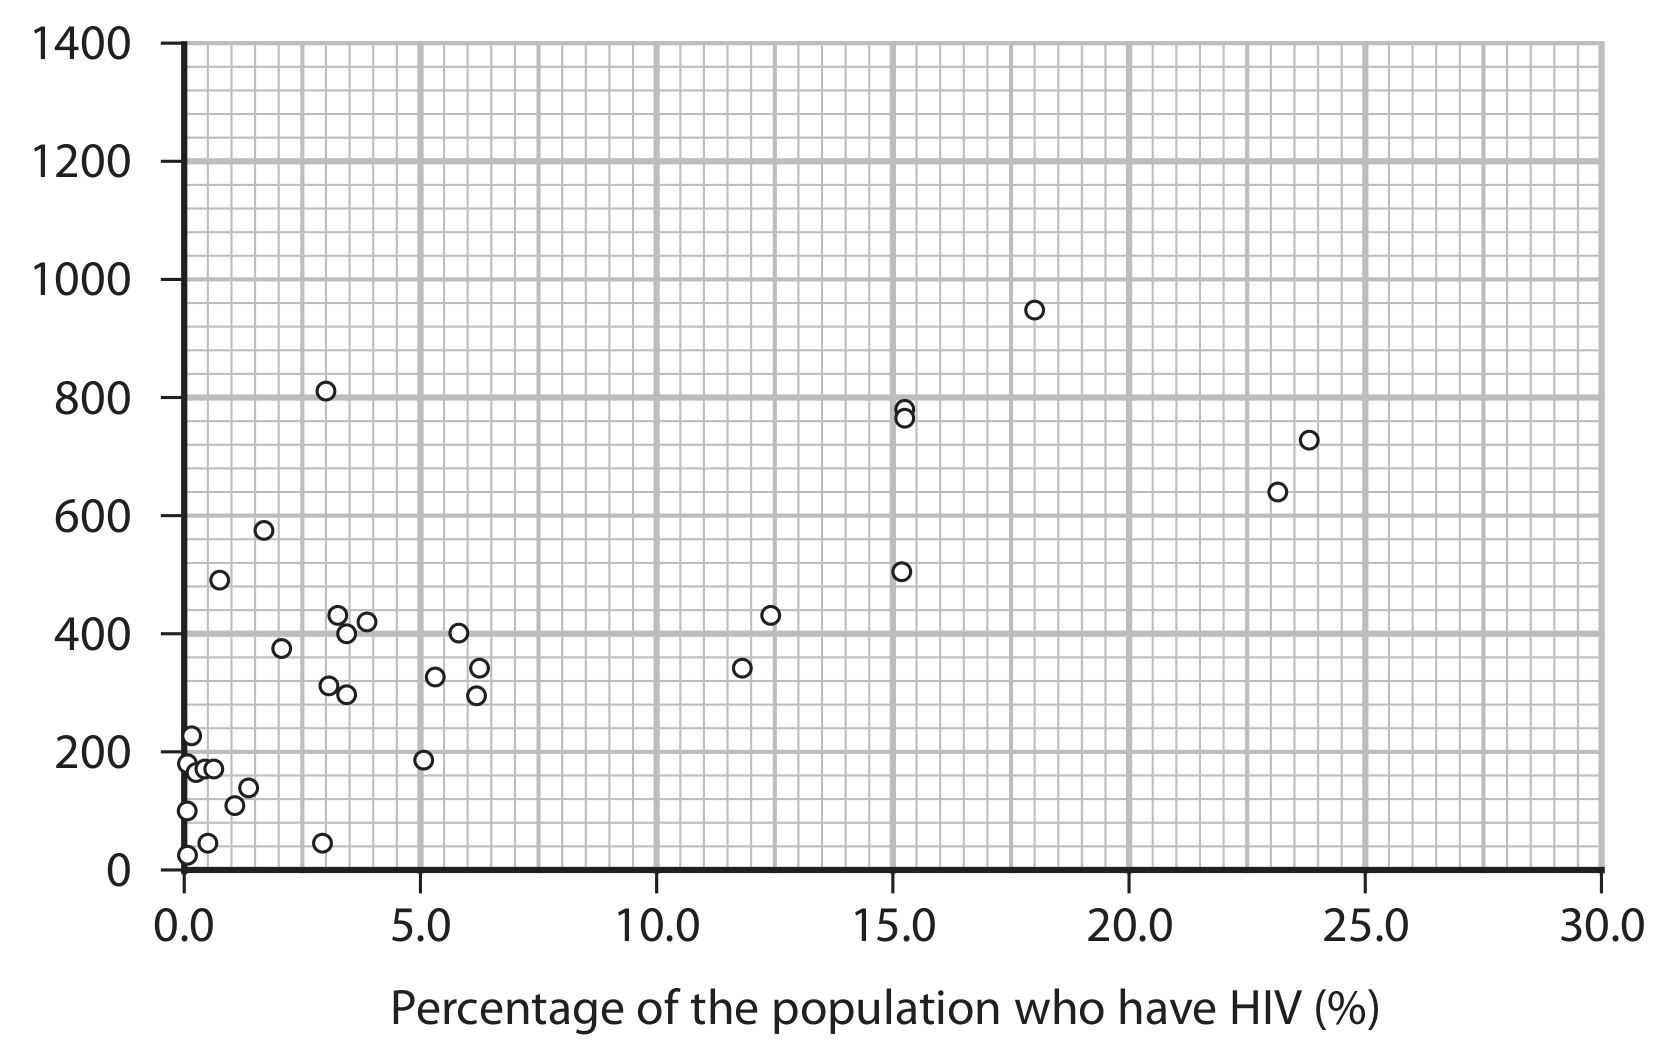
Figure for Question 5(c)(i) — Edexcel A-Level Biology A2

Comment on the relationship between the number of people who have TB and the percentage of people who have HIV.