
A-Level Edexcel Biology A2 Tables and Charts

A-Level Edexcel Biology A2 Tables and Charts
Pearson Edexcel International Advanced Subsidiary/Advanced Level in Biology, Issue 2, February 2021Biology XBI11/YBI11

Review A-Level Edexcel Biology tables, diagrams and charts through interpreting biological relationships, trends, conclusions and supporting data.

How this is tested

  • describe biological relationships from tables or graphs using trend and correlation language
  • support conclusions with table values such as pigment, heart-rate or food-composition data
  • interpret charts or diagrams to classify stages, body-fat levels or percentage composition

Question 4(c)

[Maximum number: 4]

Water is an important molecule in living organisms.

Temperature affects the solubility of chemicals in water. The graph shows the effect of temperature on the solubility of four chemicals, A, B, C and D.
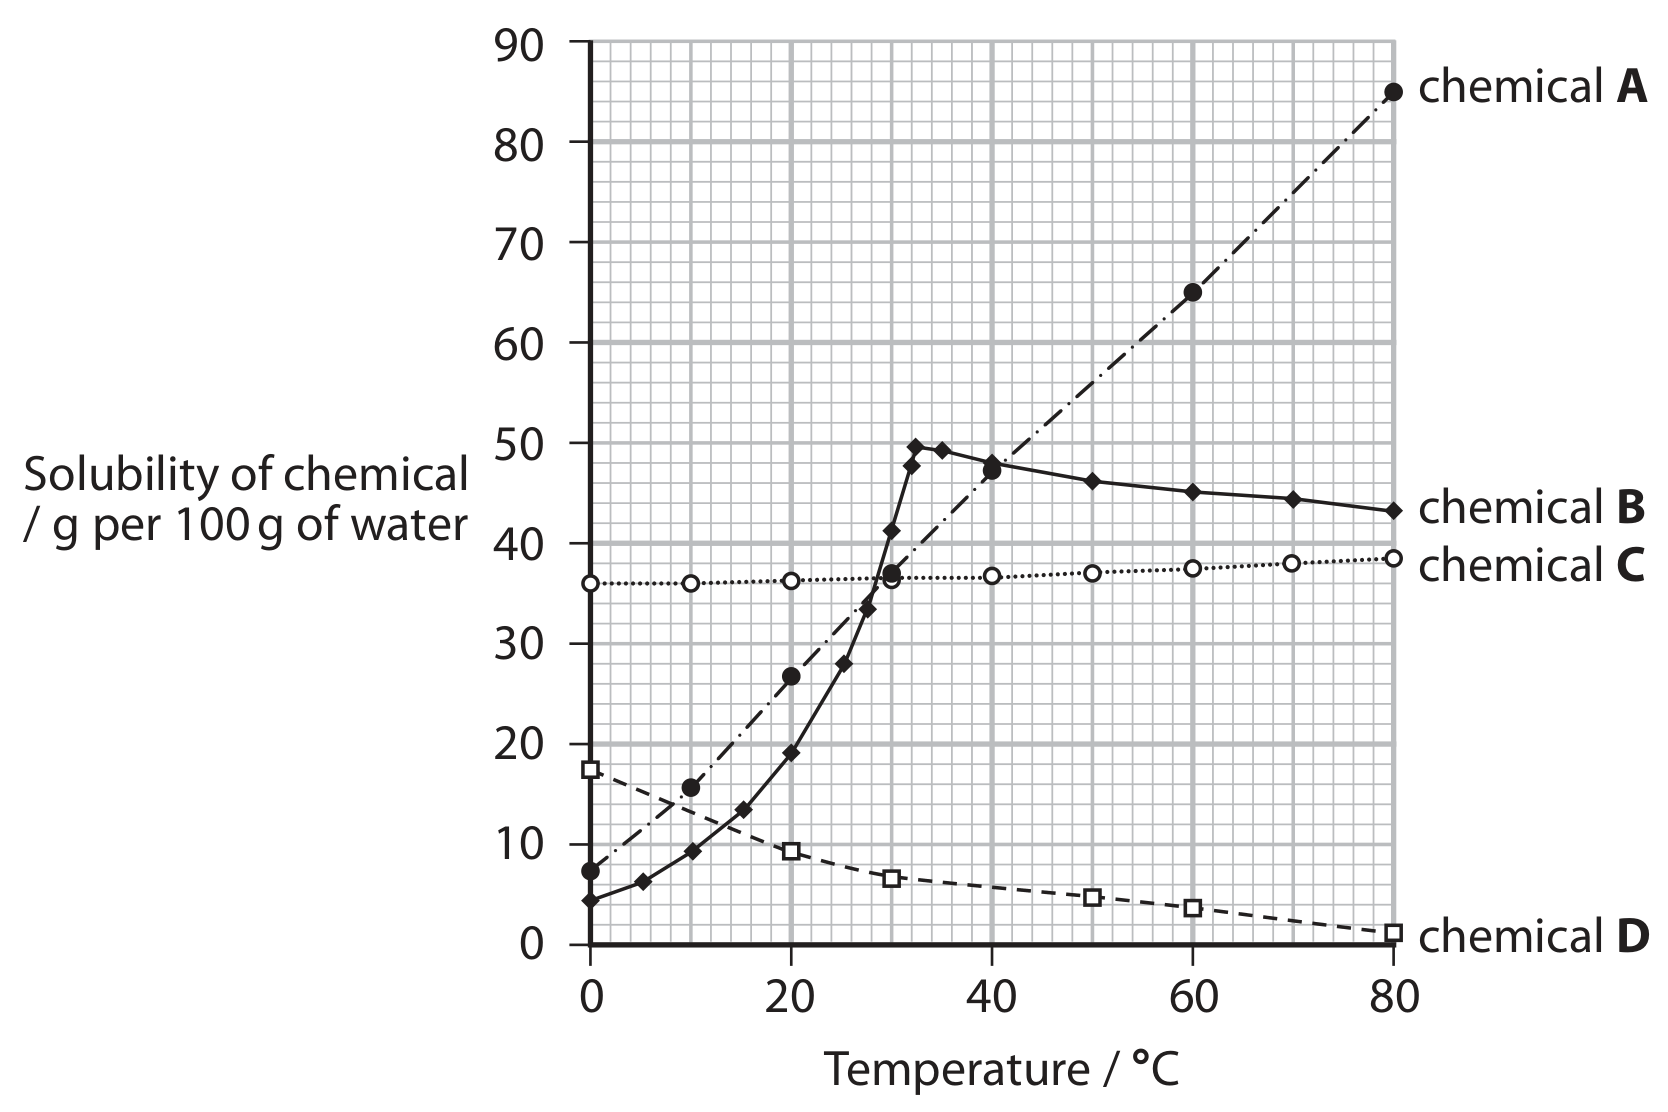
Figure for Question 4(c) — Edexcel A-Level Biology A2

Describe the effects of temperature on the solubility of these chemicals.