CAIE A-Level Mathematics 5.1 Representation of data Question Bank

CAIE A-Level Mathematics 5.1 Representation of data Question Bank
Cambridge International AS & A Level Mathematics 9709 syllabus for exams in 2028, 2029 and 20302028–2030

Practise representing data from Paper 5 using diagrams, summary statistics and graph readings for grouped and raw data sets.

Exam points

  • draw stem-and-leaf, box-and-whisker and cumulative frequency diagrams on suitable scales
  • read medians, quartiles and IQR from ordered data, plots or cumulative frequency graphs
  • calculate combined means and standard deviations from totals

Question 3

[Maximum number: 8]

The back-to-back stem-and-leaf diagram shows the annual salaries, in dollars, of 27 employees at each of two companies, Browns and Greens.
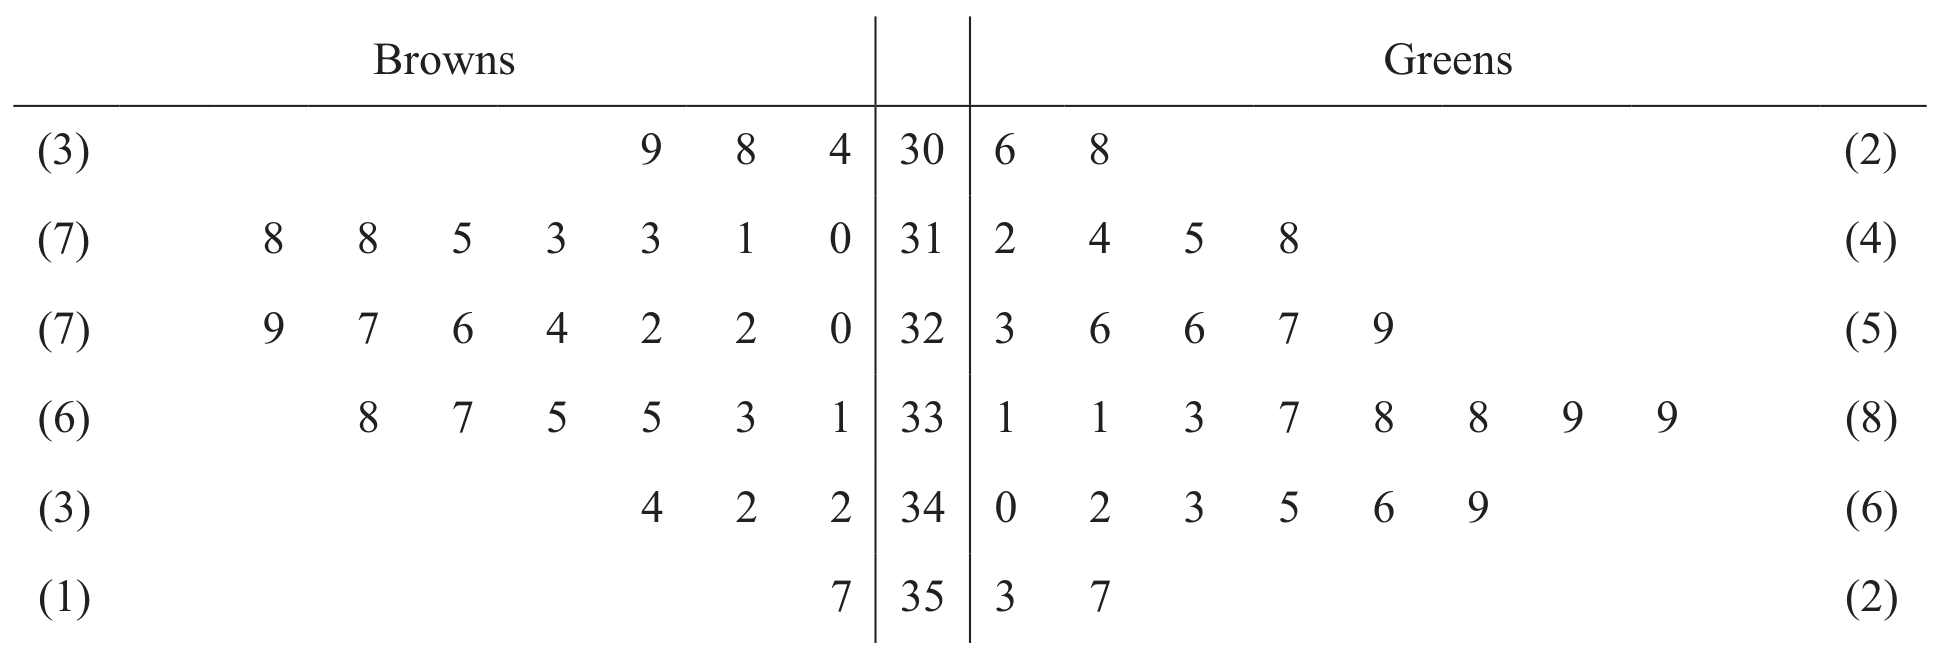
Table for Question 3 — CAIE A-Level Mathematics

Key: 6|32| 7 means $ 32600 for Browns and $ 32700 for Greens.

Question 3(a)

(a)

Find the median and interquartile range for the annual salaries of employees at Browns.

[ 3 ]

Question 3(b)

(b)

The annual salary of an employee at Browns is denoted by x thousand dollars and the annual salary of an employee at Greens is denoted by y thousand dollars. It is given that, for the 27 employees at each of the companies, sum x=878.3, sum x^2=28616.09, sum y=896.5, sum y^2=29815.63. Find the mean and standard deviation of the annual salaries of these 54 employees.

[ 5 ]

Question 4

[Maximum number: 11]

The heights, in cm, of 15 players from each of two sports teams, Pelicans and Swans, are given in the table.

Table for Question 4 — CAIE A-Level Mathematics

Question 4(a)

(a)

Draw a back-to-back stem-and-leaf diagram to represent the heights of the players from Pelicans and Swans, with Pelicans on the left-hand side.

[ 4 ]

Question 4(b)

(b)

Find the median and the interquartile range of the heights of the Pelicans.

For the Swans, the lower quartile of the heights is 165 cm , the median is 174 cm and the upper quartile is 181 cm .

[ 3 ]

Question 4(c)

(c)

Represent the data shown in the back-to-back stem-and-leaf diagram by a pair of box-and-whisker plots in a single diagram.

Figure for Question 4(c) — CAIE A-Level Mathematics
[ 3 ]

Question 4(d)

(d)

Make one comparison between the heights of the Pelicans players and the heights of the Swans players.

[ 1 ]

Question 4

[Maximum number: 5]

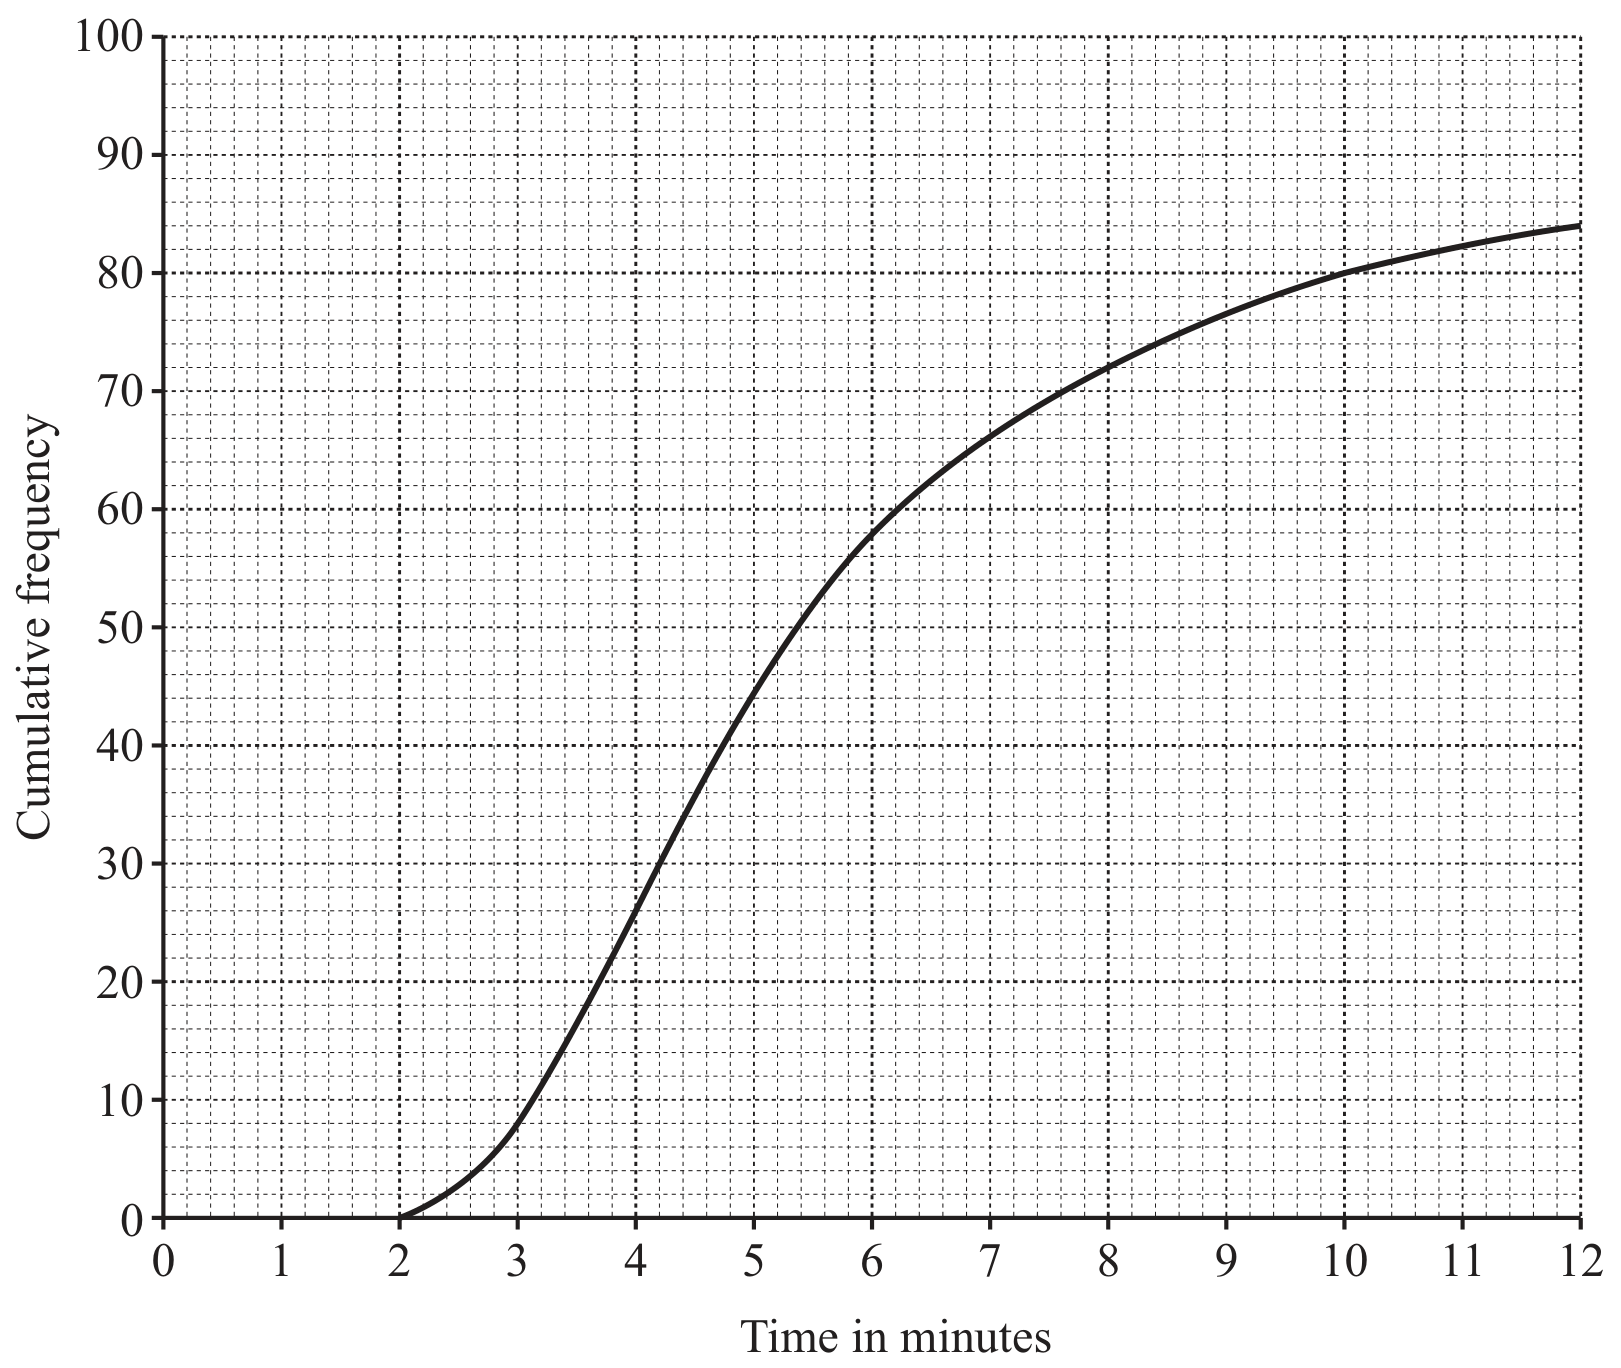
84 people attempt a particular puzzle. The times taken, in minutes, to complete the puzzle are recorded. These times are represented in the cumulative frequency graph below.

Figure for Question 4 — CAIE A-Level Mathematics

Question 4(a)

(a)

Use the graph to estimate how many people took between 4 and 7.5 minutes to complete the puzzle.

[ 1 ]

Question 4(b)

(b)

On the grid below, draw a box-and-whisker plot to summarise the information in the cumulative frequency graph.

Figure for Question 4(b) — CAIE A-Level Mathematics
[ 4 ]

Question 6

[Maximum number: 10]

Last Saturday, a cycling competition for teams of 11 cyclists took place. For each cyclist, the time taken to complete the course was recorded to the nearest minute. The times taken by the cyclists from two teams, the Linnets and the Puffins, are shown in the following table.

Table for Question 6 — CAIE A-Level Mathematics

Question 6(a)

(a)

Draw a back-to-back stem-and-leaf diagram to represent this information, with Linnets on the left-hand side.

[ 4 ]

Question 6(b)

(b)

Find the interquartile range of the times taken by the Linnets.

[ 2 ]

Question 6(c)

(c)

On the grid below, draw a box-and-whisker plot to represent the information for the Linnets and the Puffins.

Figure for Question 6(c) — CAIE A-Level Mathematics
[ 3 ]

Question 6(d)

(d)

Make one comparison between the times taken by the Linnets and the times taken by the Puffins.

[ 1 ]

Question 7

[Maximum number: 10]

The heights, in cm, of the 11 basketball players in each of two clubs, the Amazons and the Giants, are shown below.

Table for Question 7 — CAIE A-Level Mathematics

Question 7(a)

(a)

State an advantage of using a stem-and-leaf diagram compared to a box-and-whisker plot to illustrate this information.

[ 1 ]

Question 7(b)

(b)

Represent the data by drawing a back-to-back stem-and-leaf diagram with Amazons on the left-hand side of the diagram.

[ 4 ]

Question 7(c)

(c)

Find the interquartile range of the heights of the players in the Amazons.

Four new players join the Amazons. The mean height of the 15 players in the Amazons is now 191.2 cm . The heights of three of the new players are 180 cm,185 cm180 \mathrm{~cm}, 185 \mathrm{~cm} and 190 cm .

[ 2 ]

Question 7(d)

(d)

Find the height of the fourth new player.

[ 3 ]