CAIE A-Level Mathematics 5.1.4 Cumulative Frequency Graphs

CAIE A-Level Mathematics 5.1.4 Cumulative Frequency Graphs
Cambridge International AS & A Level Mathematics 9709 syllabus for exams in 2028, 2029 and 20302028–2030

Practise reading cumulative-frequency graphs to estimate medians, quartiles, percentiles and numbers above or below a value by converting each request into a cumulative rank.

How this is tested

  • convert a median, quartile or percentile request into the corresponding cumulative frequency
  • read the data value from the curve at a target rank using consistent horizontal and vertical guides
  • subtract cumulative readings from the total or from each other to estimate interval frequencies

Question 4(a)

[Maximum number: 1]

84 people attempt a particular puzzle. The times taken, in minutes, to complete the puzzle are recorded. These times are represented in the cumulative frequency graph below.
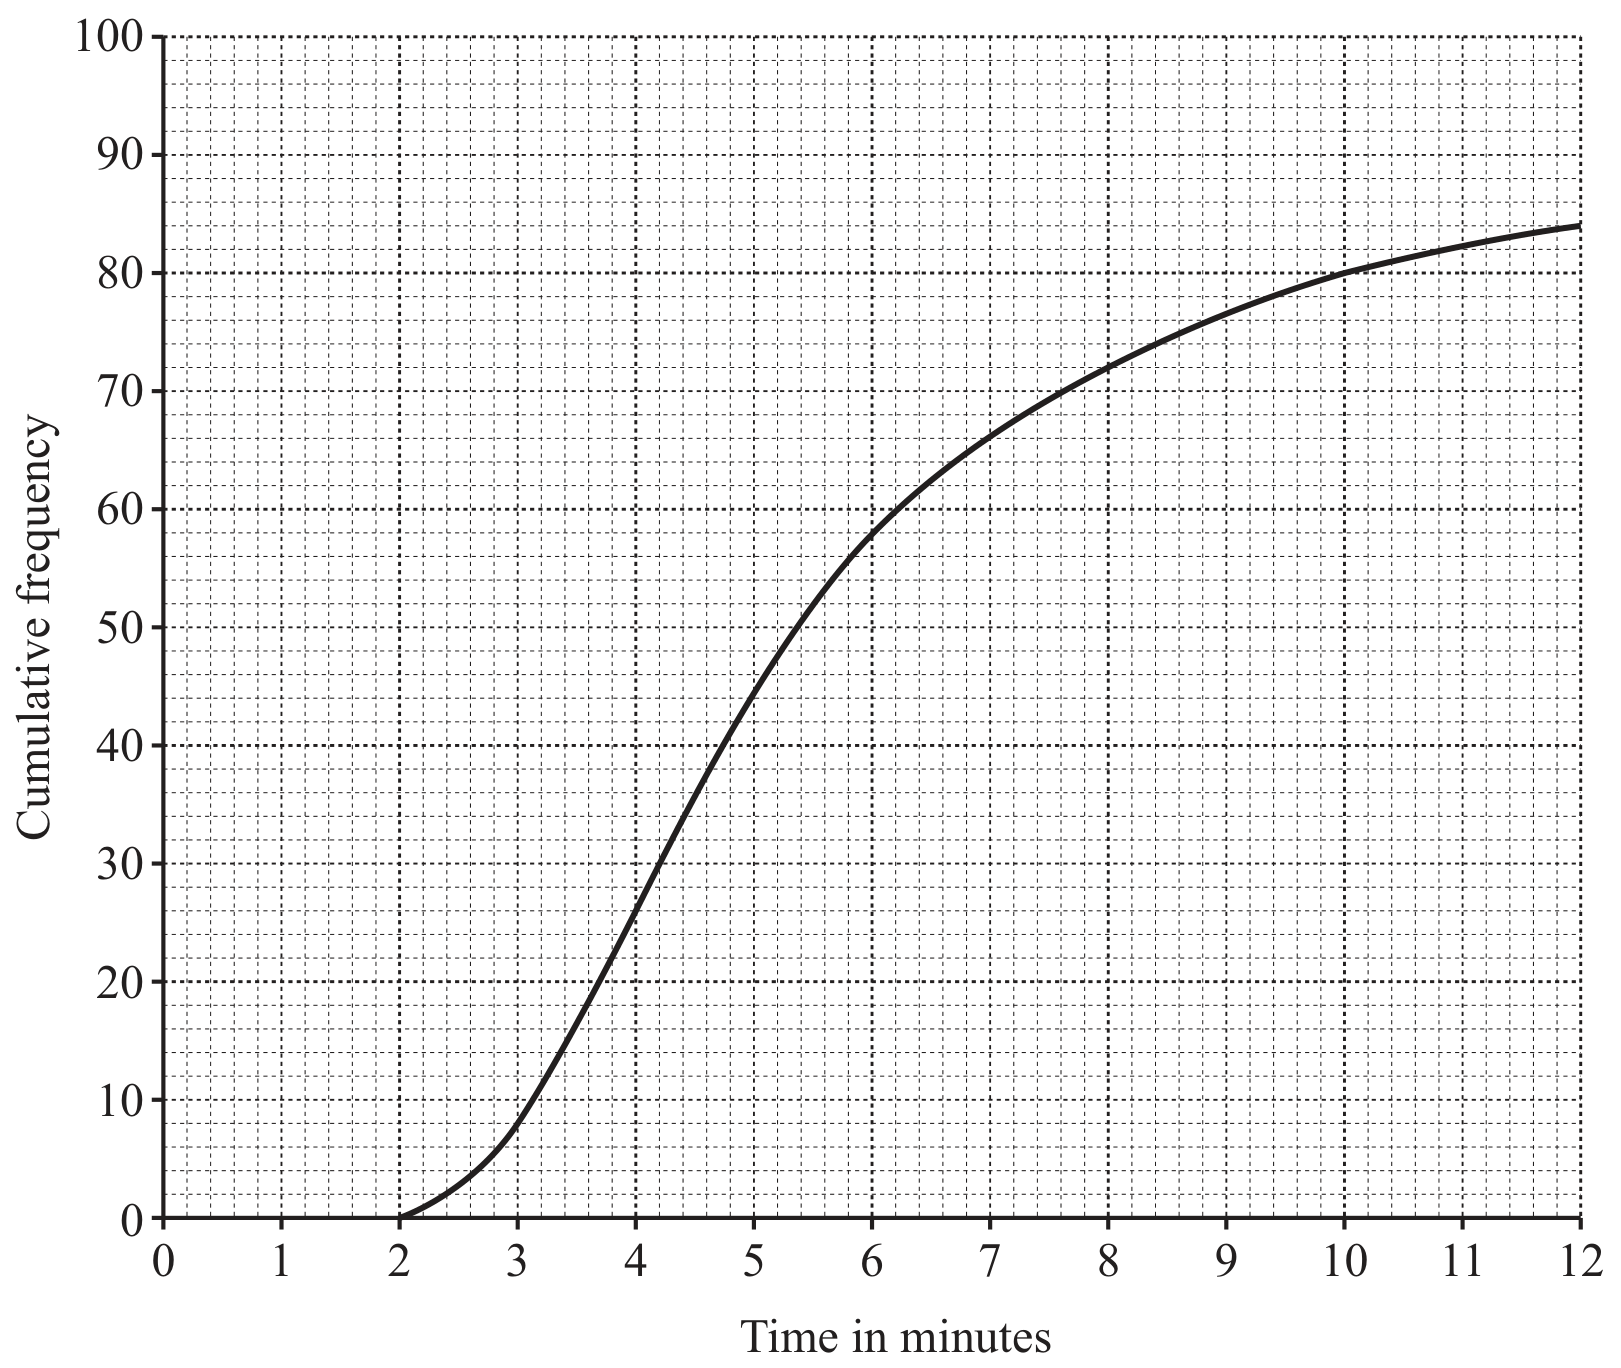
Figure for Question 4(a) — CAIE A-Level Mathematics

Use the graph to estimate how many people took between 4 and 7.5 minutes to complete the puzzle.