CAIE A-Level Mathematics 5.1.5 Mean and Standard Deviation

CAIE A-Level Mathematics 5.1.5 Mean and Standard Deviation
Cambridge International AS & A Level Mathematics 9709 syllabus for exams in 2028, 2029 and 20302028–2030

Practise calculating mean and standard deviation from raw, grouped, coded or combined data, using frequency midpoints and supplied sums while preserving sufficient accuracy.

How this is tested

  • use class midpoints with frequencies to estimate the mean and standard deviation for grouped data
  • substitute supplied sums into the variance formula before taking the non-negative square root
  • combine or decode sample totals before calculating statistics for the full transformed data set

Question 3(b)

[Maximum number: 5]

The back-to-back stem-and-leaf diagram shows the annual salaries, in dollars, of 27 employees at each of two companies, Browns and Greens.
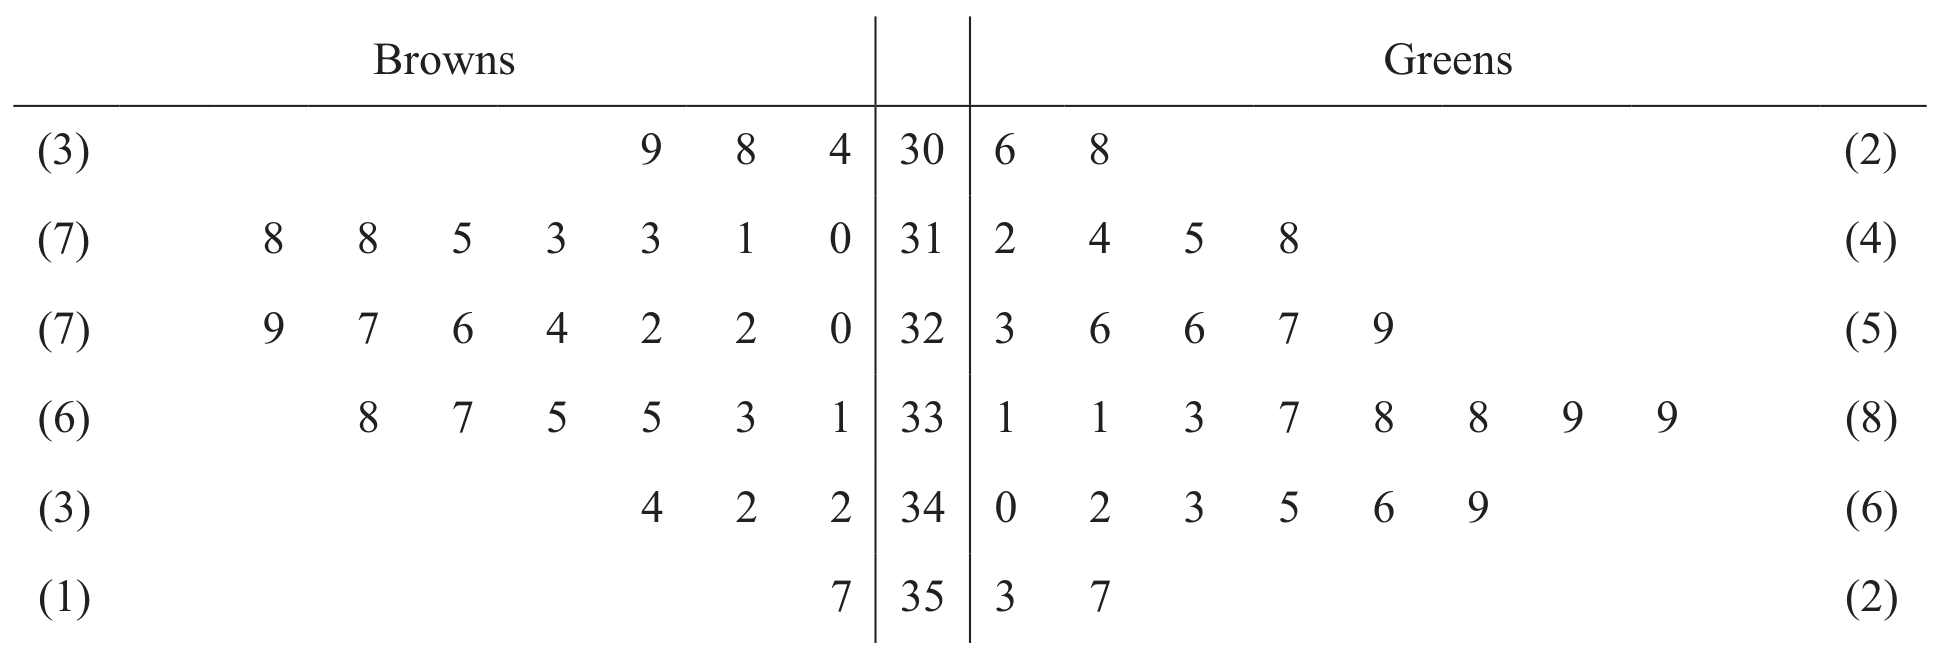
Table for Question 3(b) — CAIE A-Level Mathematics

Key: 6|32| 7 means $ 32600 for Browns and $ 32700 for Greens.

The annual salary of an employee at Browns is denoted by x thousand dollars and the annual salary of an employee at Greens is denoted by y thousand dollars. It is given that, for the 27 employees at each of the companies, sum x=878.3, sum x^2=28616.09, sum y=896.5, sum y^2=29815.63. Find the mean and standard deviation of the annual salaries of these 54 employees.