[Maximum number: 16]
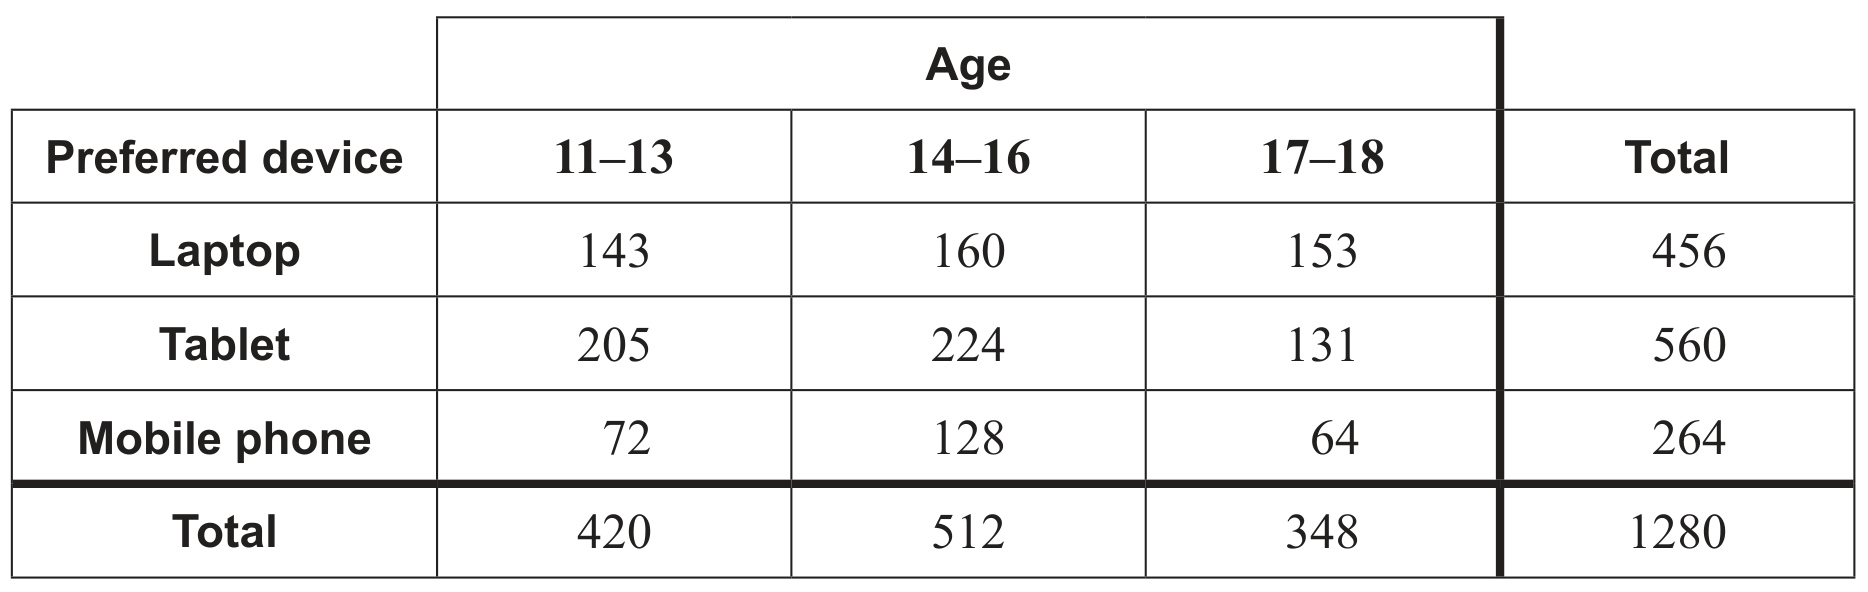
A group of 1280 students were asked which electronic device they preferred. The results per age group are given in the following table.
(a)
A student from the group is chosen at random. Calculate the probability that the student
[ 9 ]
(i)
prefers a tablet.
(ii)
is 11-13 years old and prefers a mobile phone.
(iii)
prefers a laptop given that they are 17-18 years old.
(iv)
prefers a tablet or is 14-16 years old.
A test for independence was performed on the collected data at the 1 % significance level. The critical value for the test is 13.277 .
[ 9 ]
(b)
State the null and alternative hypotheses.
[ 1 ]
(c)
Write down the number of degrees of freedom.
[ 1 ]
(d)
(i)
Write down the test statistic.
(ii)
Write down the p-value.
(iii)
State the conclusion for the test in context. Give a reason for your answer.
[ 5 ]