EduNinja
IB Maths AI SL/Question Bank/IB Mathematics: Applications and Interpretation

IB Maths AI SLIB Mathematics: Applications and InterpretationQuestion Bank

SL334 questions10 previewsSyllabus linked
[Maximum number: 18]

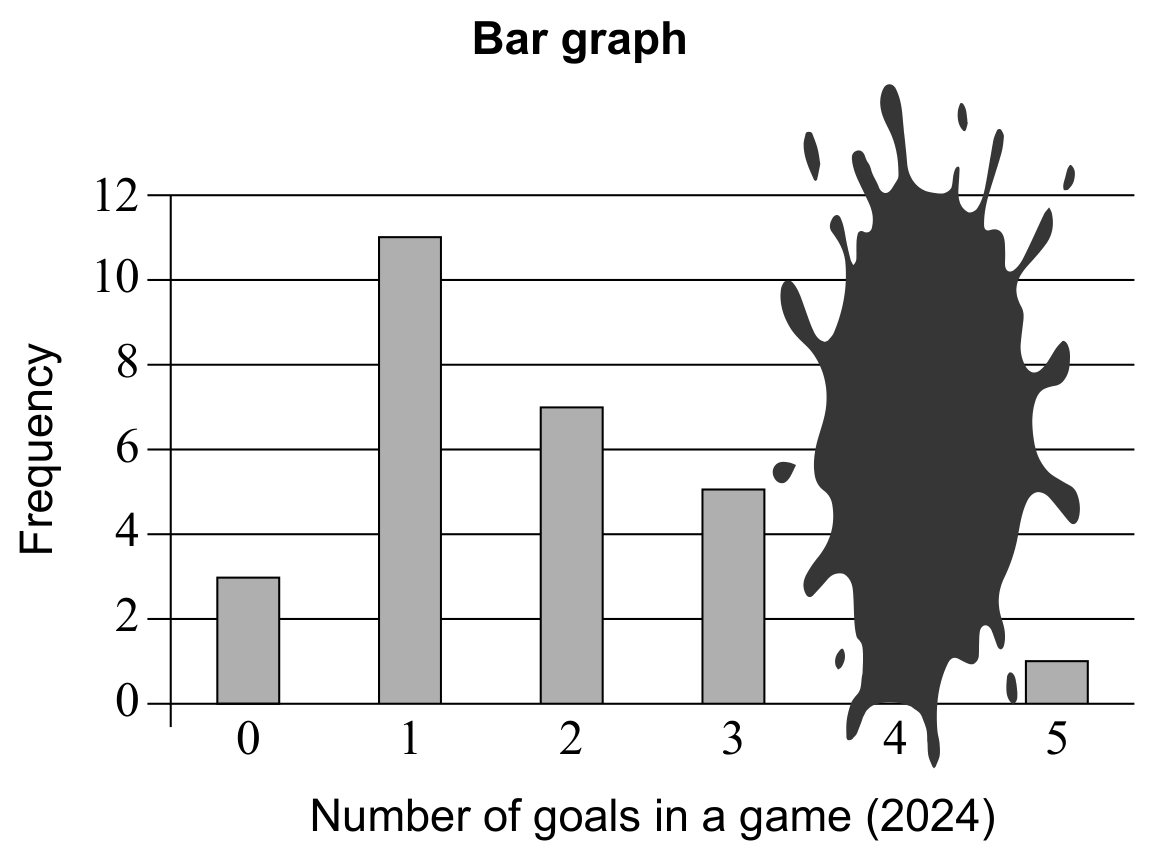
Paul has a bar graph for the total number of goals scored in each game of a soccer tournament in 2024. The bar graph is shown below, however the frequency of 4 goals in a game is unreadable.
Paul uses this bar graph to create a frequency table.
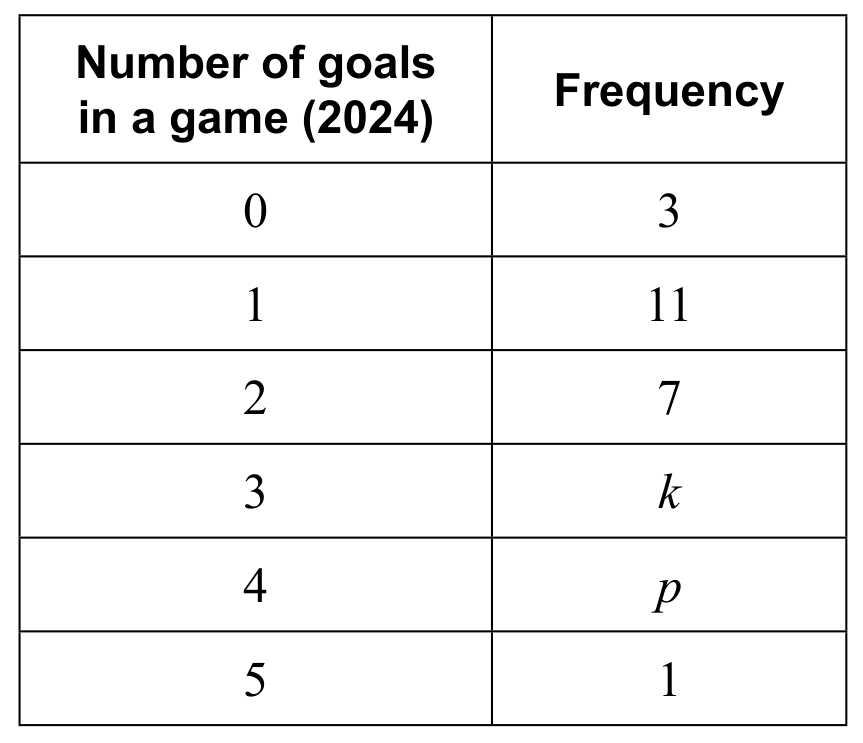
Question image
Frequency table

Frequency table

(a)

Write down the value of k.

Paul knows that the mean number of goals per game scored during the tournament was 2.2 .

[ 1 ]
(b)
(i)

Write down an equation for the mean in terms of p.

[ 3 ]
(ii)

Determine the value of p.

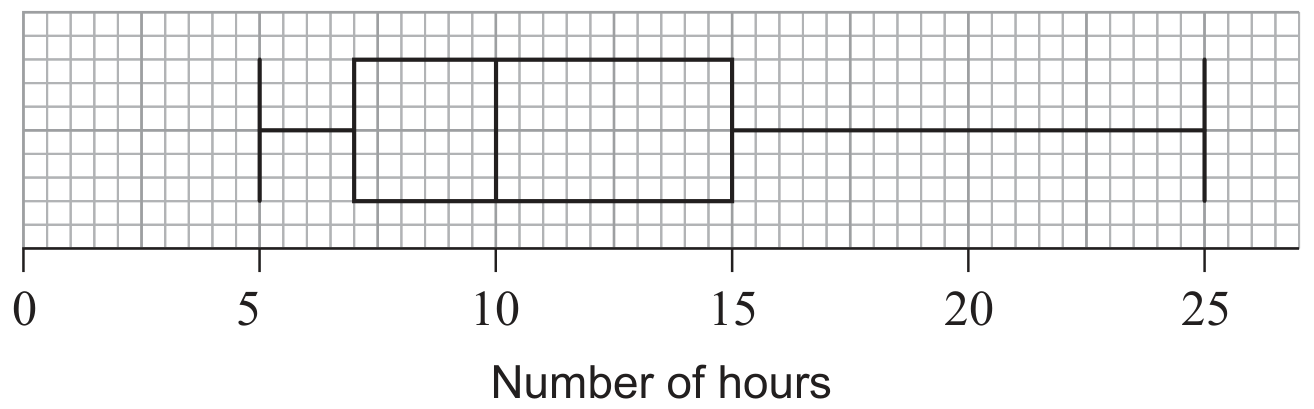
Data for the number of goals per game in the 2025 soccer tournament are shown in the following box and whisker diagram.

Question image

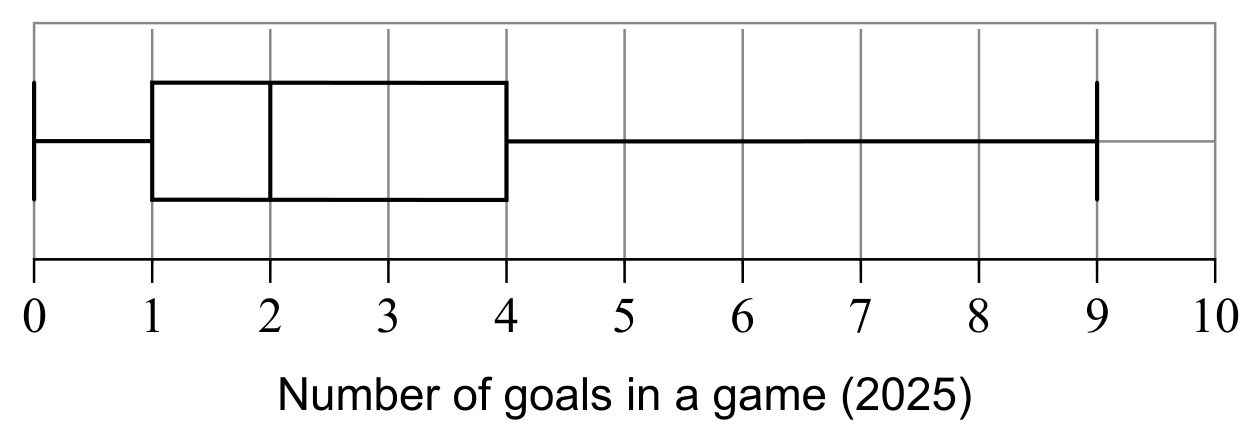
After comparing the box and whisker diagram from the 2025 tournament with the frequency table from the 2024 tournament, Paul concludes that the distribution of goals is consistent between the two tournaments.

[ 3 ]
(c)

State two observations that support Paul's conclusion using values from the data to compare any two of:
range, symmetry, median, and interquartile range.

Paul plans to watch all the games from the 2024 tournament in a random order.
He will watch each game once.
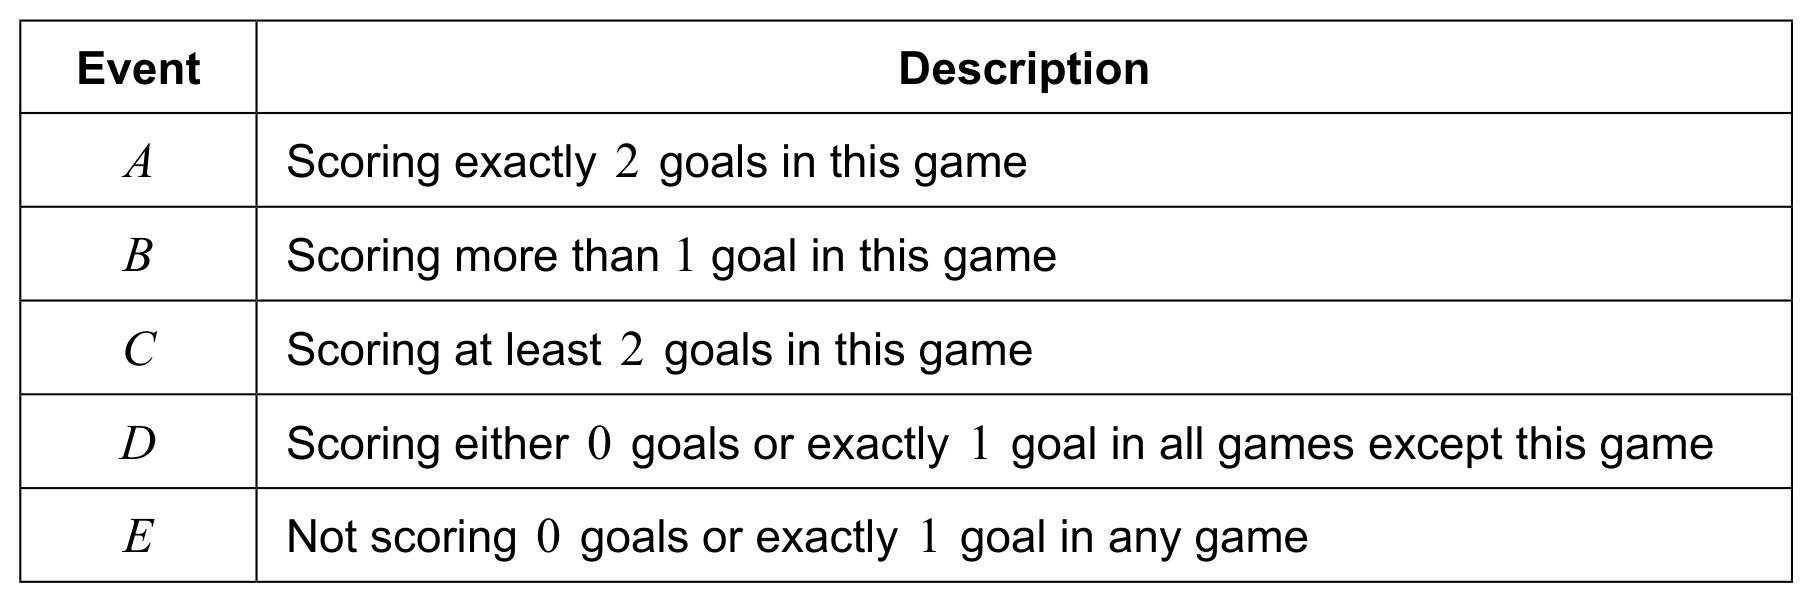
For the first game he watches, he defines event F as:
"scoring either 0 goals or exactly 1 goal".

[ 3 ]
(d)

Write down the event(s) from the table that are equivalent to FF^{\prime}. There may be more than one correct event.

Table
[ 2 ]
(e)

If exactly 1 goal was scored in the first game Paul watches, write down the probability that exactly 1 goal was scored in the second game he watches. Give your answer as a fraction.

[ 2 ]
(f)

Calculate the probability that 5 goals were scored in the first game that Paul watches and 0 goals were scored in the second game he watches.

[ 4 ]
[Maximum number: 8]

Hot air balloons are available in many sizes for different numbers of passengers.

Question image

The following table shows the recommended minimum volume of a hot air balloon, in cubic metres, for a specific number of passengers.

Table
(a)

Use your graphic display calculator to find the Pearson's product-moment correlation coefficient, r, for these values.

[ 2 ]
(b)
(i)

Find the equation of the regression line y on x for this data in the form y=a x+b.

[ 2 ]
(ii)

State what the value of a means in the context of the question.

[ 2 ]
(c)

Use your regression equation from part (b)(i) to find the recommended minimum volume of a balloon for 10 passengers.

[ 2 ]
[Maximum number: 5]

A metal structure on a flat surface is in the form of a right-pyramid with rectangular base ABCD and vertex H(-0.5,1.5,5). Point A has coordinates (-2,0,0) and point C has coordinates (1,3,0). This is shown in the following diagram.
All units are in centimetres.

Question image

The centre of the base, G, is the midpoint of A C.

(a)

Find the coordinates of G.

[ 2 ]
(b)

Write down the vertical height HG.

[ 1 ]
(c)

Find the distance between C and H .

[ 2 ]
[Maximum number: 13]

Cathie is a financial analyst studying the growth of two investment accounts, Account 1 and Account 2, for a new client.
Account 1 has an initial amount of 5000 US Dollars (USD). Interest is added to the amount in Account 1 at the end of each year in the following manner: 200 USD at the end of the first year, 260 USD at the end of the second year, 320 USD at the end of the third year, 380 USD at the end of the fourth year and 440 USD at the end of the fifth year.
Assume the amount of interest continues to increase each year so that it follows an arithmetic sequence.

(a)

Find

[ 3 ]
(i)

the common difference.

(ii)

the amount of interest, in USD, added at the end of the 10th year.

[ 3 ]
(b)

Show that the amount of money in Account 1 after n years may be expressed as

5000+n2(340+60n)5000+\frac{n}{2}(340+60 n)
(c)

Hence or otherwise, find the amount of money in Account 1 at the end of 10 years.

Account 2 has the same initial amount of 5000 USD . Account 2 pays 6.5 % interest compounded annually. The interest is added to the amount in the account at the end of each year.

The amount in Account 2 after n years can be expressed as 5000×Bn5000 \times B^{n} where BRB \in \mathbb{R}.

(d)
(i)

Write down the value of B.

(ii)

Hence or otherwise, show that Account 1 will have more money than Account 2 at the end of 10 years.

The client is interested in a longer-term investment. Cathie finds that it will take at least m complete years for the amount in Account 2 to exceed the amount in Account 1.

[ 4 ]
(e)

Find the value of m.

[ 3 ]
(f)

Determine the total interest added to Account 2 at the end of m years.

Give your answer correct to the nearest dollar.

[ 3 ]
[Maximum number: 5]

The first three terms of a geometric sequence are 2,6 and 18.

(a)

Write down the common ratio, r.

[ 1 ]
(b)

Find the 8th term of the sequence.

[ 2 ]
(c)

Find the sum of the first 10 terms of the sequence.

[ 2 ]
[Maximum number: 16]

Thai cushions are designed with a triangular cross-section and are made from layers of smaller cushions. These cushions can be modelled as triangular prisms.
This is shown in the diagram.

Thai cushion with 4 layers

Thai cushion with 4 layers

Cross-section of Thai cushion with 5 layers

Cross-section of Thai cushion with 5 layers

(a)

Write down the number of triangular prisms in the bottom layer of the cushion with

[ 2 ]
(i)

4 layers.

(ii)

5 layers.

Mayumi notices that the number of triangular prisms in the bottom layer of the cushions forms an arithmetic sequence.

[ 2 ]
(b)
(i)

Write down the common difference of this sequence.

(ii)

Find an expression for the number of triangular prisms in the bottom layer of a cushion with n layers.

Mayumi wants to extend this design to create a cushion with 9 layers.

[ 3 ]
(c)
(i)

Find the number of triangular prisms in the bottom layer of Mayumi's cushion.

(ii)

Calculate the total number of triangular prisms in Mayumi's cushion.

[ 3 ]
(d)

Find an expression for the total number of triangular prisms in a cushion with n layers, giving your answer in its simplest form.

[ 2 ]
(e)

The cross-section of the cushion consists of black triangles and white triangles.

This cushion with 4 layers has a total of 6 white triangles.

This cushion with 4 layers has a total of 6 white triangles.

This cushion with 5 layers has 4 white triangles in its bottom layer.

This cushion with 5 layers has 4 white triangles in its bottom layer.

Write down the total number of black triangles in a cushion with 4 layers.

The number of black triangles in each layer forms an arithmetic sequence.

[ 1 ]
(f)

Find and simplify an expression for the total number of black triangles in a cushion with n layers.

The total number of white triangles in a cushion with n layers is n(n1)2\frac{n(n-1)}{2}.

[ 2 ]
(g)

Using both the given expression and your answer to part (f), find and simplify an expression for the total number of black and white triangles in a cushion with n layers.

[ 3 ]
[Maximum number: 7]

Give answers to this question correct to two decimal places.
Pierre invests 1500 euros (EUR) at the end of each month for 10 years into a savings plan that pays a nominal annual interest rate of 3.6 % compounded monthly.

(a)

Calculate the value of Pierre's savings plan at the end of the 10 years.

At the end of the 10 years, Pierre withdraws 100000 EUR from the savings plan to use as a deposit on a house.

Pierre invests the remainder into another account for 15 years at a nominal annual interest rate of 4.5 % compounded quarterly.

[ 3 ]
(b)

Calculate the amount in Pierre's account at the end of this time.

[ 4 ]
[Maximum number: 5]

Consider the following list of 10 data items.

16192119181216212132\begin{array}{llllllllll} 16 & 19 & 21 & 19 & 18 & 12 & 16 & 21 & 21 & 32 \end{array}

This data has a mean of 19.5.
Find the value of the

(a)

mode.

[ 1 ]
(b)

median.

[ 1 ]
(c)

standard deviation.

[ 1 ]
(d)

range.

[ 2 ]
[Maximum number: 16]

A group of 1280 students were asked which electronic device they preferred. The results per age group are given in the following table.

Table
(a)

A student from the group is chosen at random. Calculate the probability that the student

[ 9 ]
(i)

prefers a tablet.

(ii)

is 11-13 years old and prefers a mobile phone.

(iii)

prefers a laptop given that they are 17-18 years old.

(iv)

prefers a tablet or is 14-16 years old.

A χ2\chi^{2} test for independence was performed on the collected data at the 1 % significance level. The critical value for the test is 13.277 .

[ 9 ]
(b)

State the null and alternative hypotheses.

[ 1 ]
(c)

Write down the number of degrees of freedom.

[ 1 ]
(d)
(i)

Write down the χ2\chi^{2} test statistic.

(ii)

Write down the p-value.

(iii)

State the conclusion for the test in context. Give a reason for your answer.

[ 5 ]
[Maximum number: 21]

As part of his mathematics exploration about classic books, Jason investigated the time taken by students in his school to read the book The Old Man and the Sea. He collected his data by stopping and asking students in the school corridor, until he reached his target of 10 students from each of the literature classes in his school.

(a)

State which of the two sampling methods, systematic or quota, Jason has used.

[ 1 ]
(b)

Jason constructed the following box and whisker diagram to show the number of hours students in the sample took to read this book.

Question image

Write down the median time to read the book.

[ 1 ]
(c)

Calculate the interquartile range.

Mackenzie, a member of the sample, took 25 hours to read the novel. Jason believes Mackenzie's time is not an outlier.

[ 2 ]
(d)

Determine whether Jason is correct. Support your reasoning.

[ 4 ]
(e)

For each student interviewed, Jason recorded the time taken to read The Old Man and the Sea ( x ), measured in hours, and paired this with their percentage score on the final exam ( y ). These data are represented on the scatter diagram.

Question image

Describe the correlation.

Jason correctly calculates the equation of the regression line y on x for these students to be

y=-1.54 x+98.8

He uses the equation to estimate the percentage score on the final exam for a student who read the book in 1.5 hours.

[ 1 ]
(f)

Find the percentage score calculated by Jason.

[ 2 ]
(g)

State whether it is valid to use the regression line y on x for Jason's estimate. Give a reason for your answer.

Jason found a website that rated the 'top 50' classic books. He randomly chose eight of these classic books and recorded the number of pages. For example, Book H is rated 44th and has 281 pages. These data are shown in the table.

Table

Jason intends to analyse the data using Spearman's rank correlation coefficient, rsr_{\mathrm{s}}.

[ 2 ]
(h)

Copy and complete the information in the following table.

Table
[ 2 ]
(i)
(i)

Calculate the value of rsr_{\mathrm{s}}.

[ 3 ]
(ii)

Interpret your result.

[ 3 ]
0