1.1.3—Stability and energy
- Syllabus
- First assessment 2025
- Objective
- 1.1.3
- Level
- SL
Lower relative energy corresponds to greater relative stability. In an exothermic reaction the products are lower in energy than the reactants; in an endothermic reaction the products are higher.
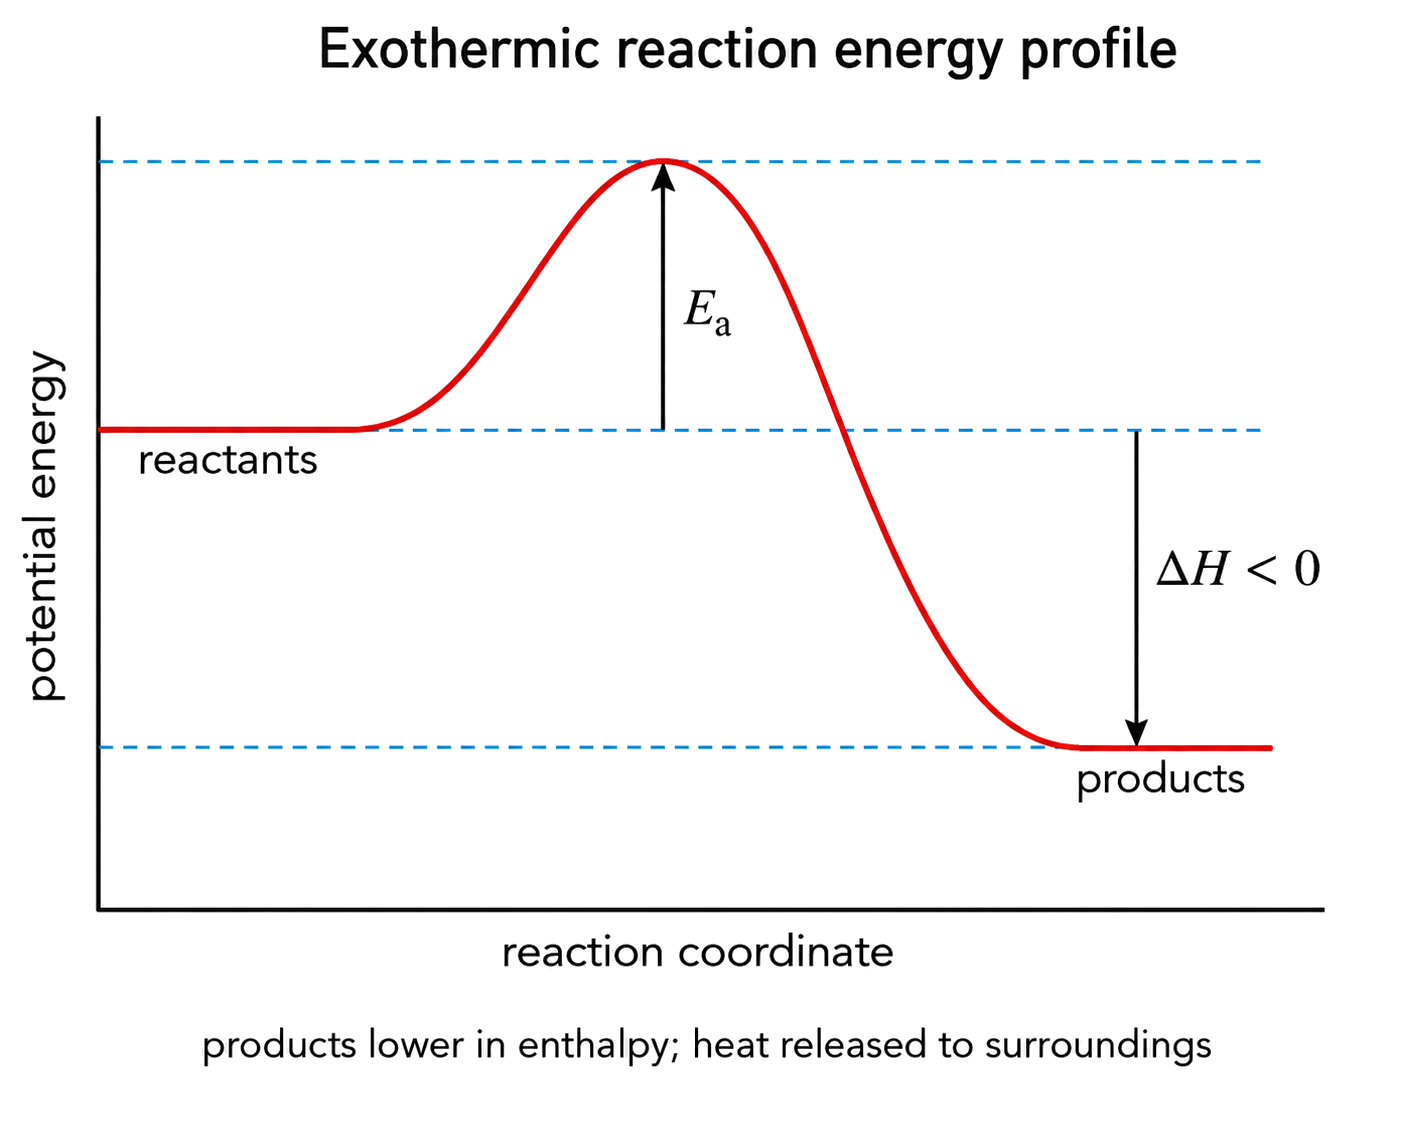
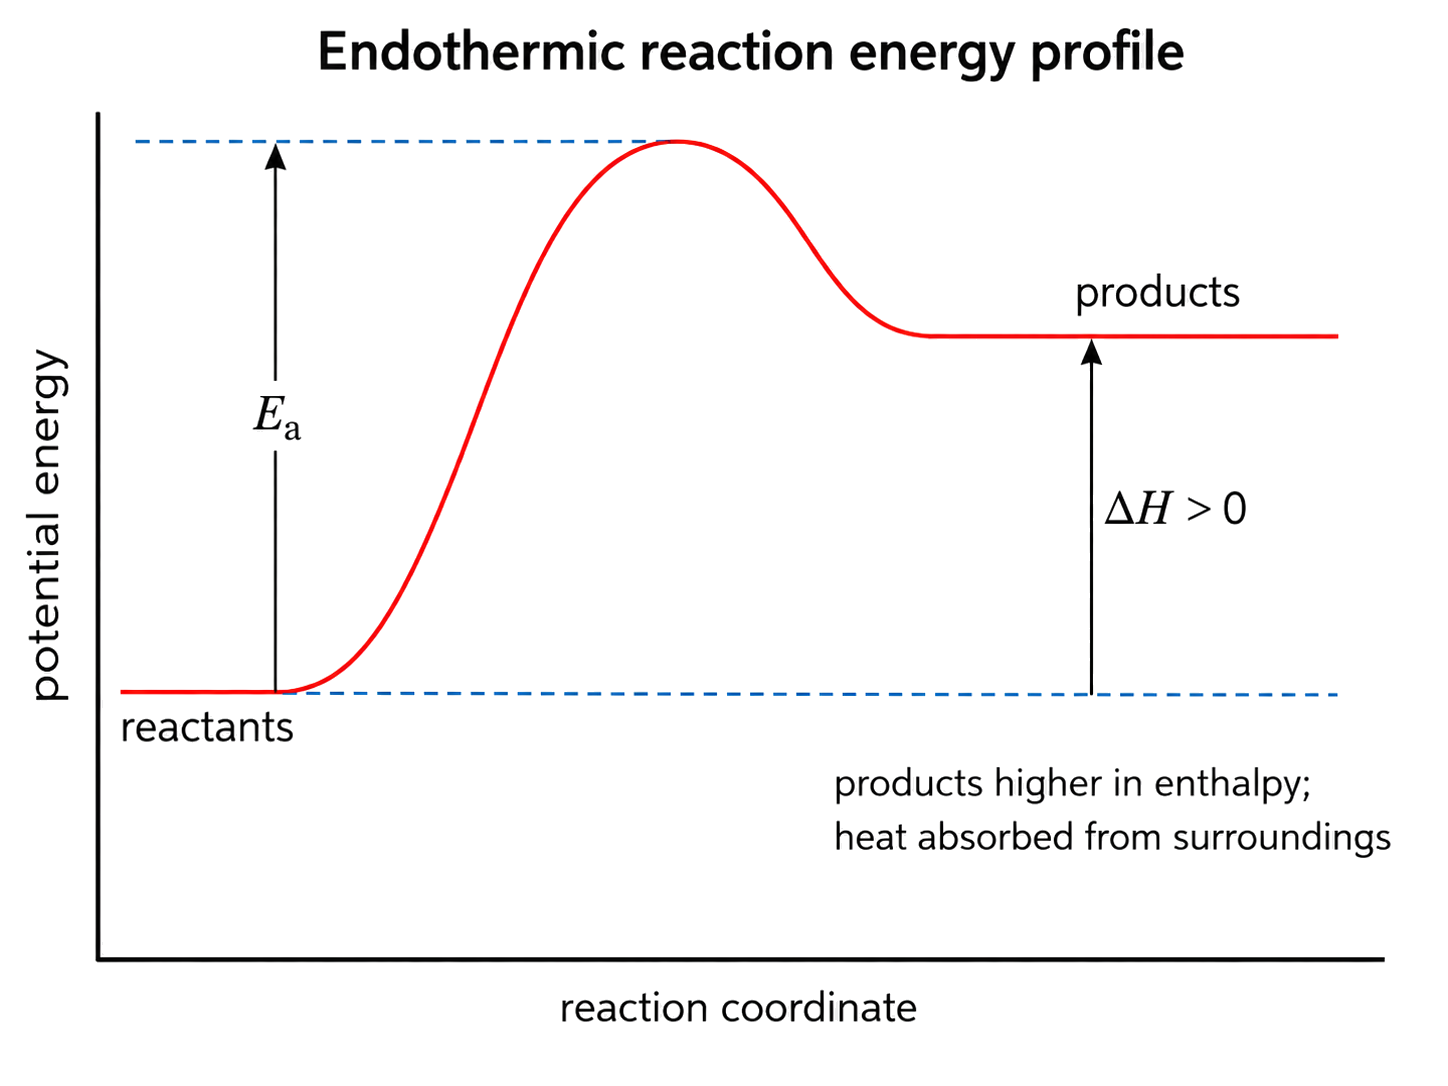
Label the horizontal axis reaction coordinate and the vertical axis potential energy. Then read reactant and product levels, identify the sign and direction of ΔH, and distinguish ΔH from activation energy.
On a profile, ΔH is the vertical difference between product and reactant levels, while activation energy rises from reactants to the peak. A catalyst lowers the peak by changing the pathway but leaves the two energy levels, ΔH and the relative stability of reactants and products unchanged.
An energy profile identifies an activation barrier but does not by itself determine an observed rate: temperature, particle concentrations/collision frequency and the available pathway also matter. Use the diagram to compare energetic barriers only when the profiles and conditions make that comparison valid.