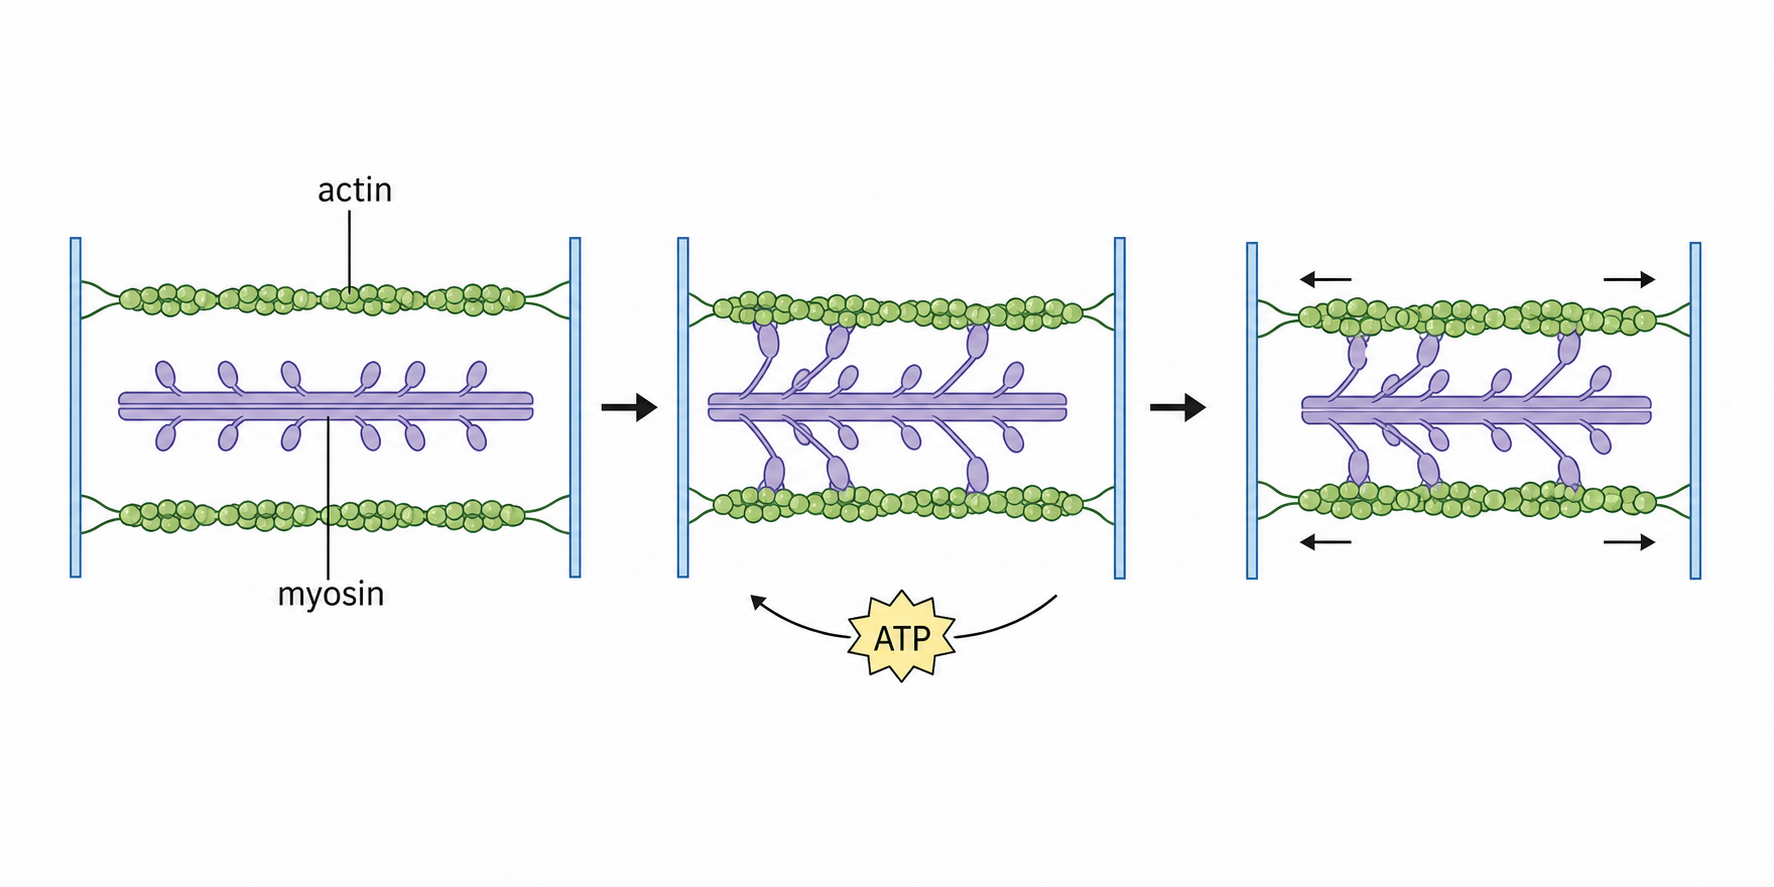
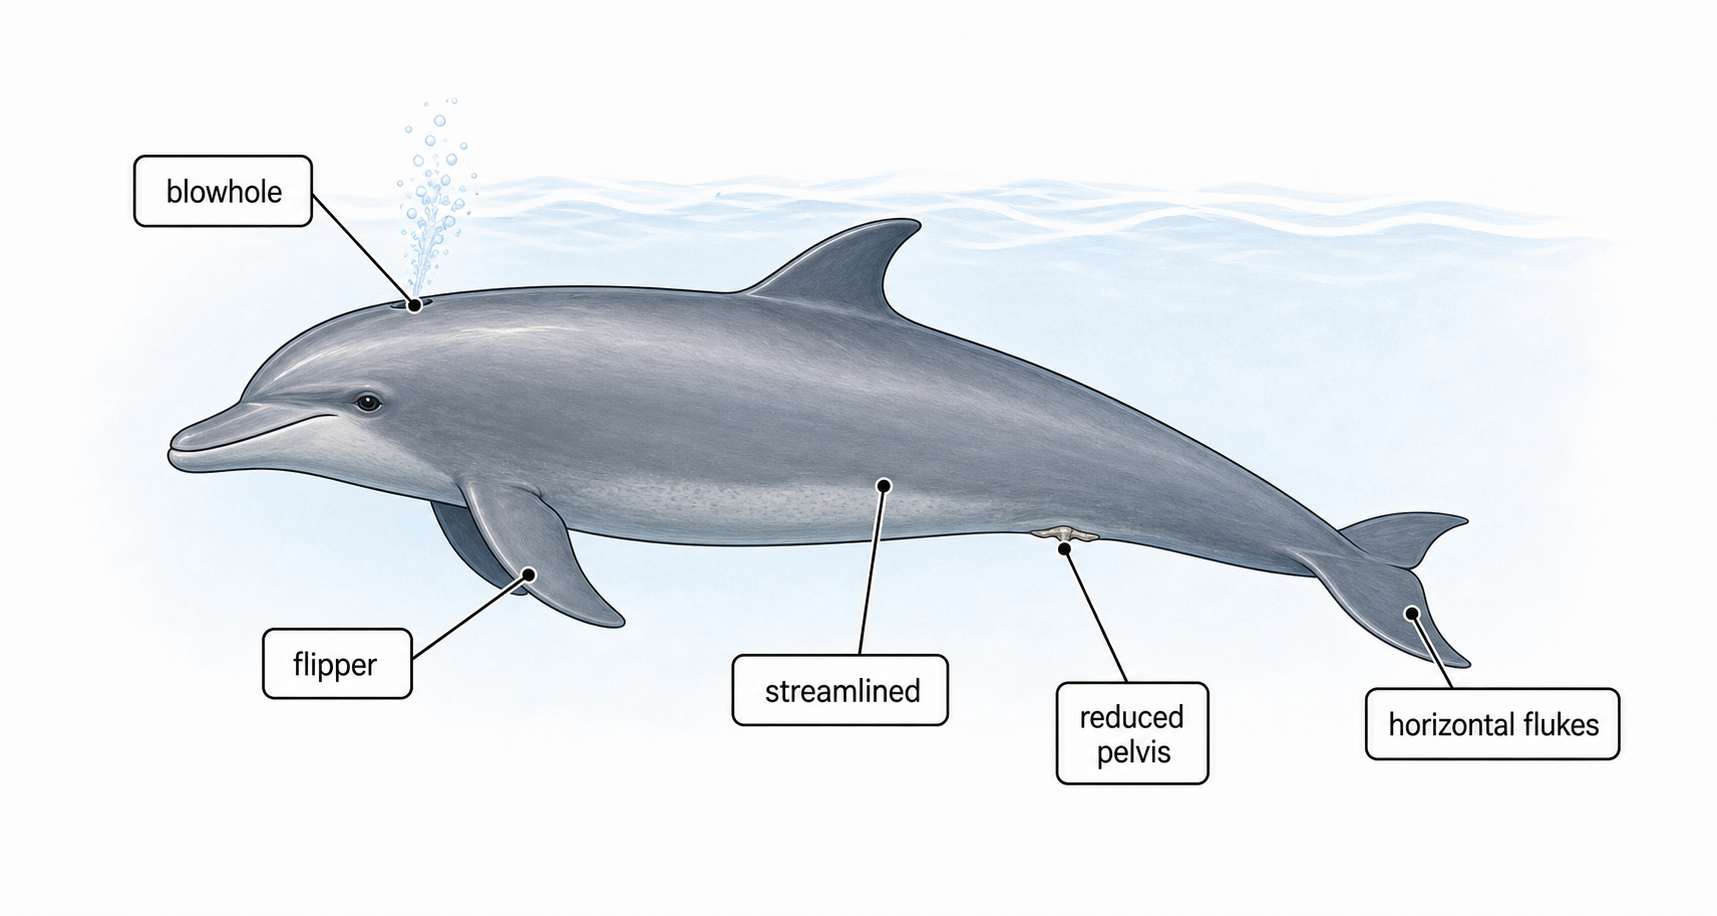
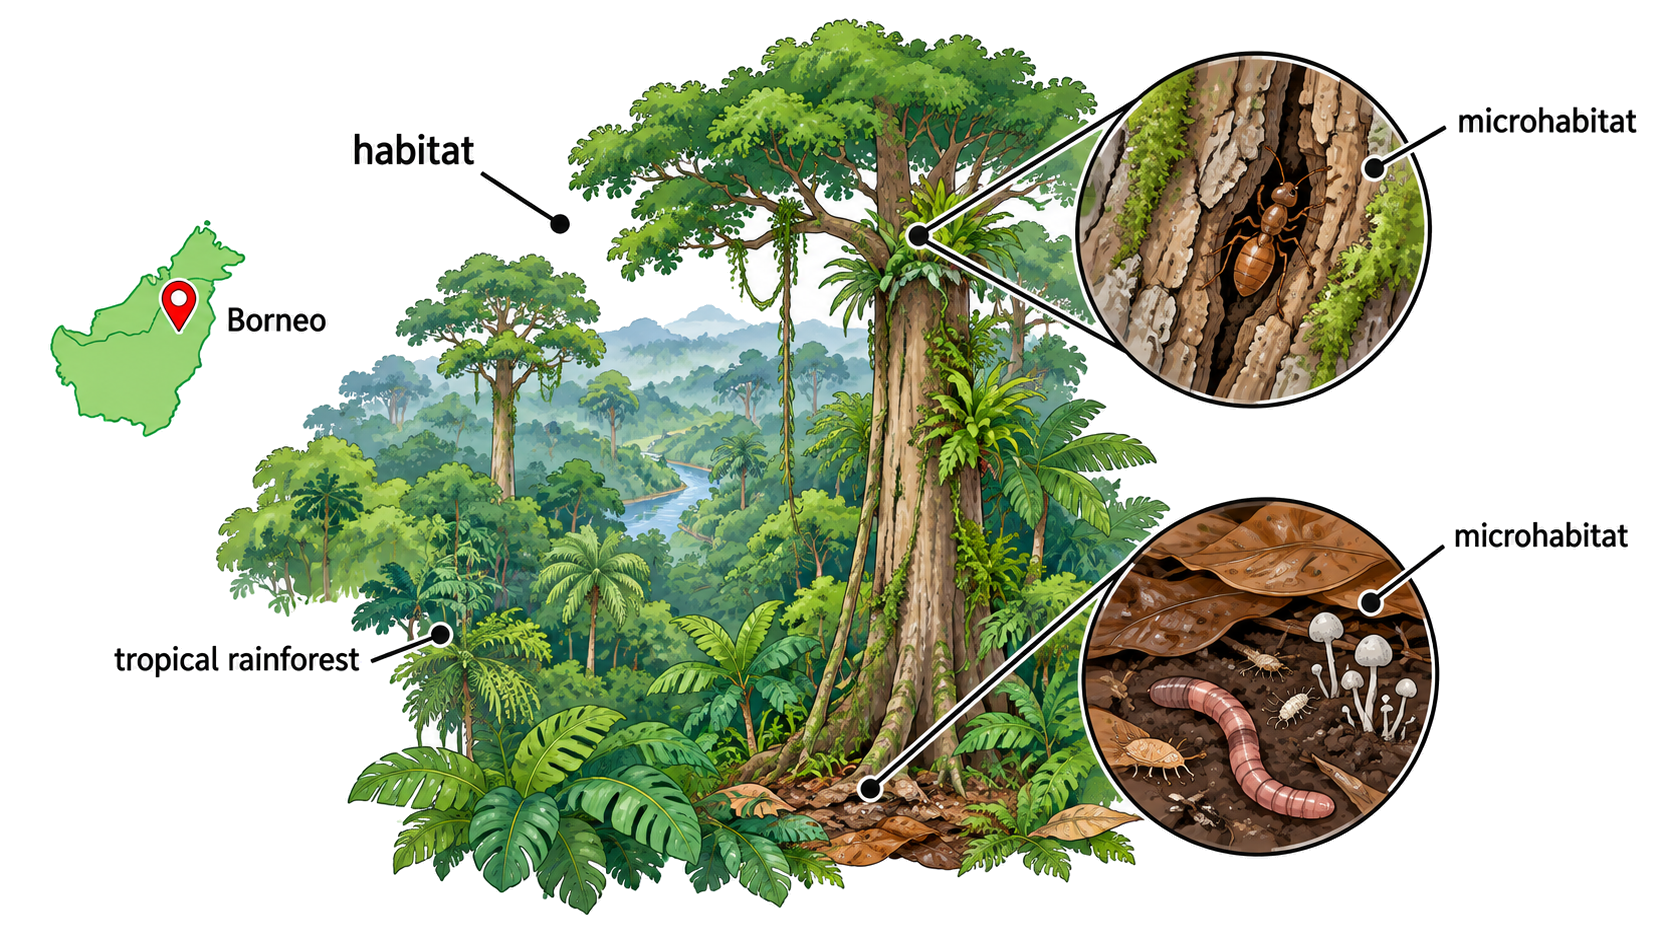
Form and Function connects biological structures to the processes they enable, from molecules and membranes to tissues, organs, transport systems and ecological adaptations.
Syllabus
First assessment 2025
Section
—
Level
HL
Exam analysis
Published Concept evidence in Form and Function repeatedly asks students to connect structure with function across molecules, membranes, cells and exchange systems. The strongest pattern is explaining how specific features enable transport, support, movement, regulation or adaptation.
Carbohydrates and lipids connect carbon chemistry, condensation and hydrolysis reactions, molecular structure, solubility, membrane formation, and energy storage functions in organisms.
Syllabus
First assessment 2025
Topic
B1.1
Level
HL
Four bonds let carbon vary without losing stability
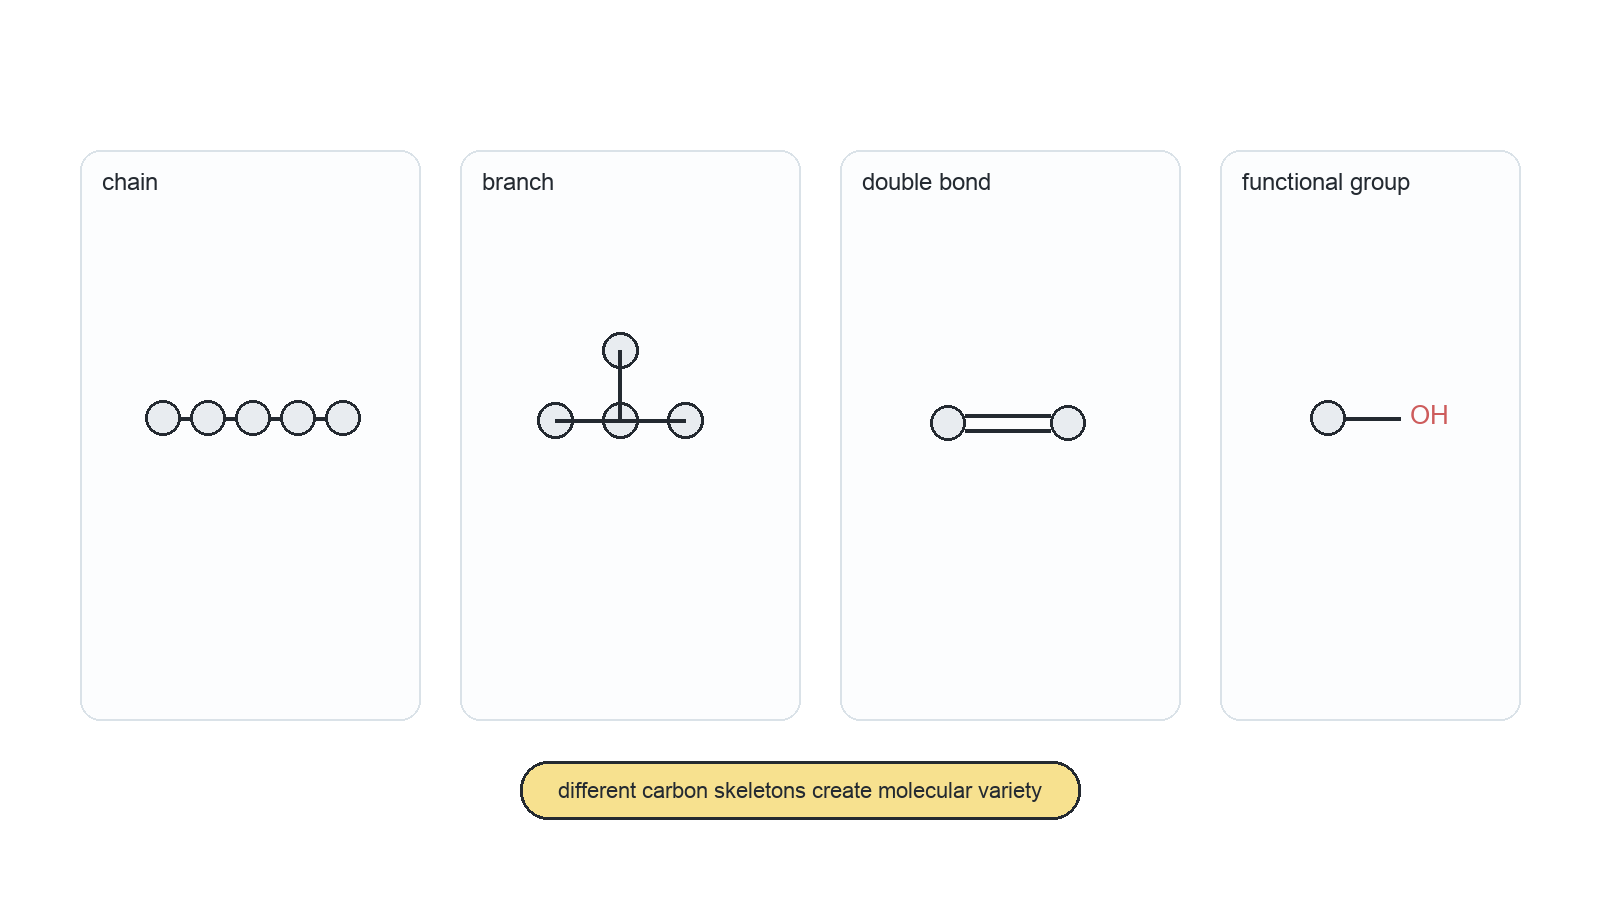
Carbon has four electrons available for bonding and can form four strong covalent bonds. It bonds to carbon and to elements such as H, O, N, S and P, so a stable skeleton can carry many different groups.
Structural choice
New possibility
chain, branch or ring
different overall shapes
single or double bond
different geometry and reactivity
attached functional group
characteristic chemical behaviour
The carbon skeleton provides a stable framework; the arrangement of bonds and functional groups determines how the molecule behaves.
Condensation stores subunits in a covalent bond
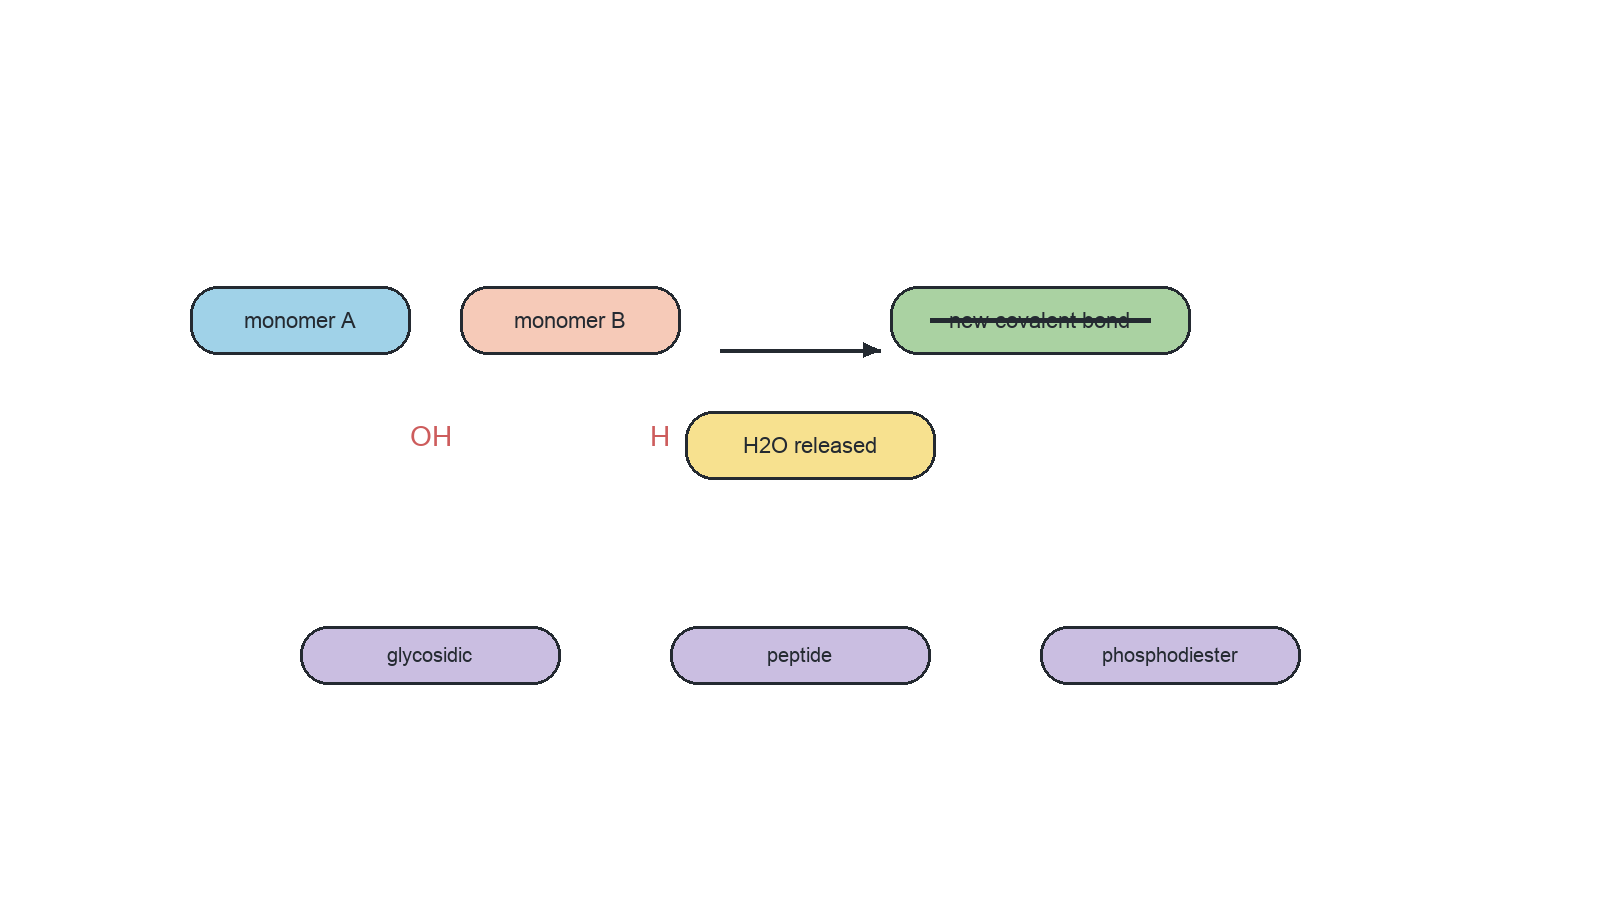
In a condensation reaction, an –OH from one molecule and an –H from another leave as H₂O. A new covalent bond joins the remaining parts.
Subunits joined
Larger molecule
Linkage formed
monosaccharides
polysaccharide
glycosidic
amino acids
polypeptide
peptide
nucleotides
nucleic acid
phosphodiester
Each joining event releases one water molecule. Repeating the reaction builds a macromolecule; the covalent linkage, not the released water, holds its subunits together.
Hydrolysis uses water to release monomers
During hydrolysis:
water is a reactant
a covalent linkage breaks
water supplies –H to one product and –OH to the other
Condensation produces water while forming a bond. Hydrolysis consumes water while breaking one. The reactions are reverse in chemistry but are controlled by different enzymes in cells.
Read a sugar ring before naming its role
Feature in a ring diagram
What it identifies
5 carbon atoms in the molecule
a pentose such as ribose
6 carbon atoms in the molecule
a hexose such as glucose
carbon-1 –OH below the α-glucose ring
α-glucose
carbon-1 –OH above the β-glucose ring
β-glucose
α- and β-glucose have the same molecular formula but differ in the position of the –OH attached to carbon 1. Enzymes can distinguish this small geometric difference.
That one orientation controls the polymer route: α-glucose builds starch and glycogen, whereas β-glucose builds cellulose.
Glucose is mobile fuel and a stable building block
Property of glucose
Biological consequence
many polar –OH groups
dissolves in aqueous cytoplasm and blood plasma
small molecule
can be transported and taken up by cells
stable covalent ring
can circulate without reacting at random
energy-rich C–H bonds
acts directly as a respiratory substrate
functional groups for condensation
can be assembled into larger carbohydrates
Photosynthesis supplies glucose; transport brings it to cells; respiration transfers some of its chemical energy to ATP. When immediate fuel is not needed, condensation can divert glucose into storage or structural polysaccharides.
Solubility makes glucose useful in transit but unsuitable for storing large amounts inside a cell: many dissolved glucose molecules would lower water potential and draw in water.
Branching controls access to stored glucose
Starch and glycogen are compact, insoluble stores of α-glucose. Their large molecules do not diffuse away and have far less osmotic effect than the same number of separate glucose molecules.
Store
Main structure
What the structure changes
amylose in plant starch
mostly unbranched α-1,4 chain, coiled
compact but relatively few chain ends
amylopectin in plant starch
α-1,4 chains with α-1,6 branches
more ends available for enzyme action
glycogen in animals and fungi
more frequent α-1,6 branching
many ends allow rapid glucose release
Branching does not add more energy to each glucose unit. It increases the number of chain ends that enzymes can hydrolyse at the same time, so stored fuel can be mobilised faster.
Cellulose scales weak attractions into strong fibres
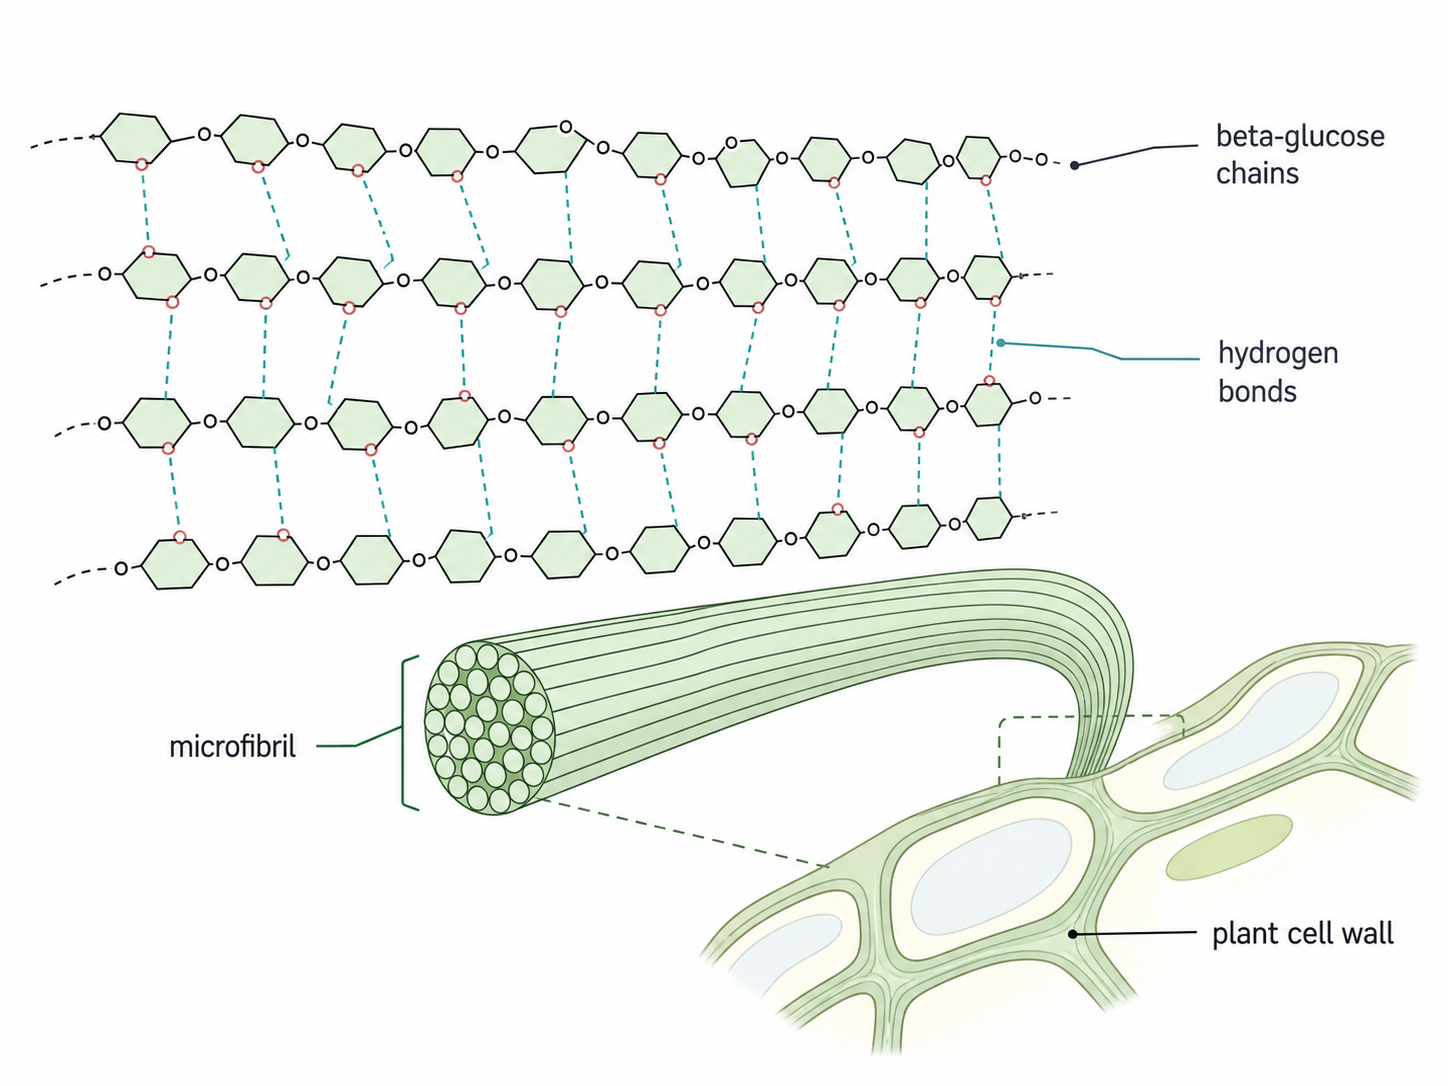
β-glucose monomers join by β-1,4 glycosidic bonds.
Alternate monomers are rotated 180°, producing a straight, unbranched chain.
Parallel chains form many hydrogen bonds.
Chains bundle into microfibrils; microfibrils combine into fibres.
Each hydrogen bond is weak, but many acting in parallel give high tensile strength. Cellulose therefore resists stretching and helps a water-filled plant cell maintain its shape without bursting.
Surface sugars make cells distinguishable
Short carbohydrate chains attached to membrane proteins and lipids project from the outer membrane surface. Together they form the glycocalyx: a chemically varied cell-surface coat.
The exposed carbohydrate patterns act as:
identity markers for self/non-self recognition
binding sites in cell adhesion
parts of receptors used in cell signalling
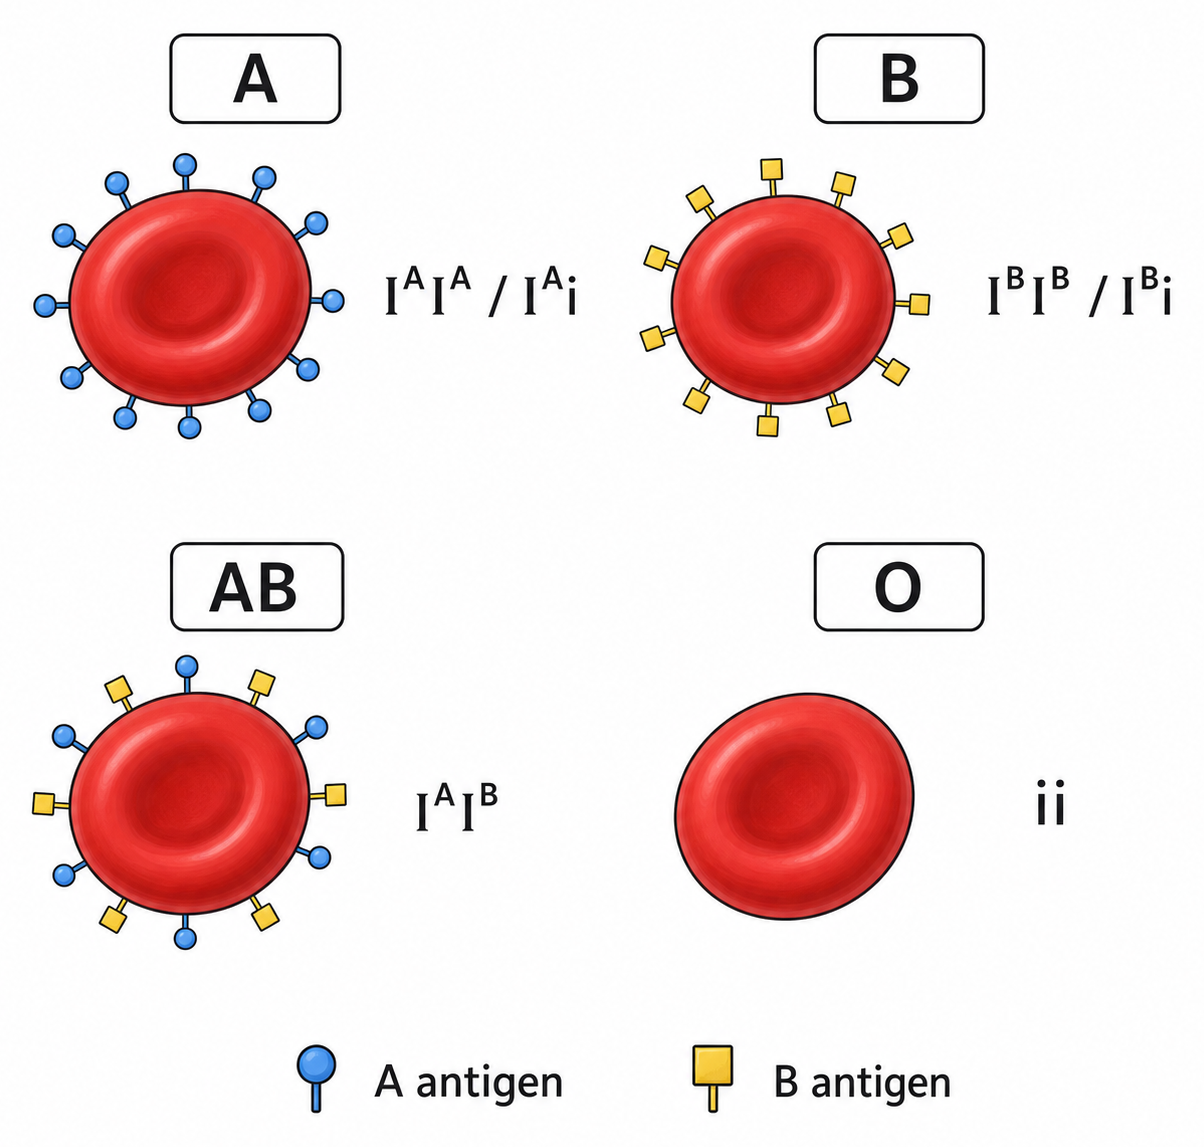
ABO antigens differ in their terminal surface sugars. A recipient's antibodies can bind an unfamiliar antigen and agglutinate donor red cells, showing that small carbohydrate differences can have whole-organism consequences.
Carbohydrate summary: follow monomer to biological job
Starting form
Linkage or arrangement
Emergent form
Main job
α-glucose
α-1,4 with optional α-1,6 branches
amylose, amylopectin, glycogen
energy storage
β-glucose
alternating β-1,4 chain; hydrogen-bonded bundles
cellulose fibres
tensile support
short surface sugars
attached to protein or lipid; exposed outside
glycocalyx markers
recognition, adhesion, signalling
Condensation builds a covalent linkage and releases water; hydrolysis consumes water and breaks that linkage. Which enzyme acts depends on the bond and substrate.
For a structure–function explanation:
name the monomer or functional group
identify the linkage and three-dimensional arrangement
state the resulting property
connect that property to the biological job
Hydrocarbon regions make lipids avoid water
Long hydrocarbon regions contain mostly non-polar C–C and C–H bonds. They cannot replace the hydrogen-bonding interactions that water molecules make with one another, so water excludes them and lipid molecules aggregate.
Observation
Structural explanation
poor solubility in water
large non-polar region has little attraction to water
solubility in non-polar solvents
similar intermolecular interactions are compatible
fat droplets coalesce
hydrophobic regions minimise contact with water
Fats, oils, waxes, phospholipids and steroids are grouped as lipids by physical behaviour, not by one repeating monomer. Lipids are therefore not true polymers.
One ester reaction builds two different lipid types
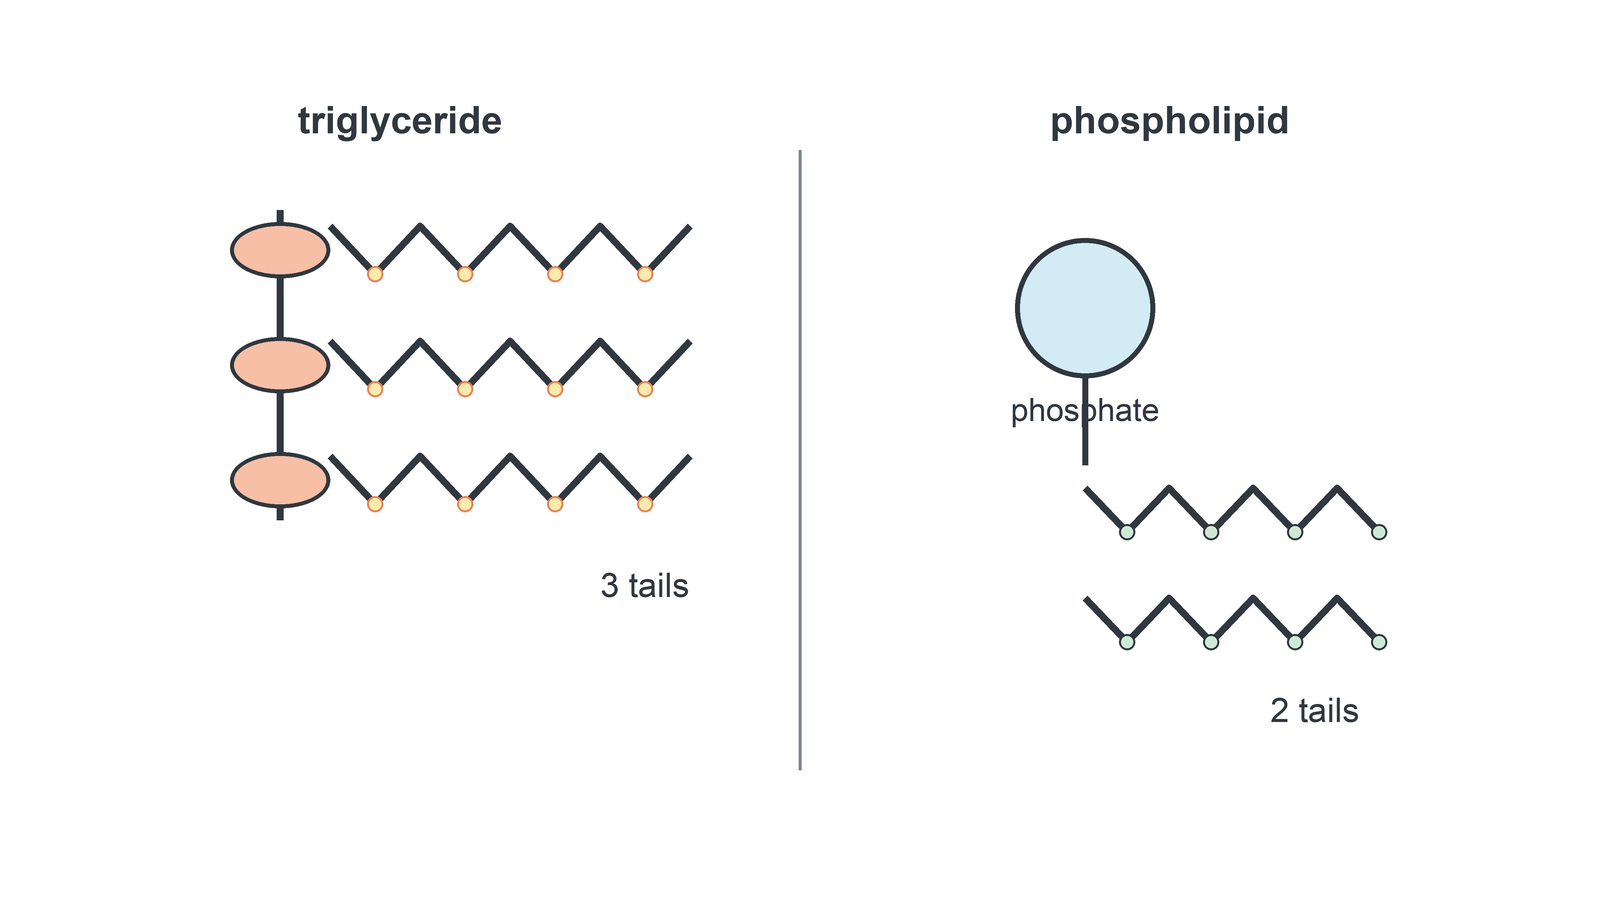
A fatty-acid carboxyl group reacts with a glycerol hydroxyl group. Condensation releases water and forms an ester bond. Glycerol has three hydroxyl groups, so it provides three attachment positions.
Product
Components attached to glycerol
Overall character
triglyceride
3 fatty acids
almost entirely hydrophobic
phospholipid
2 fatty acids + ionised phosphate group
amphipathic: polar head, non-polar tails
Glycerol is an alcohol, not a fatty acid. Replacing one fatty acid with phosphate changes not only the parts list but the molecule's behaviour in water.
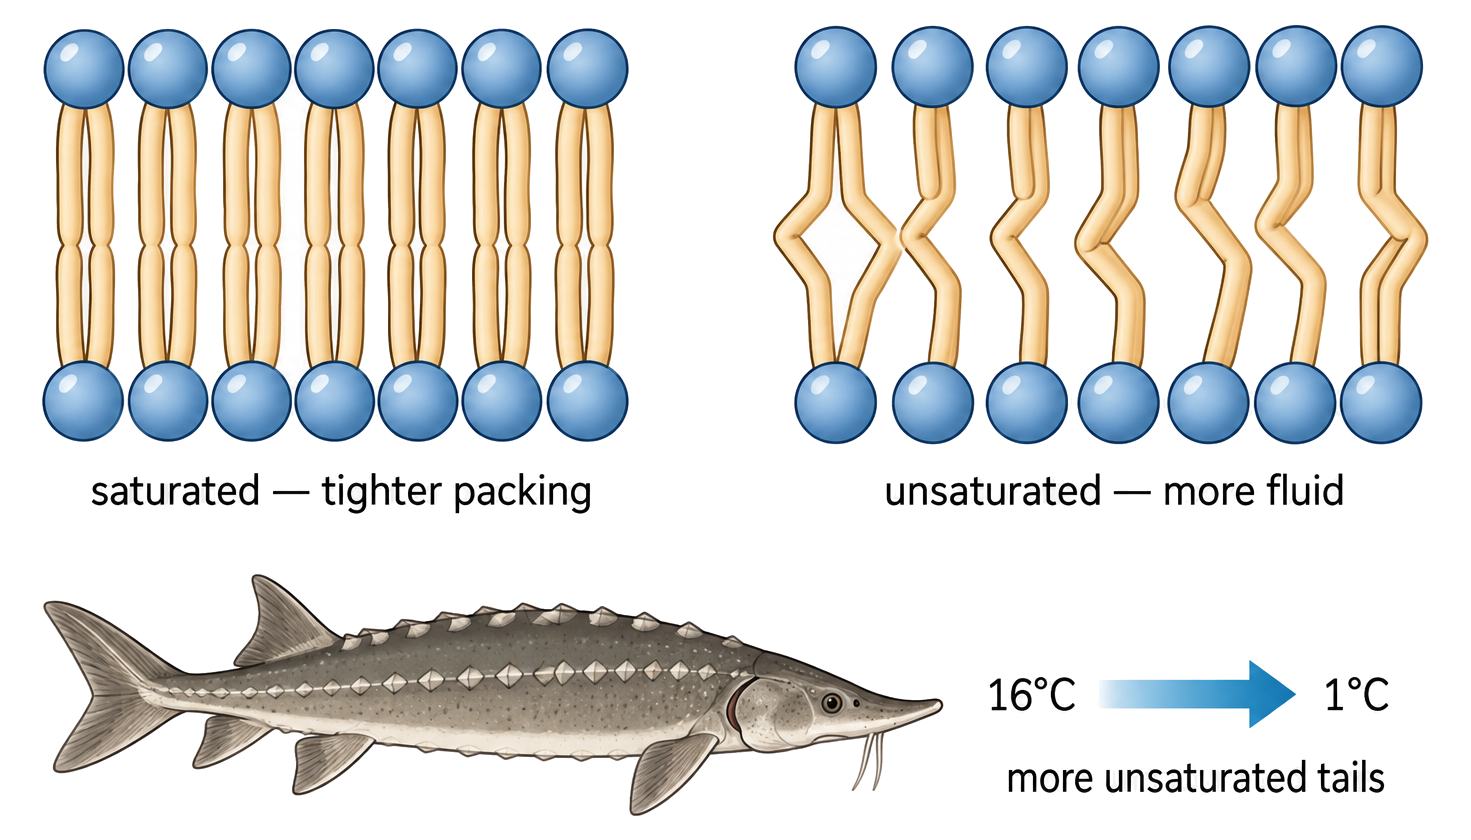
Double bonds loosen fatty-acid packing
Fatty acid
C=C double bonds
Typical tail shape
saturated
0
relatively straight
monounsaturated
1
one cis kink
polyunsaturated
2 or more
several kinks
More cis double bonds prevent neighbouring tails from approaching closely. Intermolecular attractions are weaker, so less thermal energy is needed to separate the molecules and the melting point falls.
At the same temperature, tightly packed saturated lipids are more likely to be solid; more unsaturated lipids are more likely to remain fluid.
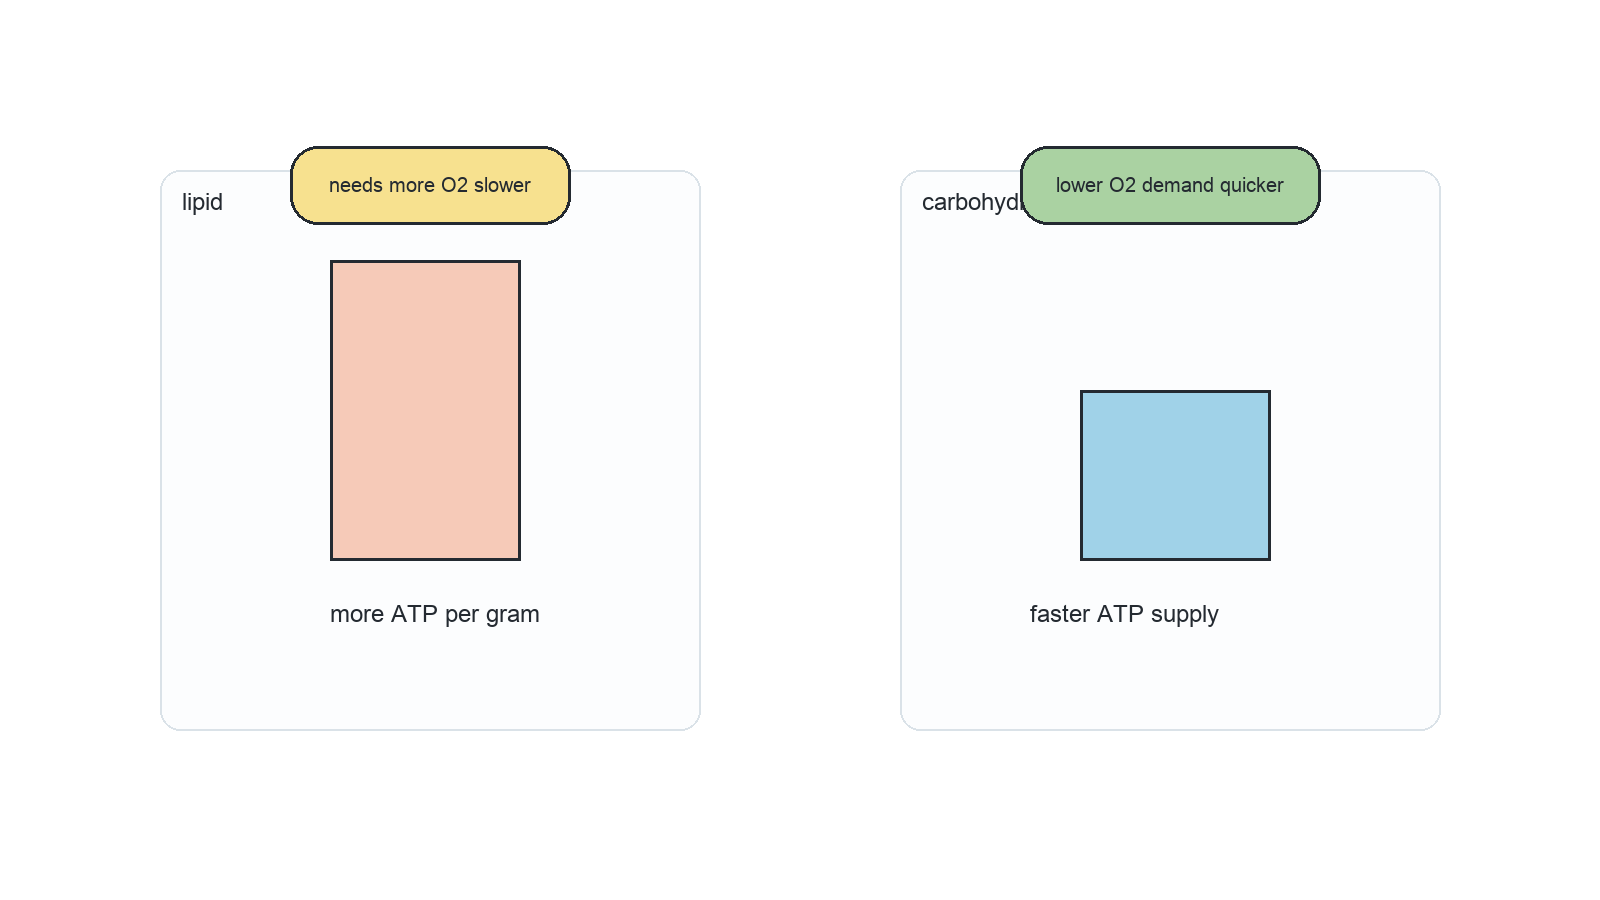
Triglycerides are dense, long-term energy stores
Storage property
Triglyceride consequence
highly reduced C–H-rich molecules
more than twice the energy per unit mass of carbohydrate
insoluble in water
stored without lowering water potential
oxidised completely
yields ATP, carbon dioxide and substantial metabolic water
Adipose triglyceride also provides:
thermal insulation beneath the skin
cushioning around organs
buoyancy when stored as low-density blubber
Triglyceride is compact long-term fuel, but it is mobilised less rapidly than branched glycogen and its oxidation requires more oxygen. Storage suitability depends on the biological timescale and demand.
Phospholipids hide their tails to make a barrier
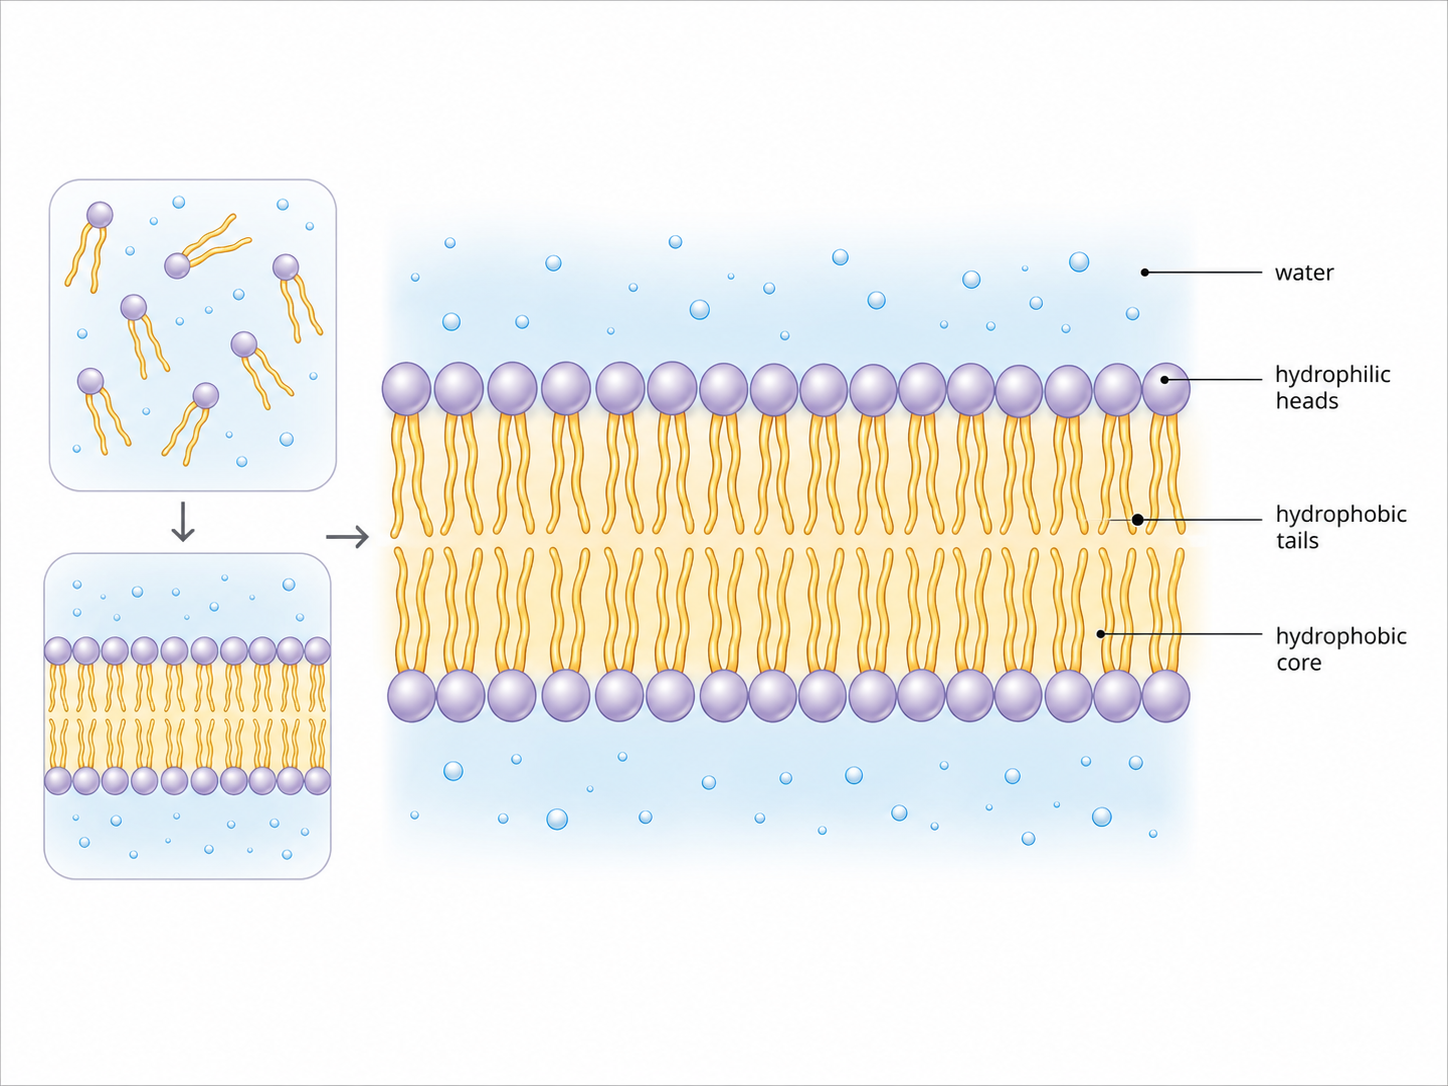
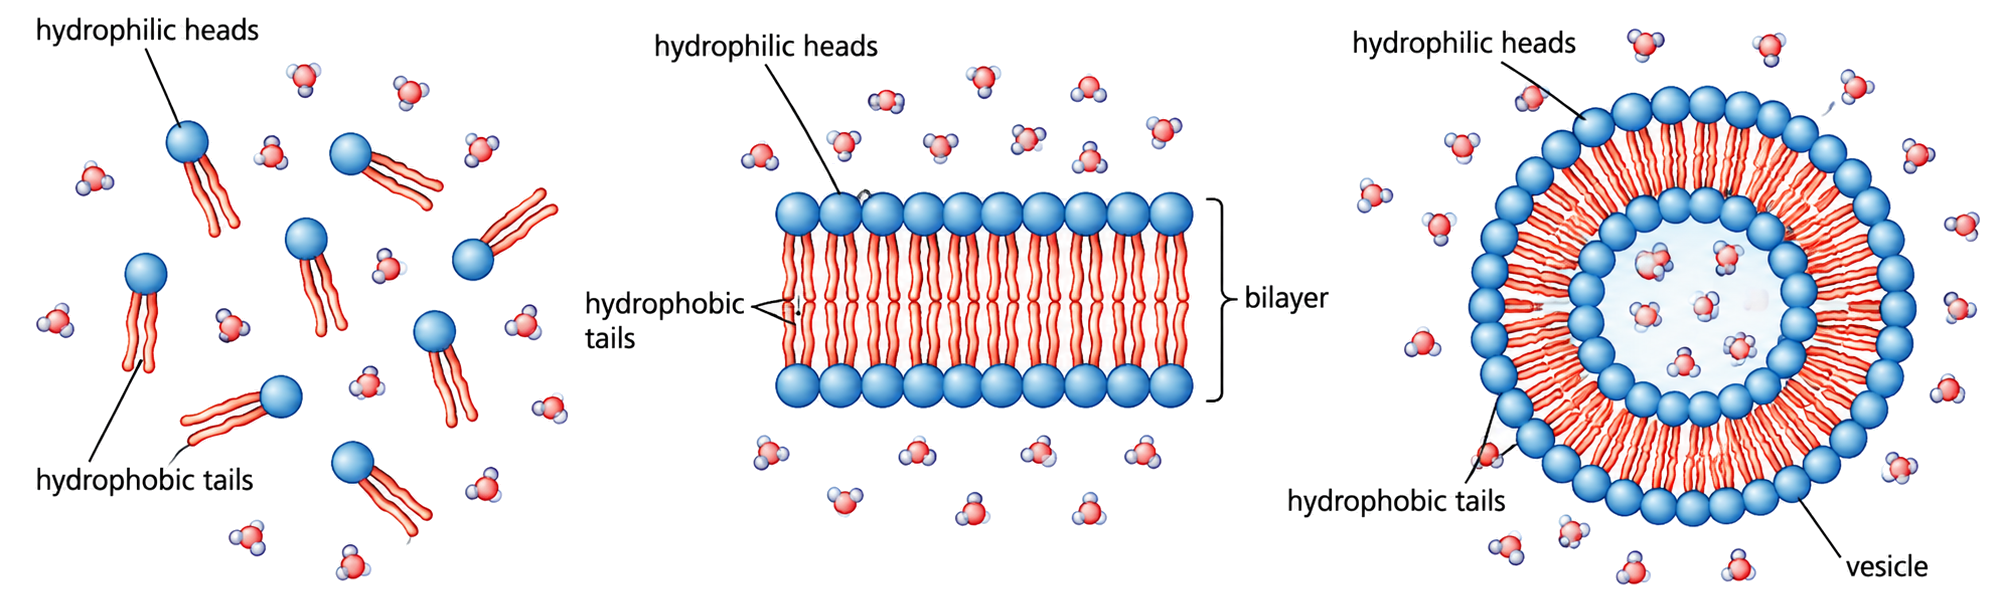
A phospholipid is amphipathic: its ionised phosphate head is hydrophilic, while its two hydrocarbon tails are hydrophobic.
In water, phospholipids arrange so that:
heads remain in contact with water
tails turn away from water
a surface favours a monolayer
water on both sides favours a bilayer with tails enclosed inside
Self-assembly lowers the exposure of non-polar tails to water. The resulting stable bilayer has a hydrophobic core that restricts many ions and polar solutes, forming the basic boundary of a cell.
A steroid crosses a bilayer through its non-polar core
A steroid has a characteristic core of four fused carbon rings. Cholesterol, oestradiol and testosterone share this framework even though their functional groups differ.
For a non-polar steroid hormone:
the molecule leaves the aqueous phase at the membrane surface
it dissolves in the bilayer's non-polar interior
random molecular motion carries it across
it re-enters the aqueous phase on the other side
Molecule property
Passage through the bilayer core
small and mostly non-polar
favoured
ionised or strongly polar
strongly restricted without a protein route
Crossing the membrane is not the same as travelling freely through blood. Hydrophobic steroids often require carrier proteins in aqueous plasma, then diffuse through target-cell membranes.
Lipid summary: predict behaviour from molecular regions
Structure seen
Property predicted
Main biological outcome
3 fatty-acid tails on glycerol
hydrophobic, highly reduced
dense long-term energy store
more cis C=C bonds in tails
poorer packing, lower melting point
greater fluidity at a given temperature
phosphate head + 2 tails
amphipathic
self-assembled bilayer barrier
4 fused carbon rings, mostly non-polar
lipid-soluble
diffusion through bilayer core
Ester condensation joins fatty acids to glycerol. The components retained in the product determine whether it behaves as a hydrophobic store or an amphipathic membrane molecule.
Across carbohydrates and lipids, use the same reasoning chain:
atoms and functional groups → bonds → molecular shape and polarity → interactions with water and other molecules → biological function
Carbon atom properties
[ 4 ]
Outline the chemical properties of carbon that allow it to form diverse compounds.
Macromolecules by condensation
[ 5 ]
Outline the production of a dipeptide by a condensation reaction, showing the structure of a generalized dipeptide.
Digestion by hydrolysis
[ 6 ]
Describe the importance of hydrolysis in digestion.
Form and function of monosaccharides
[ 5 ]
Outline how the properties of glucose are linked to their uses in organisms.
Drawing canvas
Polysaccharides as energy storage
[ 4 ]
Outline how and where energy is stored in plants.
Cellulose structure and function
[ 3 ]
Describe how cellulose is formed from monosaccharides.
Hydrophobic properties of lipids
[ 1 ]
Which substance must be transported in the blood by lipoprotein complexes?
Formation of triglycerides and phospholipids
[ 1 ]
Identify the molecule that was used to form part Y of the triglyceride.
Fatty acids
[ 4 ]
Distinguish between the structures of the different types of fatty acids in food.
Drawing canvas
Triglycerides functions
[ 4 ]
Outline the use of lipids to store energy in humans.
Phospholipid bilayers
[ 2 ]
Annotate the diagram to illustrate the amphipathic nature of phospholipids.
Non-polar steroids
[ 1 ]
Testosterone is a hormone that is important for male reproductive development.
To which group of compounds does testosterone belong?
B1.2 Proteins
Proteins connect amino acid structure, peptide-bond formation, dietary requirements, folding levels, R-group chemistry, denaturation, and functional protein shapes in cells.
Syllabus
First assessment 2025
Topic
B1.2
Level
HL
A shared amino-acid framework, variable R-groups
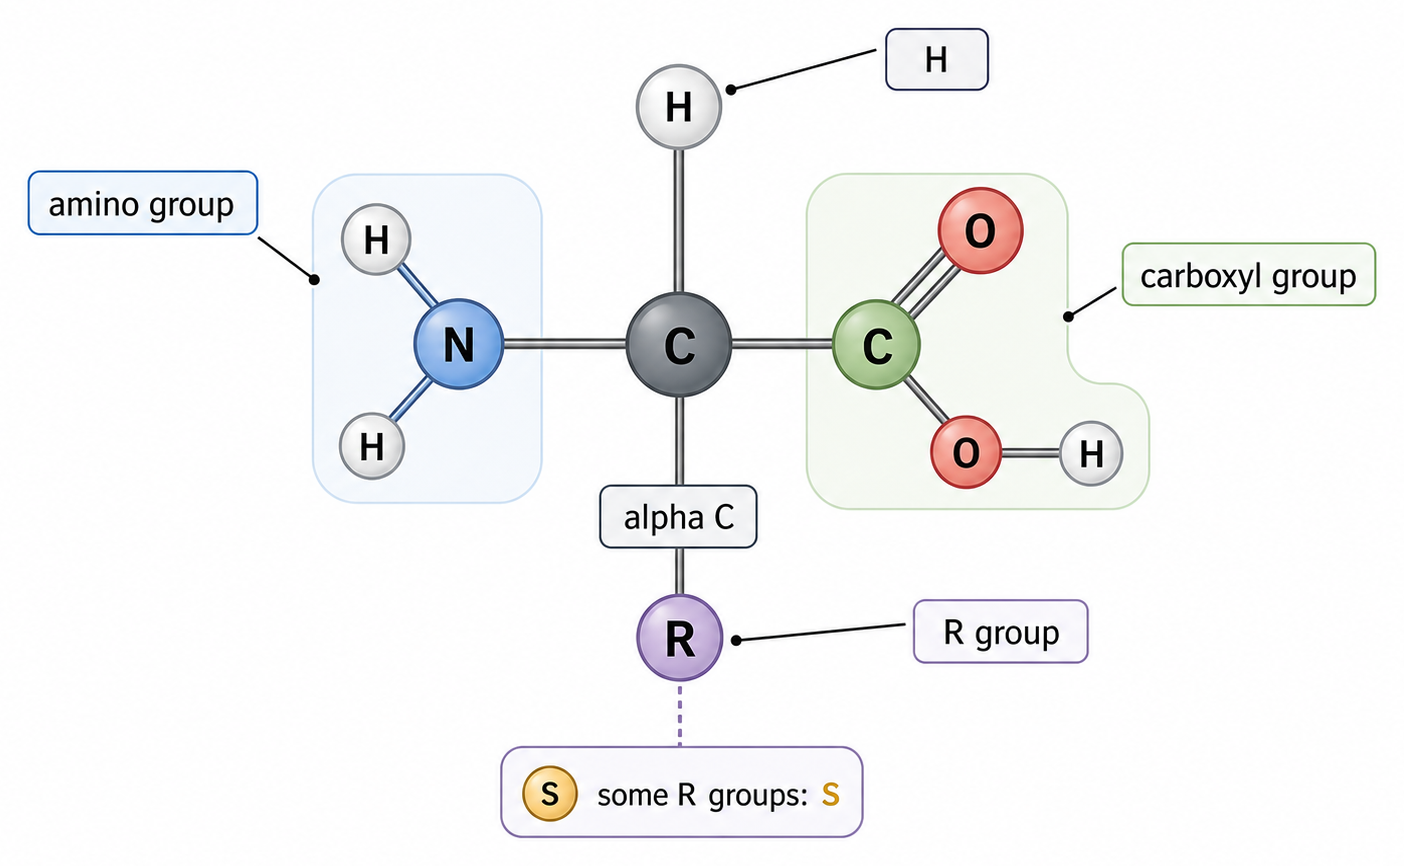
Every protein amino acid has an α-carbon bonded to an amine group, a carboxyl group, a hydrogen atom and a variable R-group. The shared groups form peptide bonds; the R-group changes charge, polarity, size and reactivity. Proteins contain C, H, O and N, and usually S in sulfur-containing R-groups.
Amine and carboxyl groups: shared parts that build the repeating backbone.
R-group: variable part that changes interactions, folding and function.
Proteins contain C, H, O and N; sulfur occurs in proteins with sulfur-bearing R-groups.
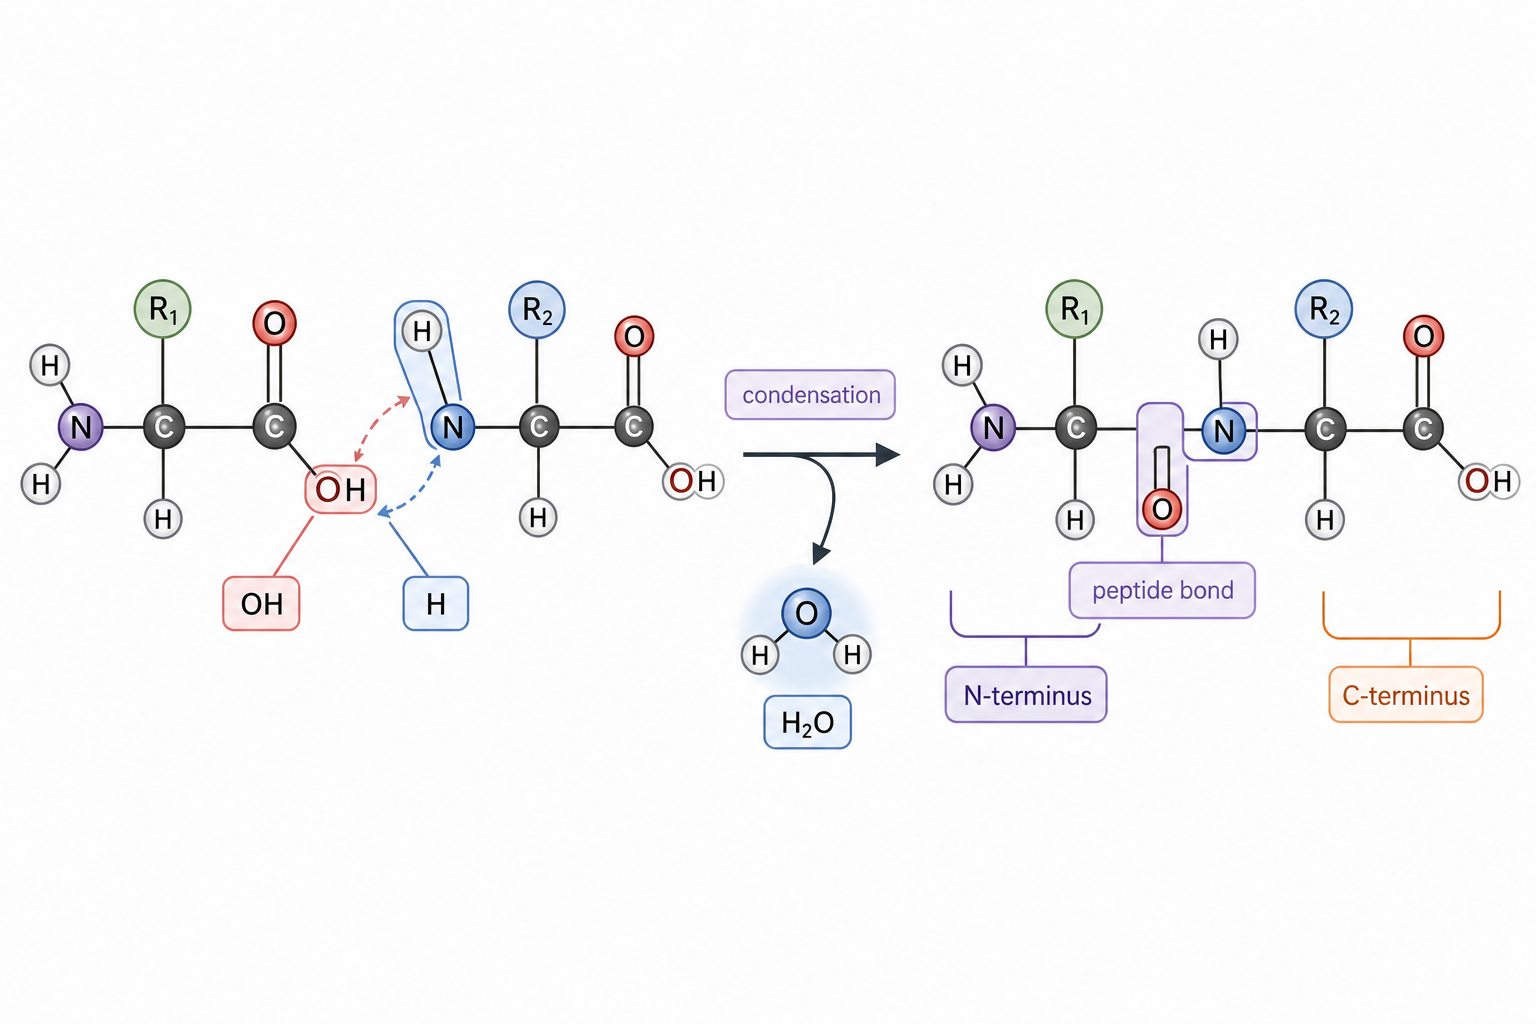
Condensation forms peptide bonds
The carboxyl group of one amino acid loses OH and the amine group of another loses H. Water is released, and the remaining carbon and nitrogen form a covalent C–N peptide bond.
Two residues form one peptide bond and release one water molecule; joining n residues forms n−1 peptide bonds and releases n−1 waters. Ribosomes repeat this reaction to assemble a chain with N- and C-termini.
The scarcest amino acid limits protein synthesis
Category
Supply to the body
Essential
cannot be synthesized in sufficient quantity; must come from food
Non-essential
can be produced from other molecules, often by transamination in the liver
Dietary protein → digestion → absorbed amino acids → amino-acid pool → ribosomes. If one required essential amino acid is scarce, it becomes limiting and synthesis of proteins containing it slows even when other amino acids are abundant.
A varied, sufficient plant-based diet can supply all essential amino acids. “Non-essential” means synthesizable, not unimportant.
Sequence order creates enormous protein diversity
Protein variety depends on amino-acid type, number and order.
P=An
P counts sequences, A amino-acid types and n chain length. With 20 coded amino acids, P=20n and 205=3,200,000. Genes specify residue order; the proteome is the set of proteins a cell, tissue or organism expresses. Sequence positions R-groups and creates folding possibilities, although not every sequence is functional.
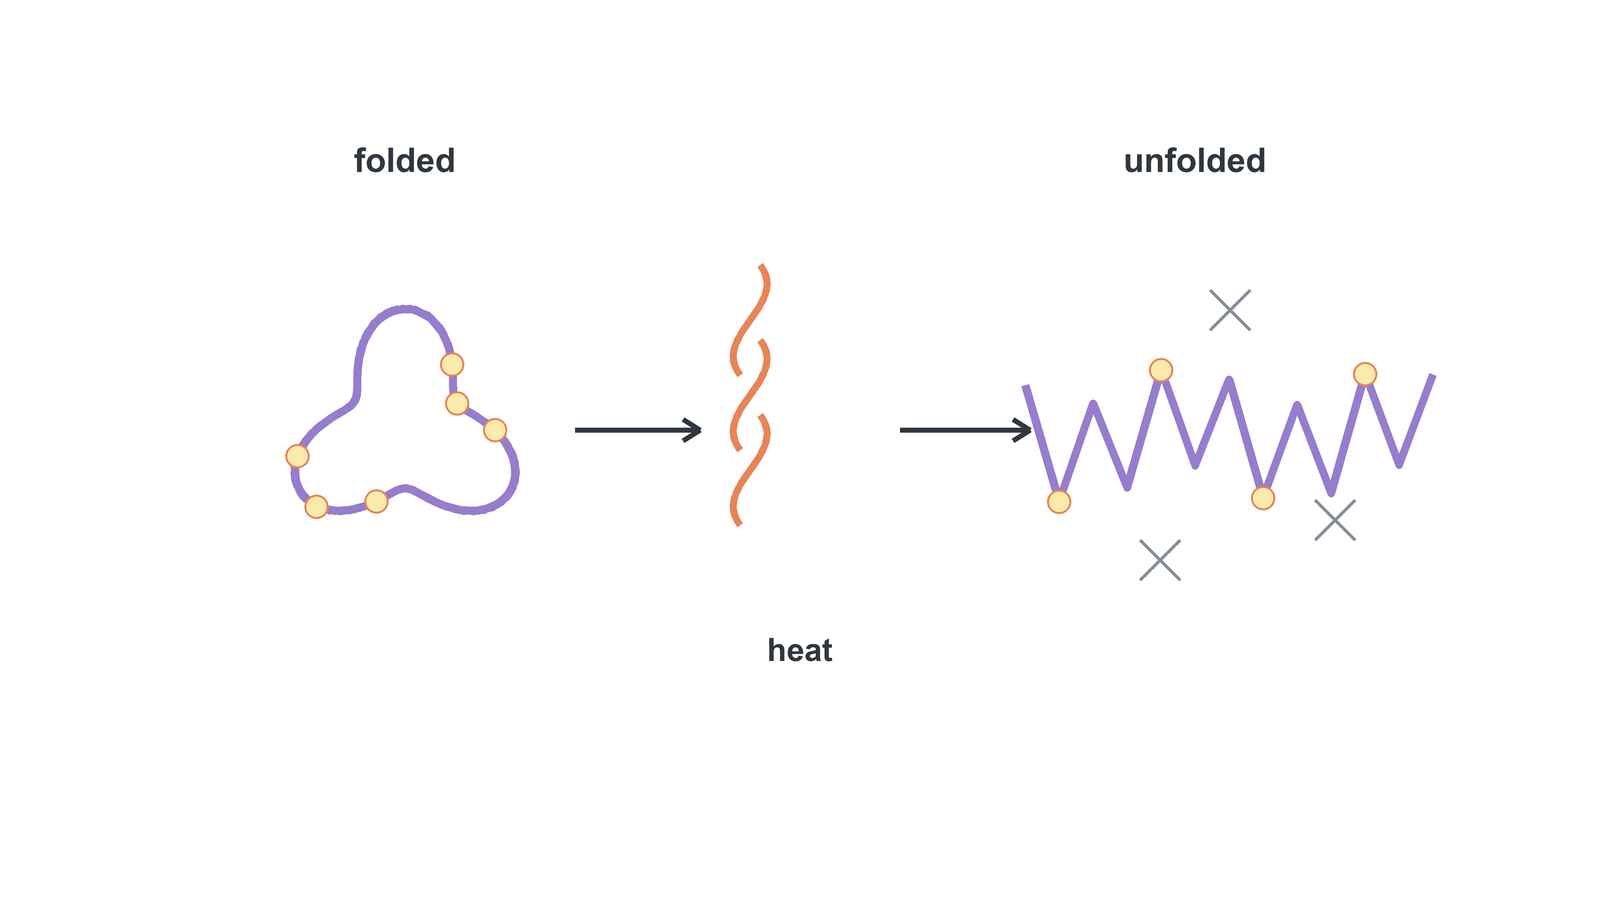
Heat and pH can denature a protein
Change
Molecular effect
Consequence
High temperature
weak interactions break
fold and binding surfaces, including active sites, change
Extreme pH
R-group charges change
ionic attractions and H-bonds break
Denaturation changes conformation and function but usually leaves the amino-acid sequence intact. Refolding requires the original interactions to reform before aggregation.
Checkpoint: build a protein, then identify what can limit it
Shared amino-acid groups condense → peptide bonds build a directional backbone → genetic information specifies residue order → positioned R-groups create folding possibilities.
Limiting change
Mechanism
Consequence
Essential amino acid unavailable
a required monomer is missing
synthesis of affected proteins slows
High temperature
stabilizing interactions are disrupted
conformation and function may be lost
pH away from optimum
R-group charges change
ionic attractions and H-bond patterns can be disrupted
R-group chemistry creates a toolkit of interactions
HL only
R-group property
Possible interaction
Typical consequence in water
Polar, uncharged
Hydrogen bonding
Often compatible with an exposed surface
Acidic or basic
Ionic attraction when oppositely charged
Contacts can change when pH changes charge
Non-polar
Hydrophobic clustering
Often protected from water in a soluble protein
Two cysteines
Covalent disulfide bridge after oxidation
Strong cross-link within or between chains
Hydrophobic clustering is driven by the surrounding water; it is not a conventional bond between non-polar R-groups. These are tendencies rather than fixed locations, because local environment and protein function also matter.
Primary structure positions folding chemistry
HL only
Primary structure is the exact number and order of residues in a polypeptide. DNA is transcribed into mRNA, and translation fixes that order. The sequence therefore decides where each R-group appears and which residues may meet when the chain folds.
Replacing a non-polar residue in a buried core with a charged one can remove a hydrophobic contact and introduce an unfavourable charge.
Replacing cysteine can remove a possible disulfide bridge that held distant parts of the chain together.
A substitution has no automatic outcome. Its effect depends on the new R-group and whether that position contributes to the core, surface, active site or binding interface.
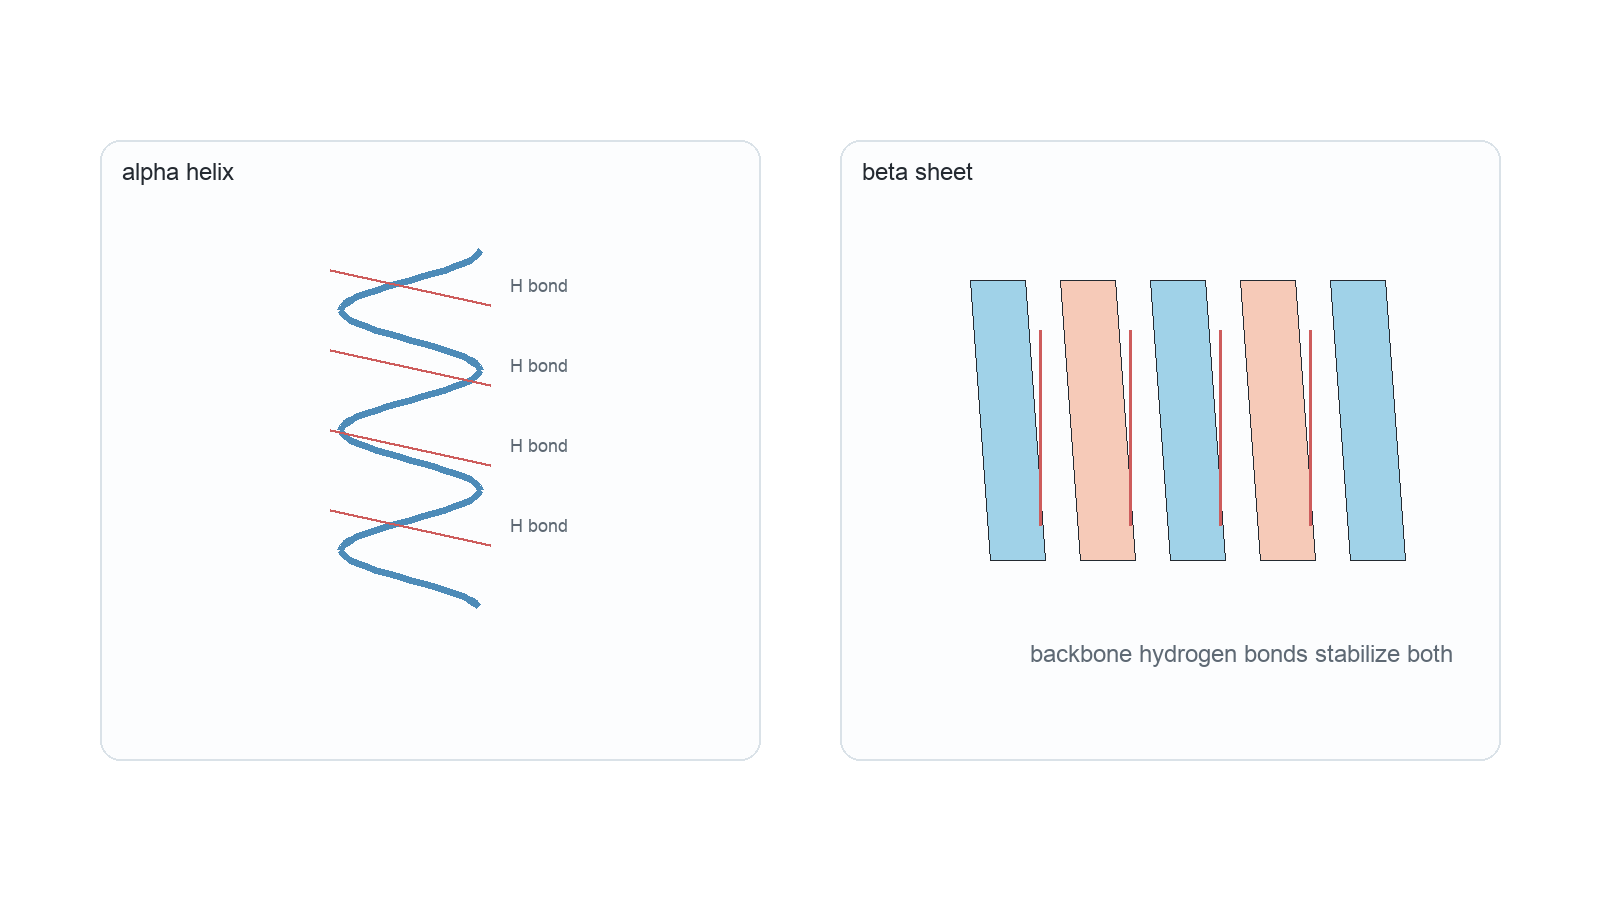
Backbone H-bonds make helices and sheets
HL only
Pattern
Arrangement
Stabilizing basis
α-helix
one segment coils
repeated backbone C=O···H–N bonds
β-sheet
strands align
repeated H-bonds between backbone segments
Secondary structure is local backbone geometry; R-groups project away. These motifs can combine into domains such as coiled coils or β-sandwiches. The complete 3D shape of one chain is tertiary structure.
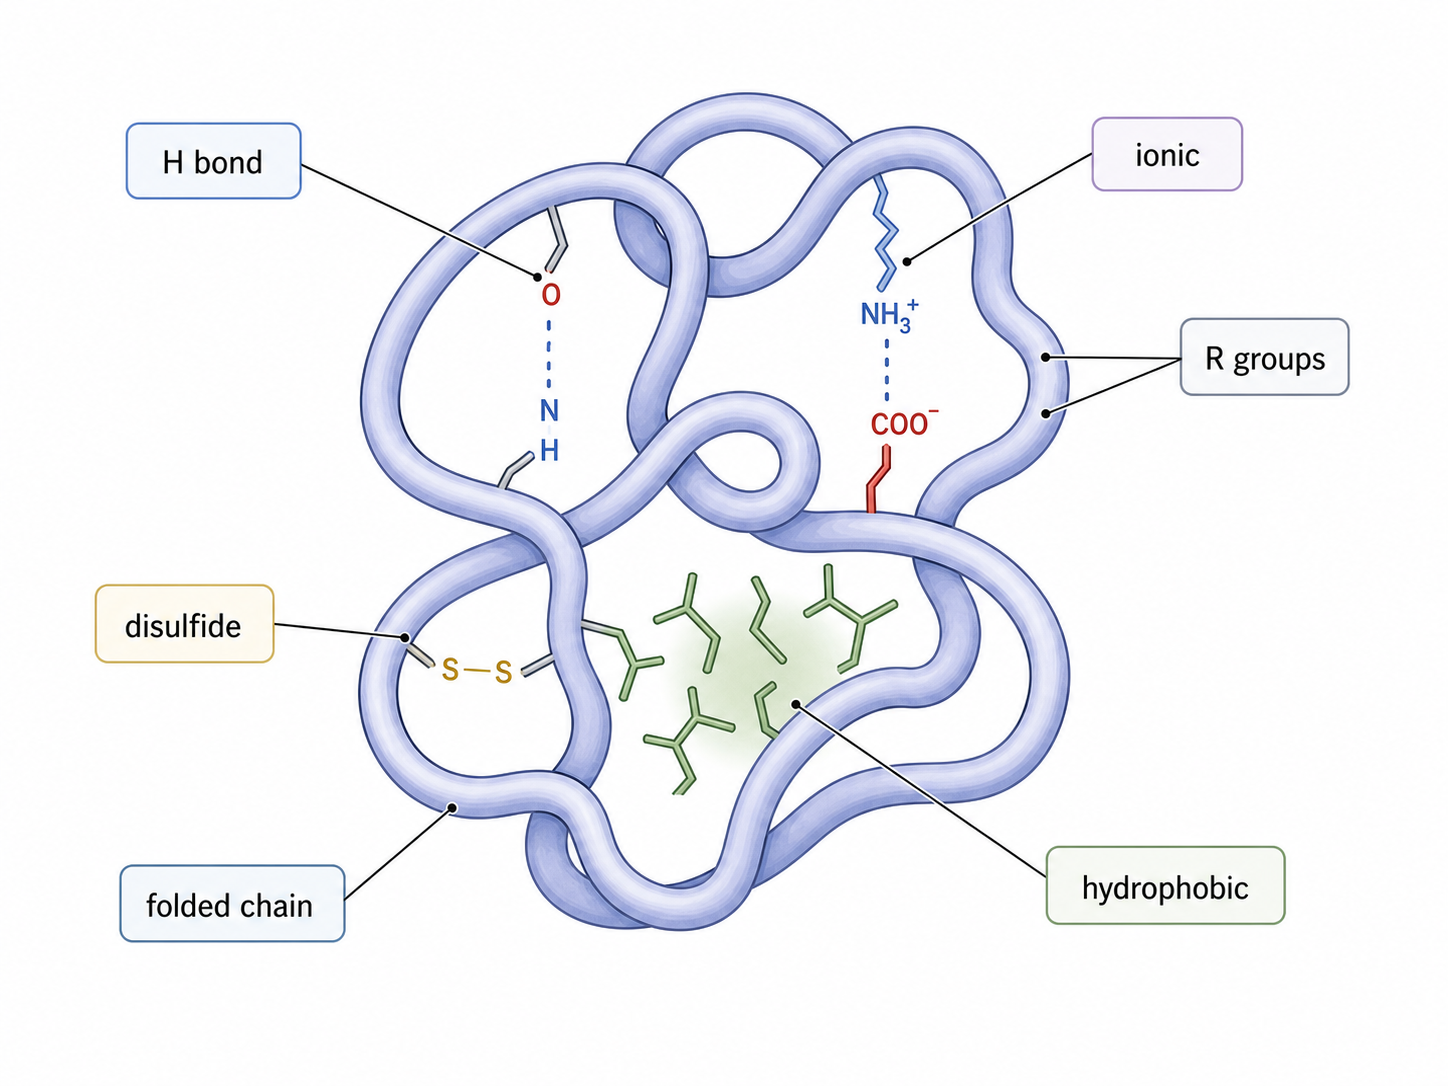
Tertiary structure brings distant residues together
HL only
Tertiary structure is the unique overall three-dimensional fold of one polypeptide. Folding brings residues that may be far apart in the primary sequence close together, allowing their R-groups to stabilize the same compact shape.
Polar R-groups can form hydrogen bonds.
Oppositely charged R-groups can form ionic attractions that are sensitive to pH.
Two cysteines can form a strong covalent disulfide bridge.
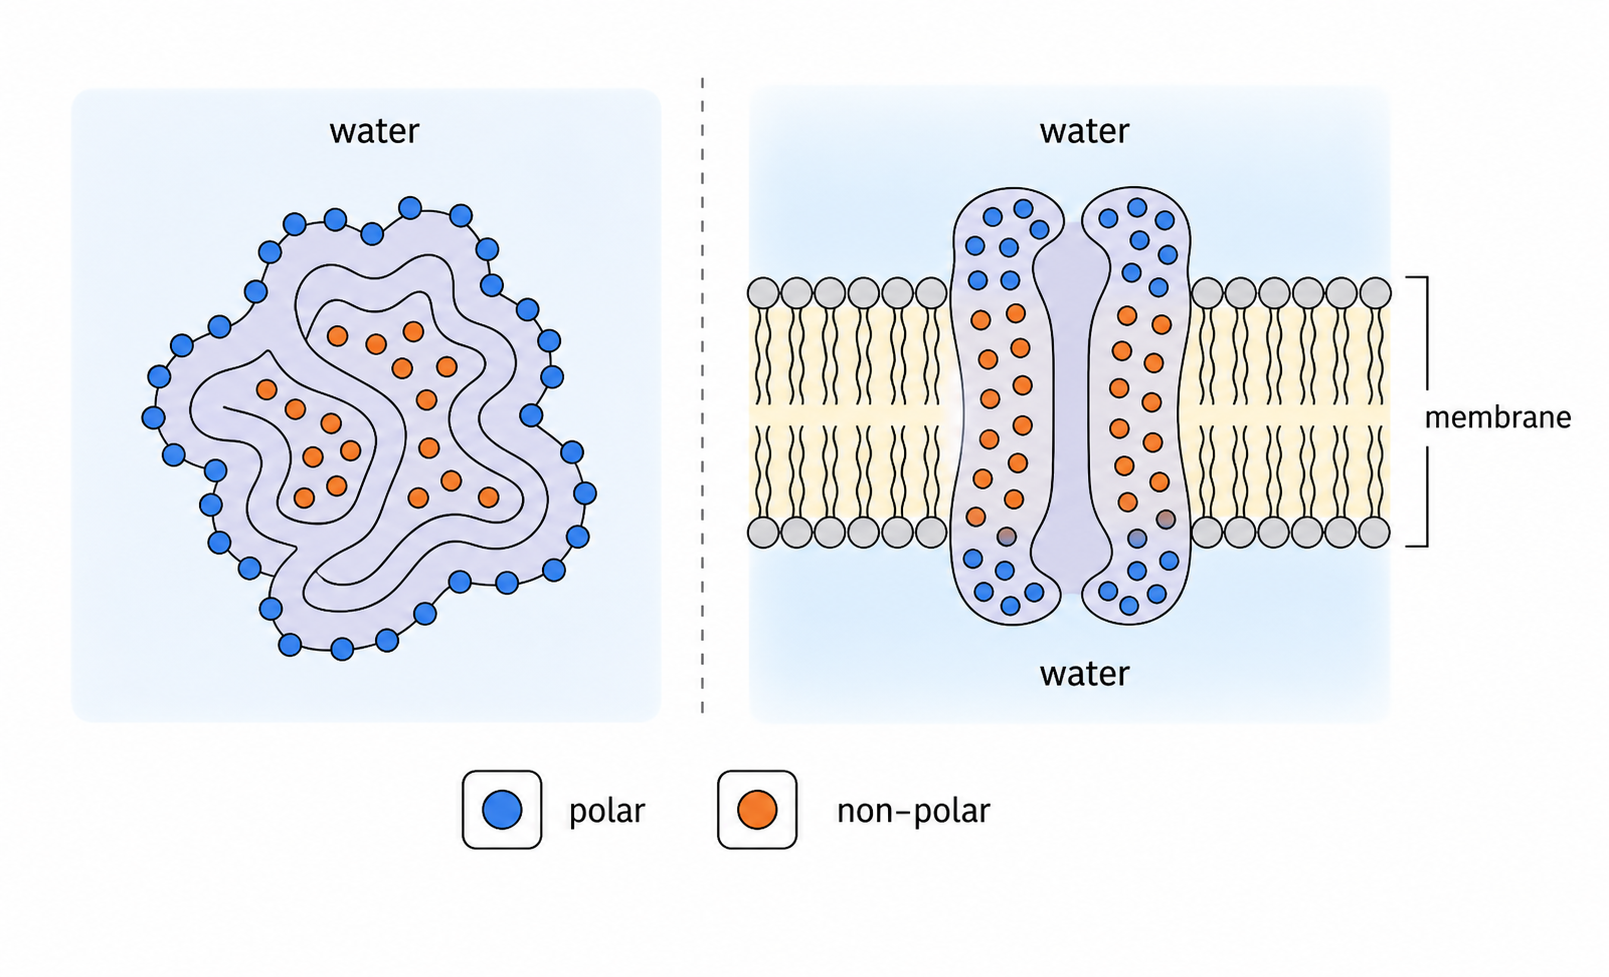
Non-polar R-groups tend to cluster away from water through the hydrophobic effect.
Many weak interactions cooperate across the folded chain, while disulfide bridges provide stronger cross-links. Peptide bonds still belong to the primary backbone; they are not the interactions that define tertiary folding.
A residue's surroundings help determine where it can sit
HL only
Soluble globular protein: non-polar residues commonly cluster in a protected core; polar or charged residues can face water.
Integral membrane surface: non-polar residues can face phospholipid tails.
Water-filled channel: polar or charged residues can line the pore while a non-polar exterior contacts lipid tails.
There is no universal rule that polar residues are always “outside” and non-polar residues are always “inside.” Ask: inside or outside relative to which chemical environment?
Quaternary structure and conjugated proteins
HL only
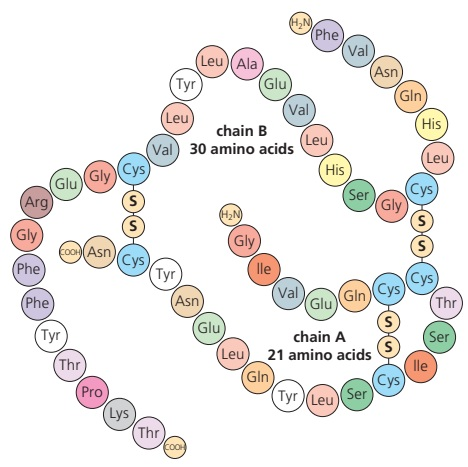
Quaternary structure arranges two or more polypeptide chains. A conjugated protein also contains a required non-protein prosthetic group.
Protein
Assembly
Extra group?
Insulin
A + B chains
none
Collagen
three-chain helix
none
Haemoglobin
2α + 2β
four Fe-containing haem groups
Count chains for quaternary structure; check separately for a prosthetic group.
Insulin and collagen show how form supports function
HL only
Feature
Insulin: globular signal
Collagen: fibrous tensile cable
Overall form
Compact two-chain molecule
Long triple helix assembled into fibrils
Solubility
Soluble enough for transport in blood
Insoluble structural material
Sequence and interactions
Three disulfide bridges stabilize a precise receptor-binding surface
Glycine every third residue fits the helix centre; H-bonds and covalent cross-links stabilize fibres
Functional consequence
Reaches target cells and binds its receptor specifically
Staggered molecules and cross-links resist stretching
Globular and fibrous are useful categories only when connected to mechanism. Shape, solubility, residue sequence, molecular interactions and biological role together explain why insulin can signal while collagen can bear tension.
In collagen, triple helices lie parallel in a staggered arrangement, so weak points do not line up; covalent cross-links between neighbouring molecules add tensile strength.
Summary: trace protein sequence to function
HL only
Primary: residue order positions R-groups.
Secondary: backbone hydrogen bonds make local helices and sheets.
Tertiary: distant R-groups stabilize one chain’s complete fold.
Quaternary, when present: several folded chains assemble; conjugated proteins also require a non-protein group.
Sequence → positioned chemistry → local patterns → distant contacts → possible subunit assembly → functional shape and surface. A substitution changes one R-group, pH changes some charges; the effect depends on where the affected interaction sits.
Generalized amino acid structure
[ 3 ]
The molecules of all amino acids include an amine group, a carboxyl group and an R-group. Draw a diagram to show the structure of an amino acid molecule.
Drawing canvas
Condensation reactions
[ 4 ]
Draw molecular diagrams to show the condensation reaction between two amino acids to form a dipeptide.
Drawing canvas
Dietary amino acids
[ 2 ]
Some of the twenty amino acids that are linked together to make polypeptides in human cells are essential in the diet and others are not. Distinguish between essential and non-essential amino acids.
Infinite variety of peptide chains
[ 7 ]
Cells produce a large variety of proteins with different sequences of amino acids. Explain how this is done.
Effect of pH and temperature
[ 4 ]
Outline the process of protein denaturation.
Chemical diversity in R-groups
HL only
[ 2 ]
Discuss briefly whether amino acids on the surface of the protein are likely to be polar or non-polar.
Primary structure impact
HL only
[ 1 ]
Hemoglobin is a protein made up of two alpha and two beta polypeptide chains. In sickle cell anemia, a mutation causes one glutamic acid in each beta chain to be replaced by valine, as shown in the image.
Normal beta chain
Sickle beta chain
How does this mutation in hemoglobin cause sickle cell anemia?
Secondary structure
HL only
[ 3 ]
Explain the secondary structure of this protein molecule.
Tertiary structure
HL only
[ 2 ]
The R-groups of amino acids are very diverse chemically. Interaction between R-groups in different parts of a polypeptide helps to determine the tertiary structure of a protein. List two types of interaction between R-groups.
Effect of polar/non-polar amino acids
HL only
[ 3 ]
Explain the significance of polar and non-polar amino acids in proteins.
Quaternary structure
HL only
[ 1 ]
This diagram shows the amino acids present in a molecule of insulin, using three-letter abbreviations.
What describes the structure of insulin?
Globular vs. fibrous proteins
HL only
[ 3 ]
Distinguish between fibrous proteins and globular proteins.
B2.1 Membranes and membrane transport
Membranes and membrane transport link bilayer structure, membrane proteins, selective permeability, gradients, and vesicle movement to cellular control; Students connect membrane structure to transport mechanisms across cellular boundaries.
Syllabus
First assessment 2025
Topic
B2.1
Level
HL
Amphipathic Lipids Close into a Bilayer
A phospholipid has a hydrophilic phosphate head and two hydrophobic fatty-acid tails. In water, these interactions drive spontaneous bilayer formation.
heads face water + tails hide from water → continuous bilayer → exposed edges close → sealed membrane or vesicle
The Hydrophobic Core Creates Unequal Permeability
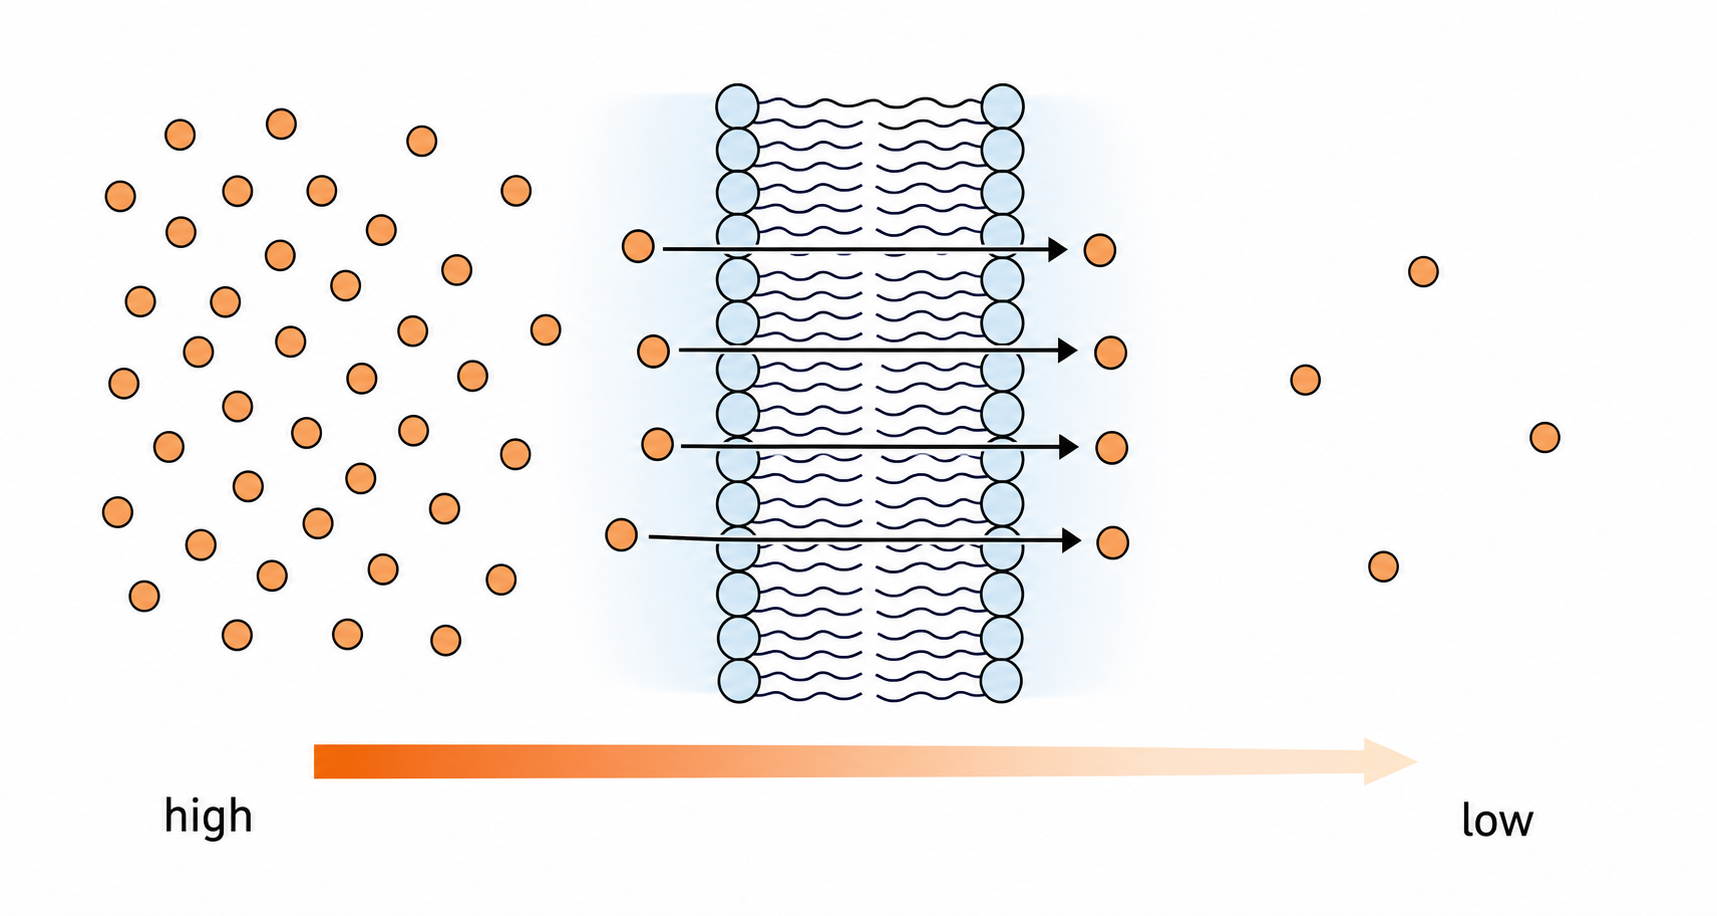
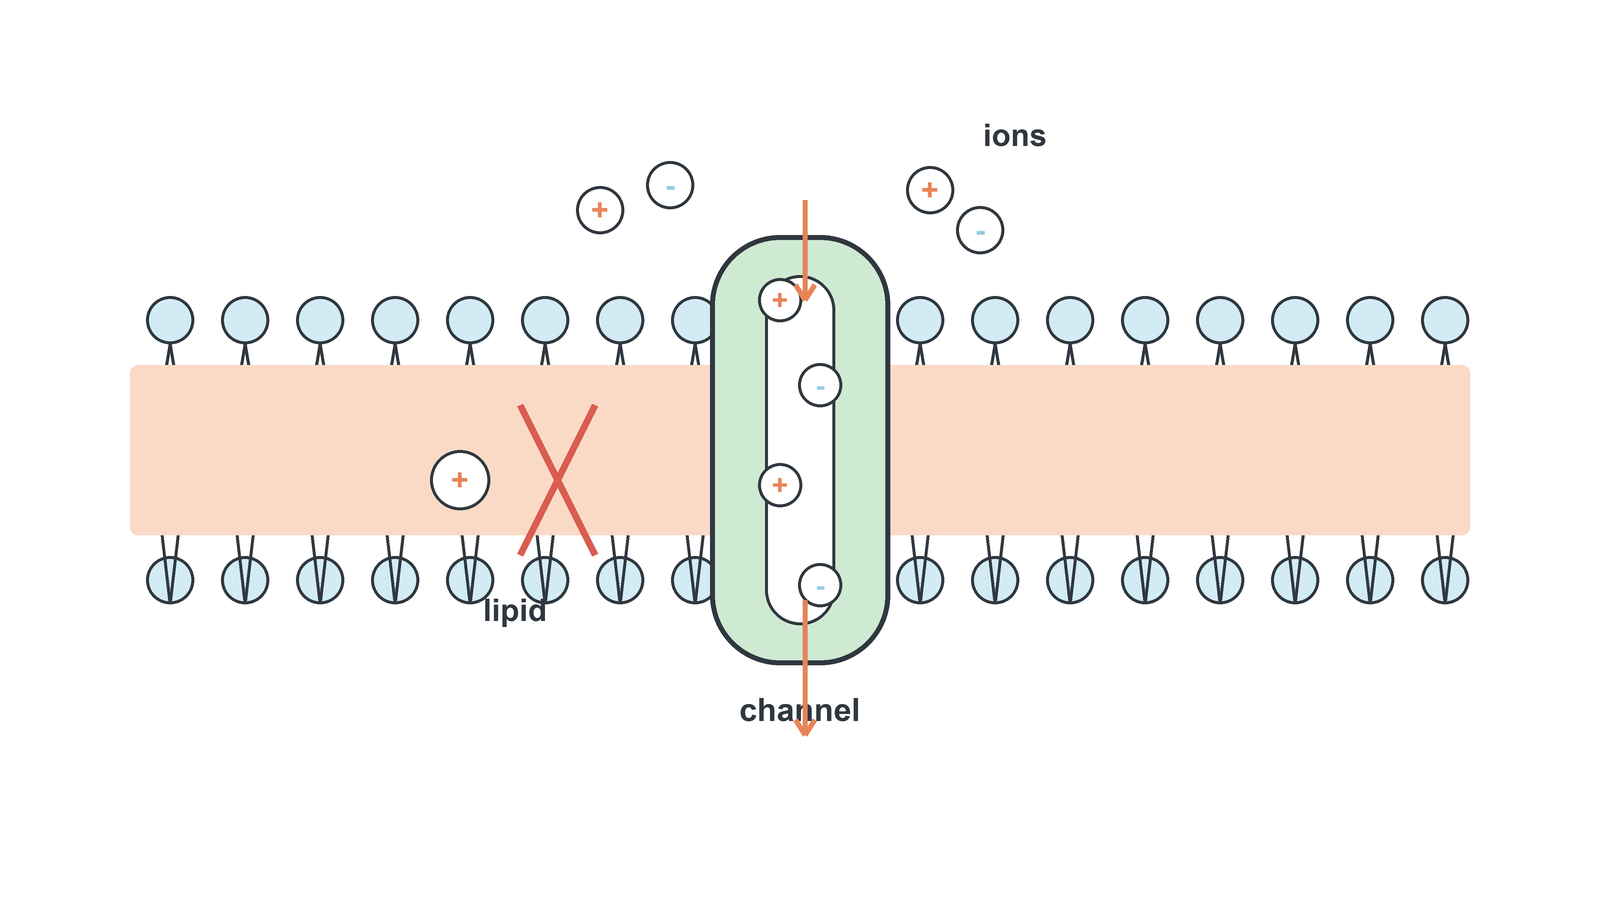
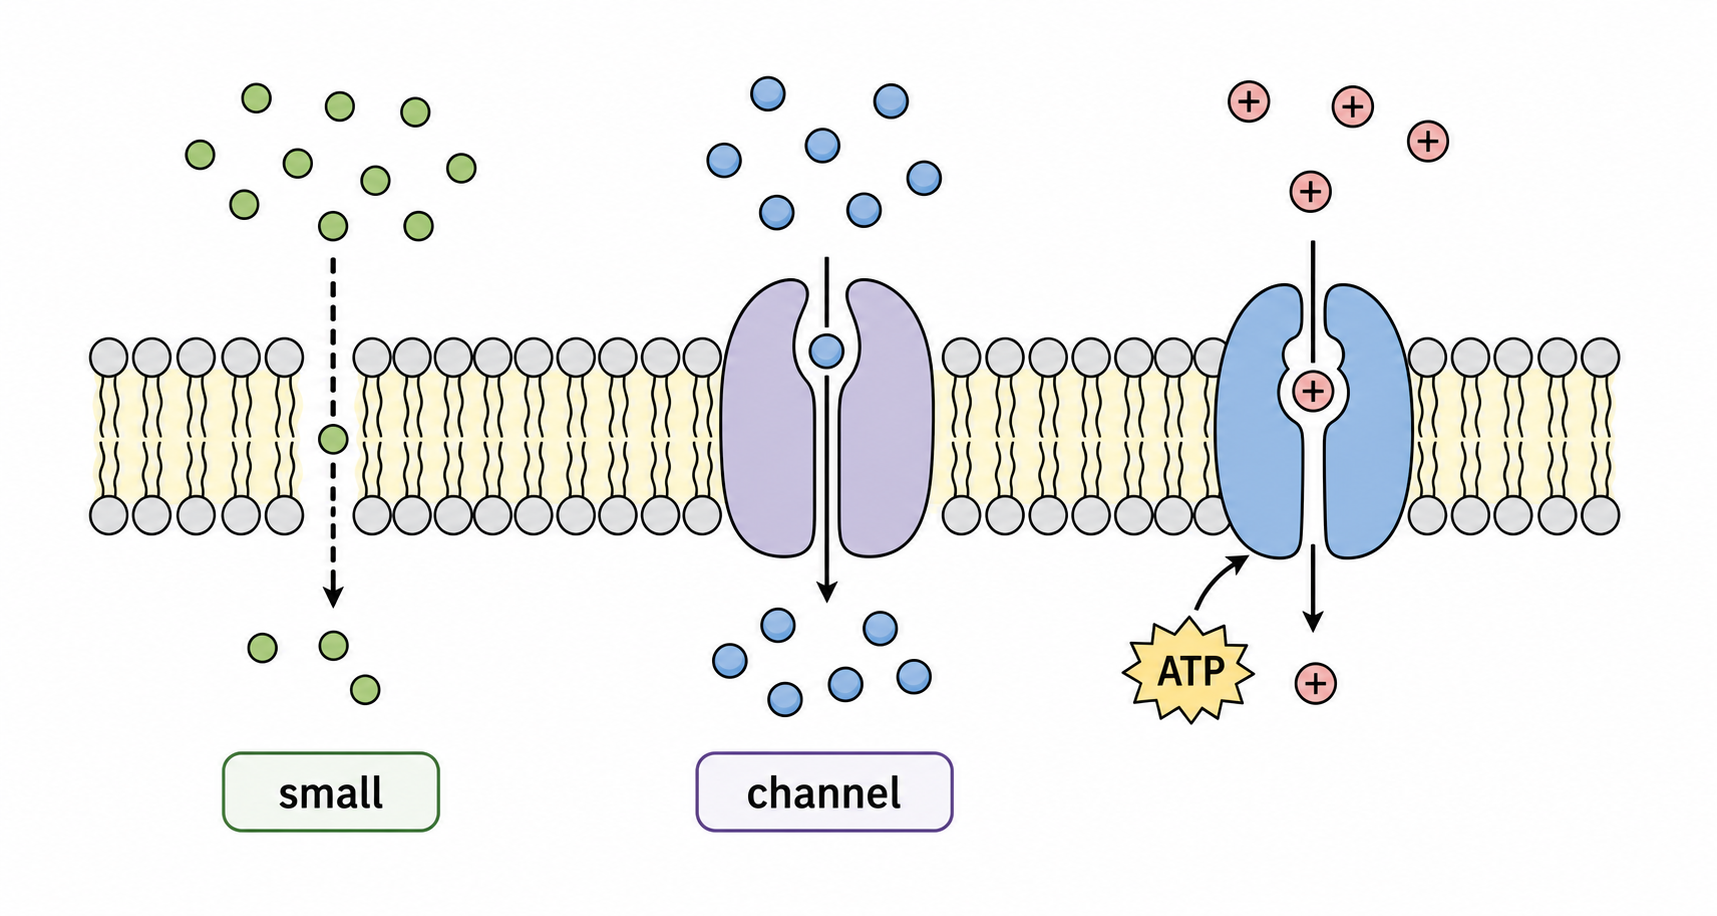
The bilayer core allows small non-polar molecules through most easily, slows small uncharged polar molecules, and strongly blocks ions and large hydrophilic solutes.
O₂ and CO₂ → simple diffusion.
Water → limited bilayer diffusion, much faster through aquaporins.
Ions, glucose and large polar molecules → specific proteins or vesicles.
A membrane separates aqueous compartments because it is selectively permeable, not completely impermeable.
Random Motion Produces Net Diffusion
Diffusion is passive net movement from higher to lower concentration, driven by random kinetic motion. Particles continue moving both ways at equilibrium, but net movement becomes zero.
Steeper gradient + larger surface area + higher temperature → faster diffusion. Greater distance or membrane thickness → slower diffusion.
Protein Position Constrains Membrane Function
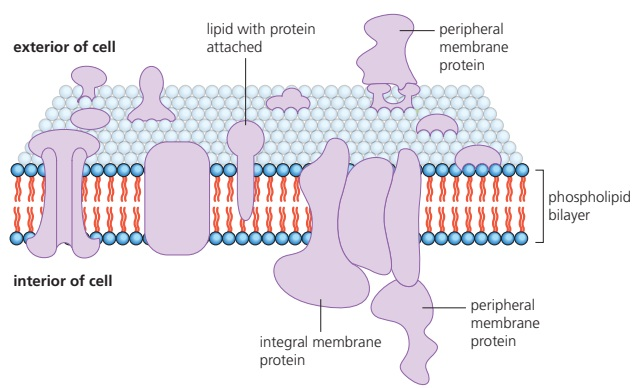
Integral proteins enter the hydrophobic bilayer and may span it; peripheral proteins attach to one membrane surface or to another protein.
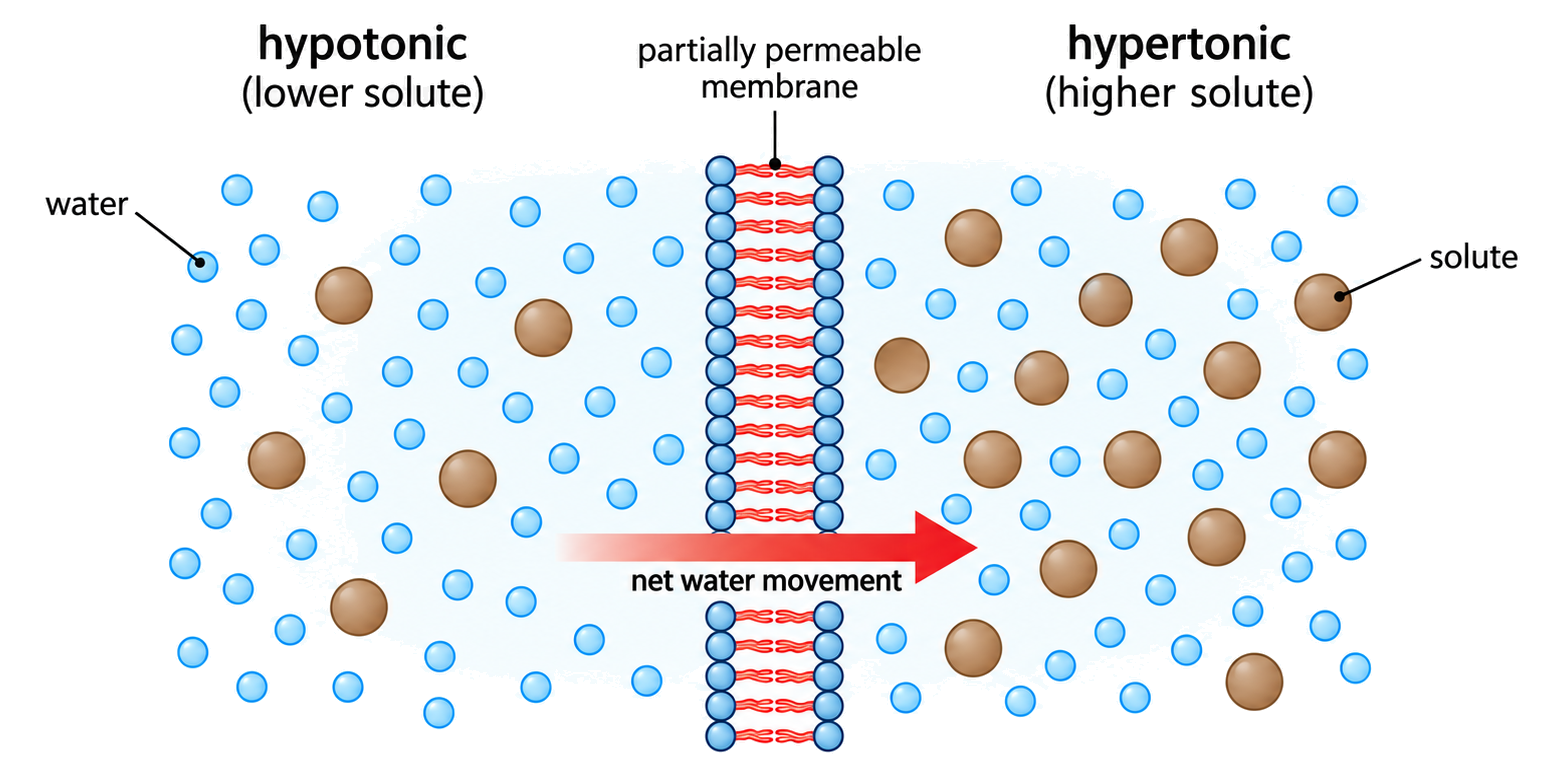
Osmosis is passive net movement of water across a partially permeable membrane from higher water potential to lower water potential.
Lower solute concentration → higher water potential.
Higher solute concentration → lower water potential.
Aquaporins raise the rate but do not change the direction.
Channels Provide Selective Downhill Routes
A channel is a hydrophilic pore that permits selected ions or molecules to diffuse down an electrochemical gradient without ATP.
Pore diameter + charge + chemical lining determine selectivity. Some channels remain open; gated channels change between closed and open states.
ATP Drives a Pump Uphill
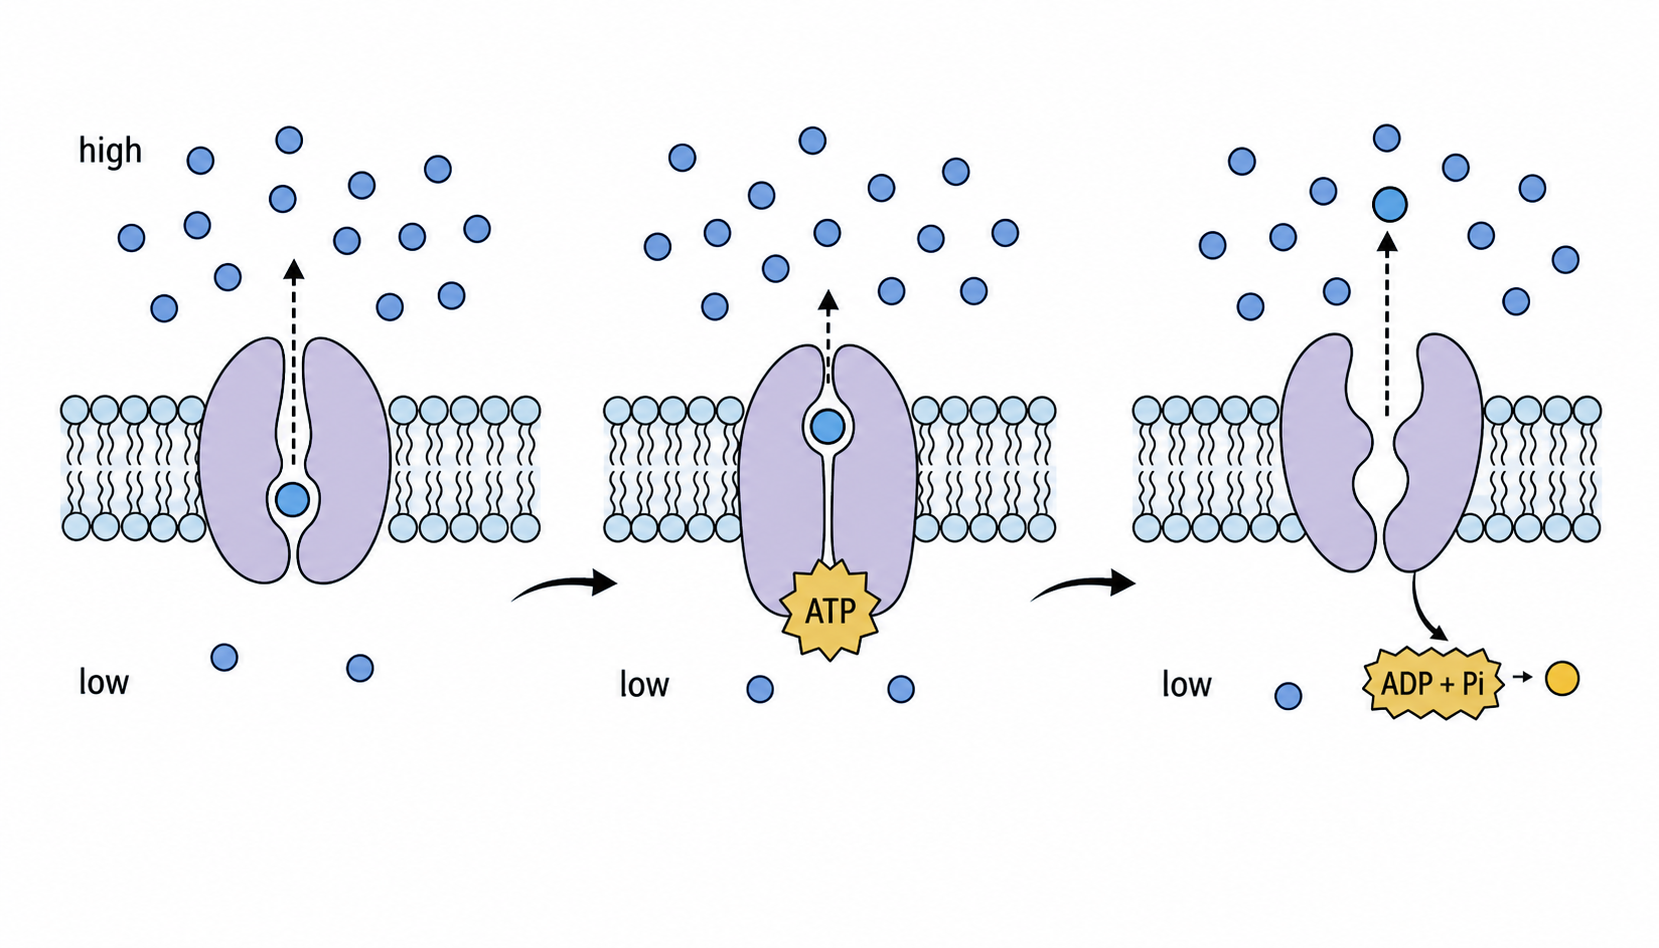
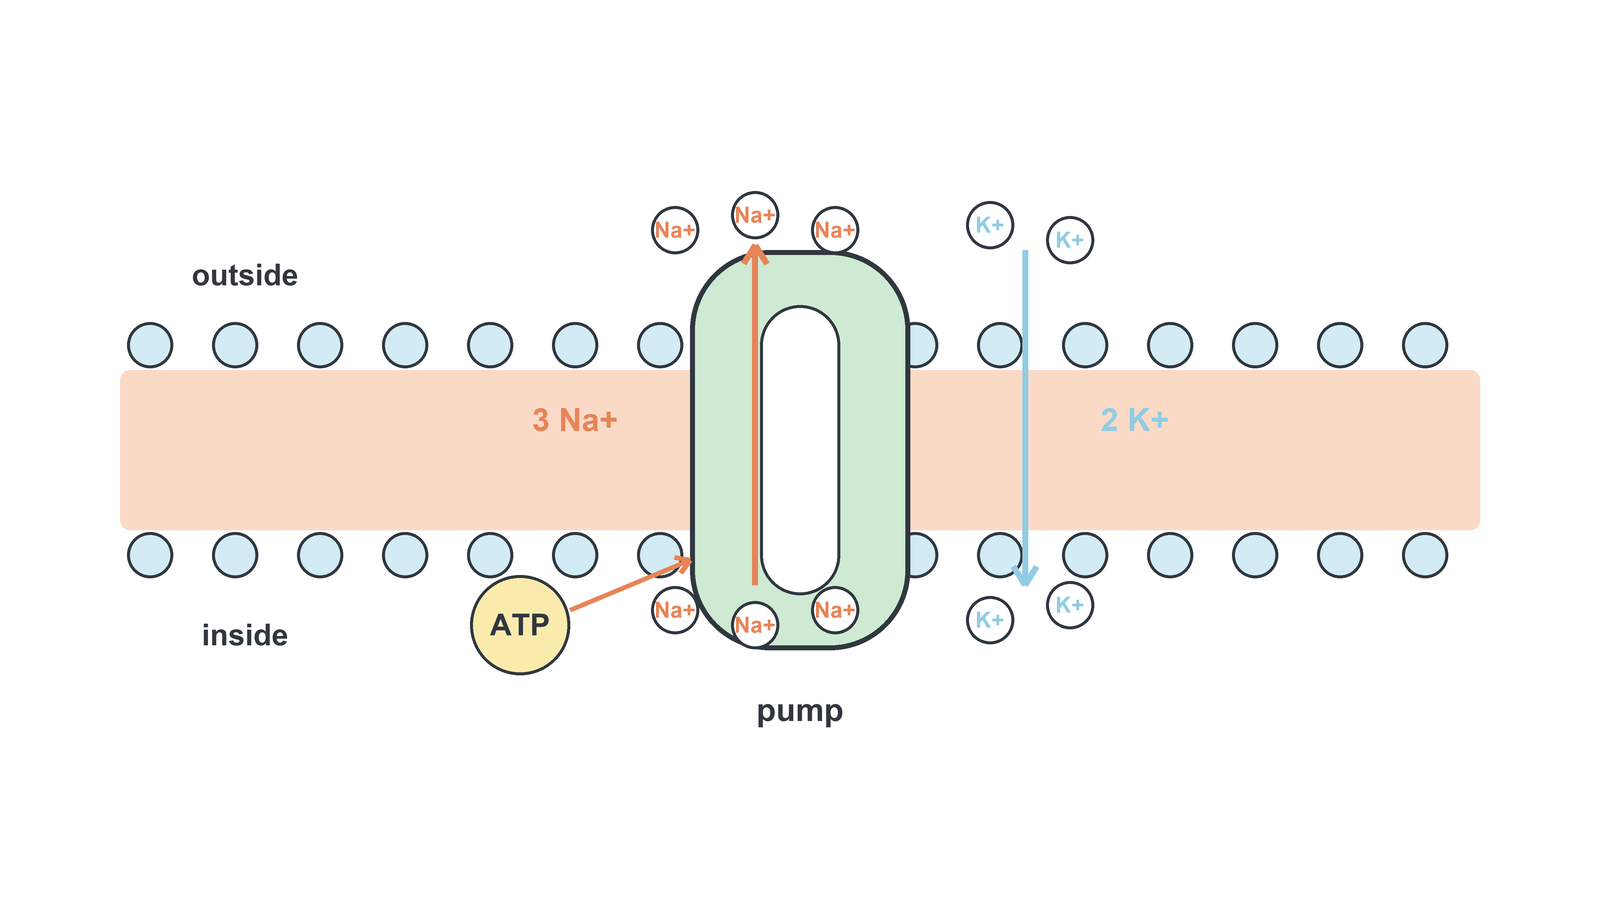
A pump binds a specific solute and couples ATP hydrolysis to a shape change that moves it against its concentration or electrochemical gradient.
bind on one side → ATP transfers energy, often by phosphorylation → conformation changes → solute released uphill → pump resets
Selectivity Emerges from Lipids, Proteins and Energy
Choose a transport route from particle chemistry and gradient direction: the bilayer sorts by size and polarity; proteins add molecular recognition; ATP permits uphill movement.
small non-polar + downhill → simple diffusion
ion/polar + downhill → channel or carrier
solute + uphill → pump or coupled transporter
very large cargo → vesicle
The Glycocalyx Forms an Outward Cell Interface
Short carbohydrate chains on glycoproteins and glycolipids project only from the extracellular membrane surface. Together they form the glycocalyx.
recognition + cell adhesion + receptor interactions + antigen identity + hydration and protection at the cell surface
The carbohydrate chain does not span the bilayer and is not exposed to the cytoplasm; its orientation records membrane asymmetry.
Evidence Supports a Fluid Protein Mosaic
The fluid mosaic model describes laterally mobile lipids and many proteins arranged asymmetrically in a phospholipid bilayer.
freeze fracture → particles within membrane faces
protein extraction → integral vs peripheral attachment
fluorescent cell fusion → labelled proteins spread laterally
The bilayer creates the barrier; proteins make it selective; carbohydrates create an outward interface; component mobility makes the membrane adaptable.
Tail Packing Tunes Fluidity with Temperature
HL only
Saturated tails are straight and pack tightly; cis-unsaturated tails contain kinks and pack loosely. More unsaturation generally raises membrane fluidity.
Cooling → organisms can increase unsaturated tails to resist stiffening. Warming → more saturated/longer tails can restrain excess fluidity. This is homeoviscous adaptation.
Cholesterol Buffers Animal-Membrane Fluidity
HL only
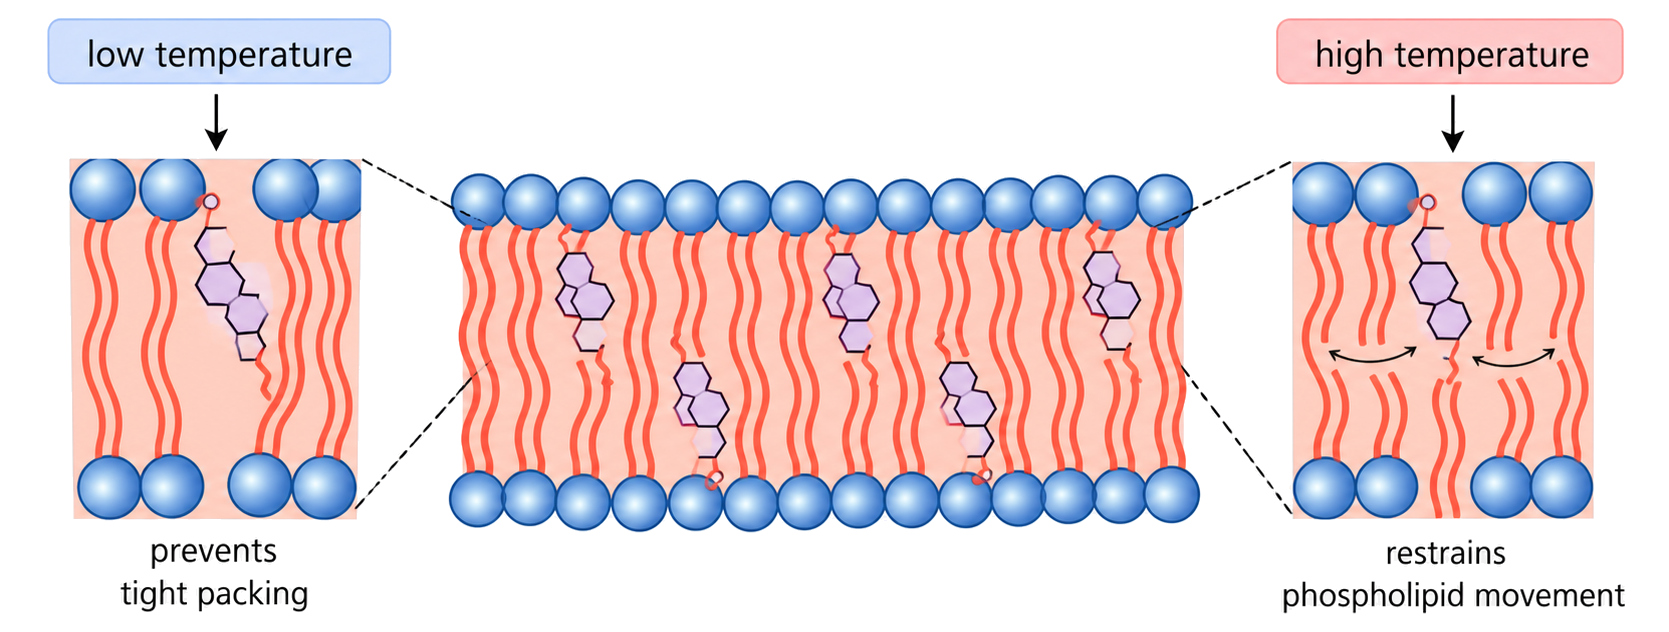
Cholesterol inserts between animal-membrane phospholipids: its polar –OH aligns near the heads while its hydrophobic rings lie among the tails.
Low temperature: prevents tight packing and stiffening.
High temperature: restrains phospholipid movement and excess fluidity.
Also lowers permeability to small water-soluble molecules.
Fluid Membranes Bud and Fuse
HL only
Because a bilayer is fluid and self-sealing, it can curve, bud and fuse while keeping aqueous contents separated from the cytosol.
Endocytosis: membrane invaginates and pinches off inward. Exocytosis: an internal vesicle fuses and releases contents outside while adding membrane.
Signals Gate Pores; Gradients Drive Ions
HL only
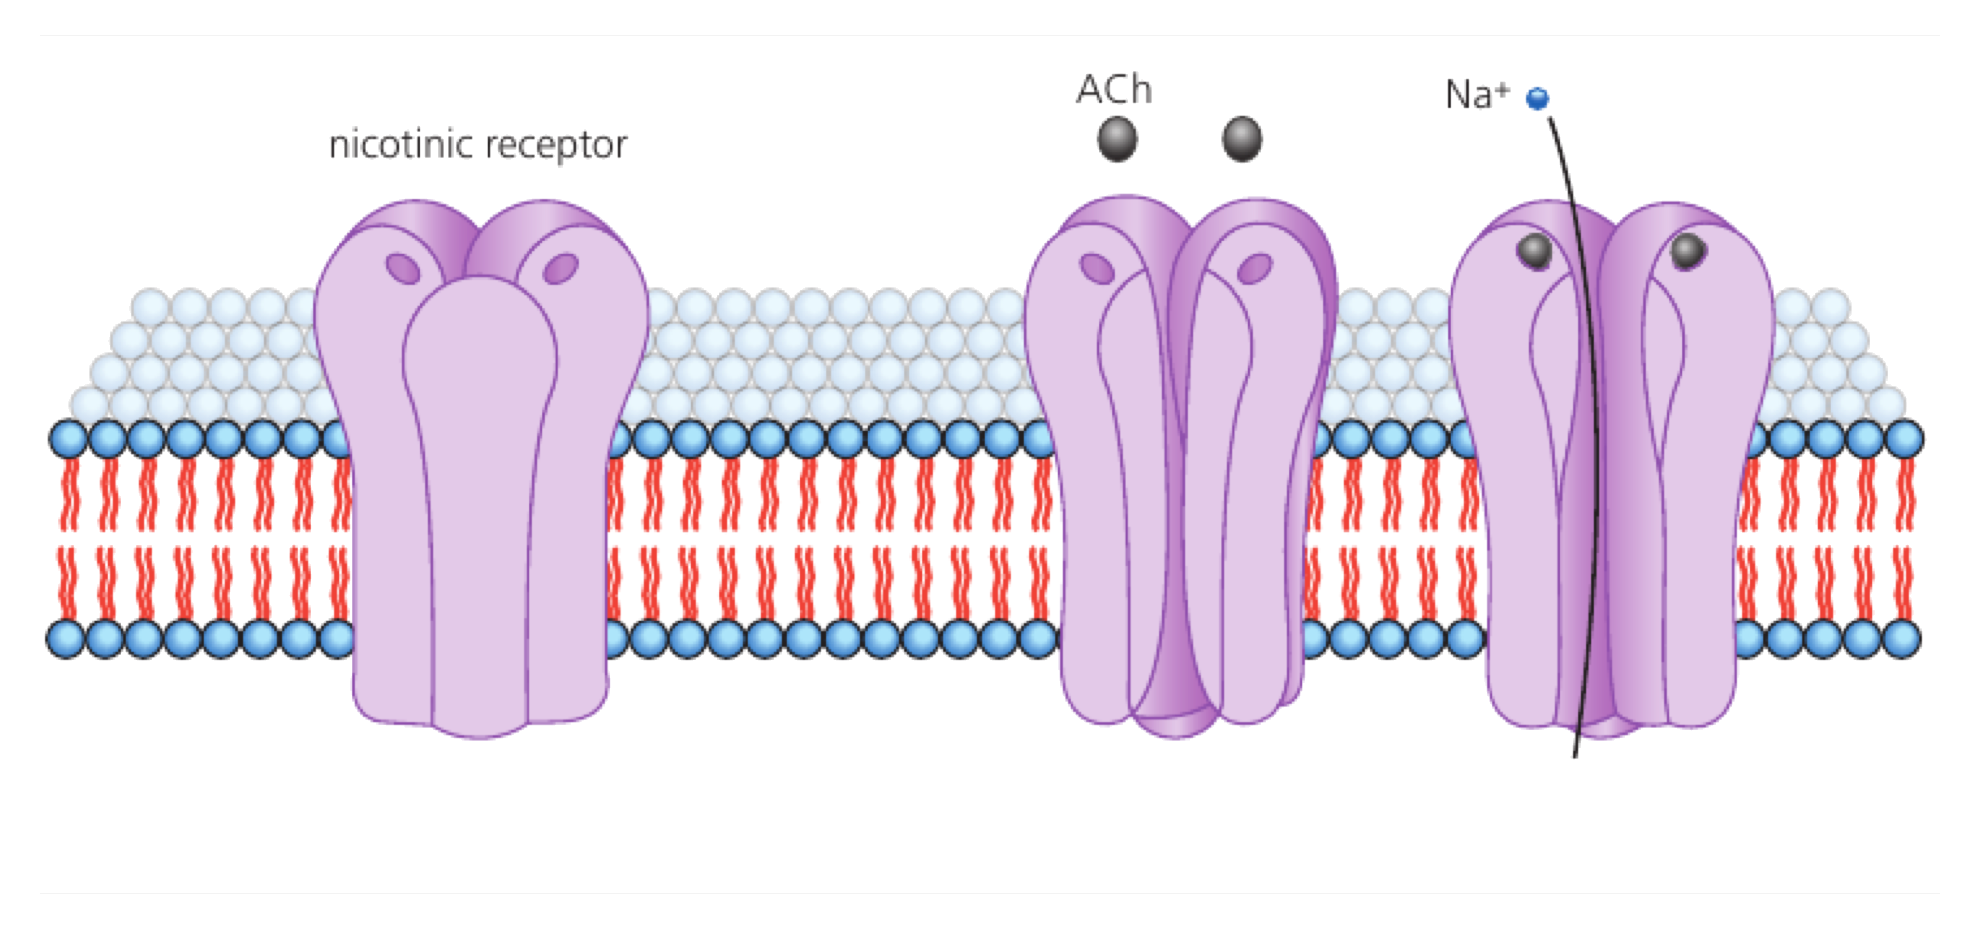
Gated ion channels are selective pores whose probability of opening changes with a signal. Once open, ions move passively down their electrochemical gradients.
Ligand-gated: chemical binding changes shape.
Voltage-gated: membrane potential changes opening.
Mechanical/other gates respond to deformation or intracellular signals.
The Sodium–Potassium Pump Stores Gradient Energy
HL only
For each ATP hydrolysed, the sodium–potassium pump moves 3 Na⁺ out and 2 K⁺ in, both against their gradients.
Unequal exchange is electrogenic and helps maintain low cytosolic Na⁺, high cytosolic K⁺ and the gradients used in nerve signalling and cotransport.
A Sodium Gradient Pays for Uphill Glucose Entry
HL only
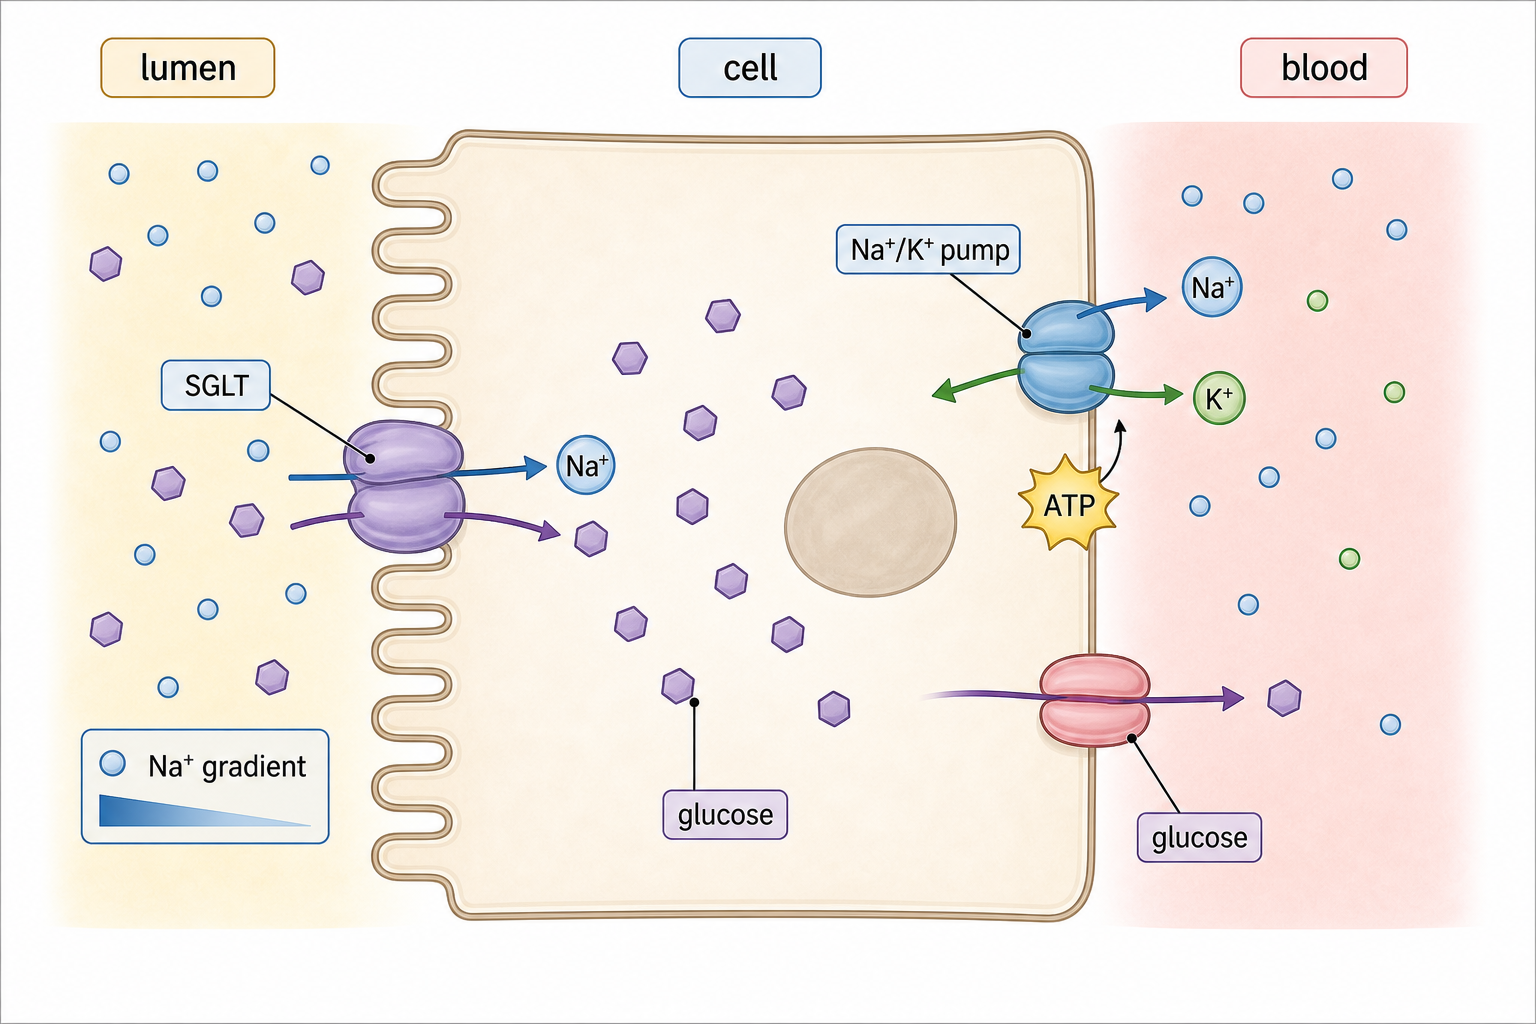
In intestinal and kidney epithelia, SGLT cotransports Na⁺ downhill with glucose uphill across the apical membrane. The Na⁺ gradient supplies the immediate energy.
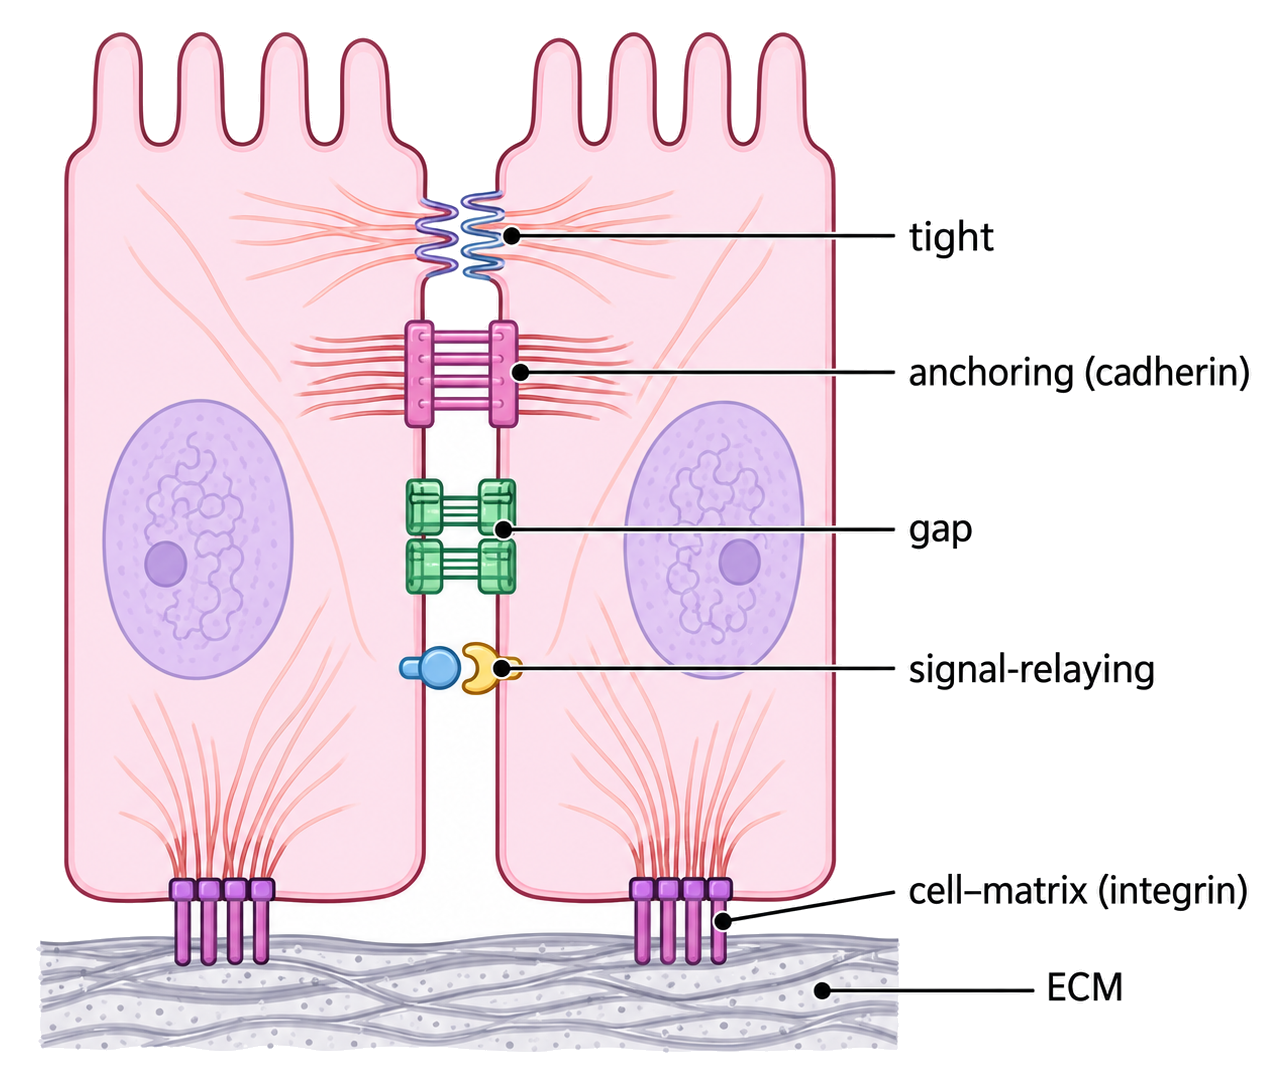
Cell-adhesion molecules connect cells to one another or to extracellular matrix, linking membrane recognition with tissue strength, sealing, communication and signalling.
cadherins → cell–cell anchoring
integrins → cell–matrix attachment and signalling
tight junctions → seal
gap junctions → direct small-molecule/ion communication
HL Summary: From Membrane Chemistry to Tissue Function
HL only
tail saturation + cholesterol → controlled fluidity → budding/fusion and protein mobility → gated transport + maintained gradients → coupled uptake and cell adhesion
Channels dissipate electrochemical gradients; ATP-driven pumps rebuild them; cotransporters spend the stored gradient. CAMs then use the membrane as a mechanical and signalling interface between cells.
Lipid bilayers as basis
[ 8 ]
Cell membranes separate aqueous environments in cells. Explain how the properties of phospholipids help to maintain the structure of cell membranes.
Drawing canvas
Bilayers as barriers
[ 1 ]
Neural pathways in living brains can now be mapped by tracking the movement of water molecules inside axons. What keeps water molecules inside axons?
Simple diffusion
[ 3 ]
Explain how the rate of diffusion of oxygen into a cell is affected by the concentration of oxygen outside of the cell.
Integral and peripheral proteins
[ 4 ]
Describe the functions of proteins in cell membranes.
Osmosis and aquaporins
[ 4 ]
Describe transport across cell membranes by osmosis.
Channel proteins
[ 3 ]
Explain facilitated diffusion.
Pump proteins
[ 3 ]
Calcium is absorbed from food in the human gut by both active and passive processes. Outline active transport, including the benefits of the process.
Selectivity in permeability
[ 1 ]
Which molecule is paired with the component of the cell membrane that allows it to pass through the membrane?
Molecule
Component of the cell membrane
insulin
aquaporin
glycogen
channel protein
oestradiol
phospholipid bilayer
carbon dioxide
pump protein
Glycoproteins and glycolipids
[ 1 ]
Which part of the membrane allows cell recognition?
Fluid mosaic model
[ 6 ]
Draw and label a diagram to show the structure of membranes.
Drawing canvas
Fatty acid composition and fluidity
HL only
[ 1 ]
Outline the effect of fatty acids on the fluidity of membranes.
Cholesterol and fluidity
HL only
[ 1 ]
Outline the effect of cholesterol on the fluidity of membranes.
Membrane fluidity and vesicles
HL only
[ 5 ]
Explain how vesicles are used by cells to move materials.
Gated ion channels in neurons
HL only
[ 3 ]
Explain the action of the voltage-gated potassium channel during a nerve impulse.
Sodium-potassium pumps
HL only
[ 2 ]
Analyse the graph to obtain two conclusions about the concentration of sodium-potassium pumps. 1. 2.
Sodium-glucose cotransporters
HL only
[ 1 ]
What transport method is used in the reabsorption of glucose in the proximal convoluted tubule of the kidney?
Cell adhesion molecules (CAMs)
HL only
[ 1 ]
Animal cells often secrete glycoproteins as extracellular components. What is a role of these glycoproteins?
B2.2 Organelles and compartmentalization
Organelles and compartmentalization explain how eukaryotic cells divide work among specialized structures, controlled internal spaces, and directed vesicle transport routes.
Syllabus
First assessment 2025
Topic
B2.2
Level
HL
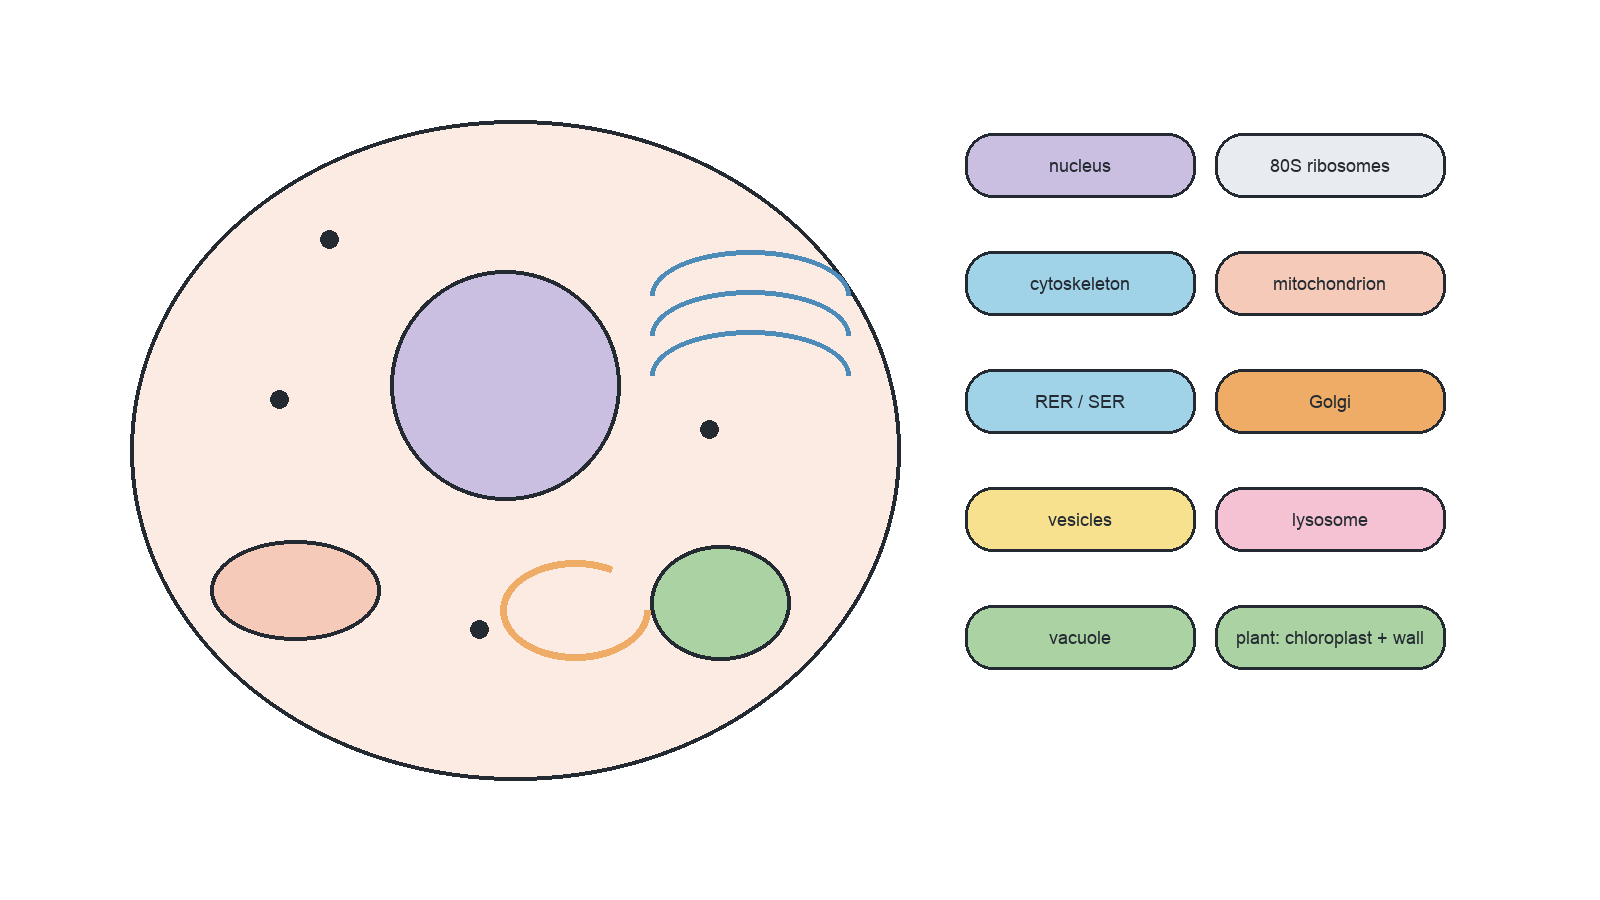
Compartments Turn One Cell into Many Workspaces
An organelle is a distinct cellular subunit adapted for a particular function. Membranes create local conditions, concentrate enzymes and substrates, and isolate incompatible reactions.
boundary → controlled composition → efficient reaction conditions; vesicles and transport proteins then connect the separate spaces into one coordinated cell
The Nucleus Separates RNA Processing from Translation
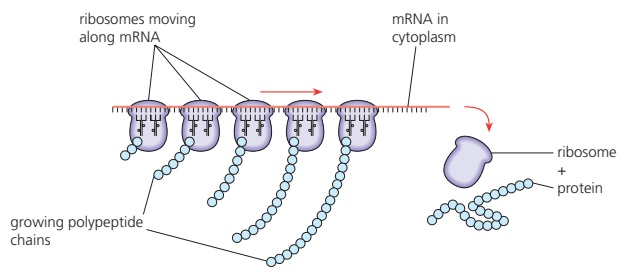
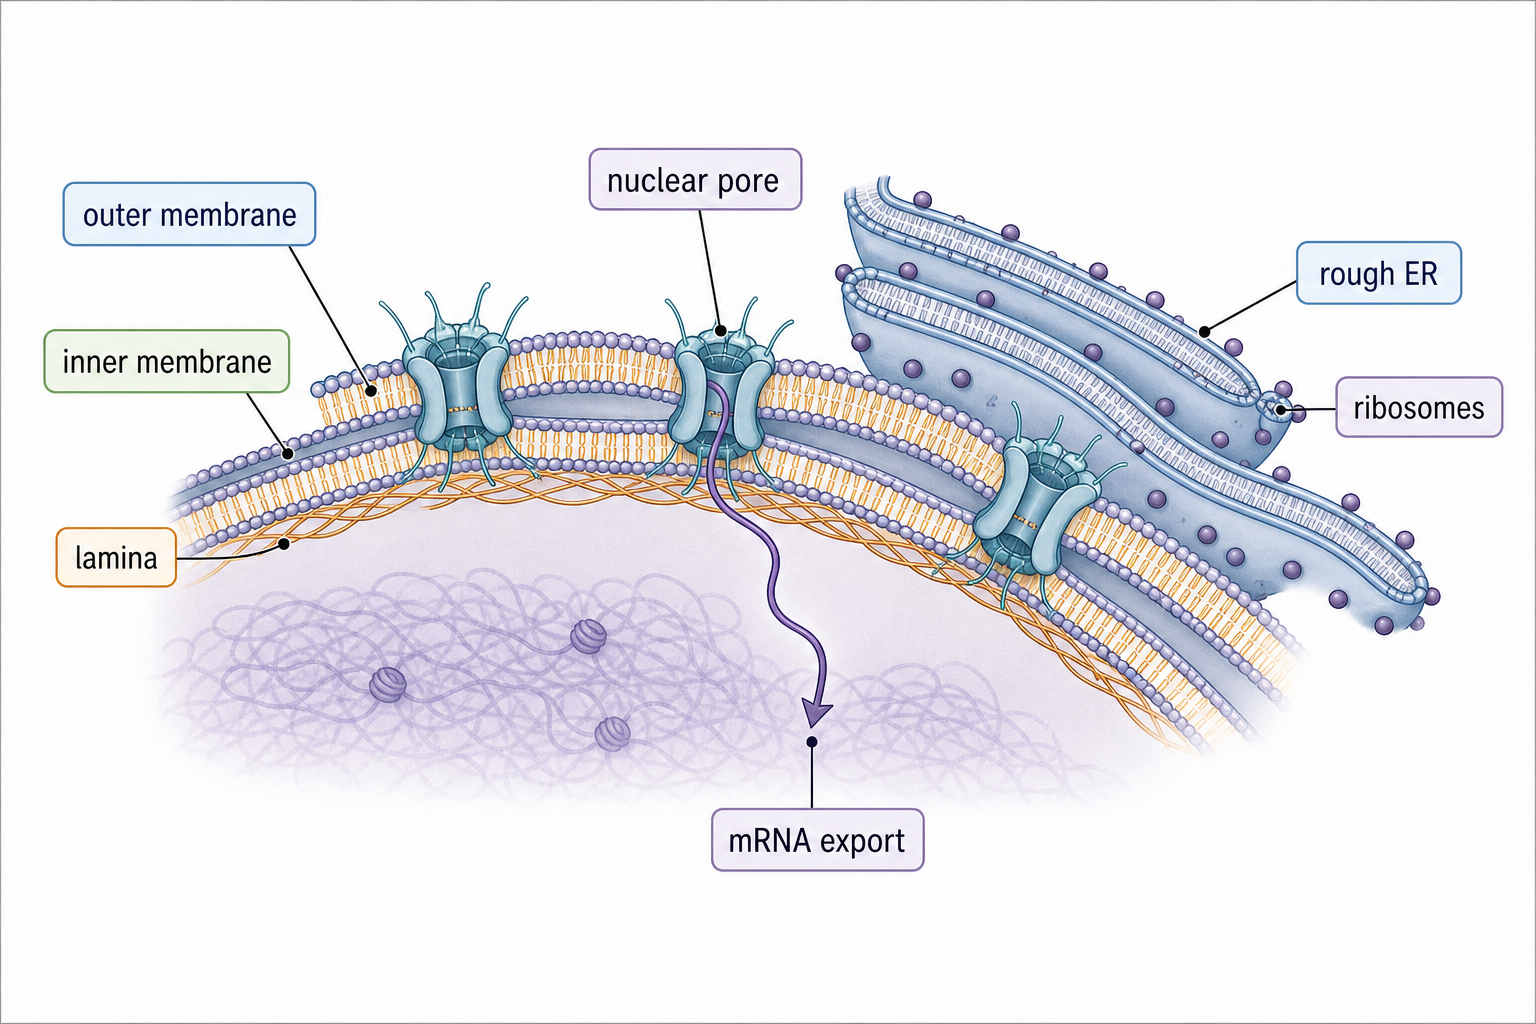
The nuclear envelope keeps DNA and transcription in the nucleus while translation occurs on cytoplasmic ribosomes. This separation permits pre-mRNA processing before mature mRNA reaches a ribosome.
DNA transcription → 5′ cap, intron removal and poly-A tail → mature mRNA export through a nuclear pore → several ribosomes can translate it as a polysome
SL Summary: Explain the Advantage, Not Just the Organelle
For any compartment: name its boundary → state what differs across it → connect that difference to a function.
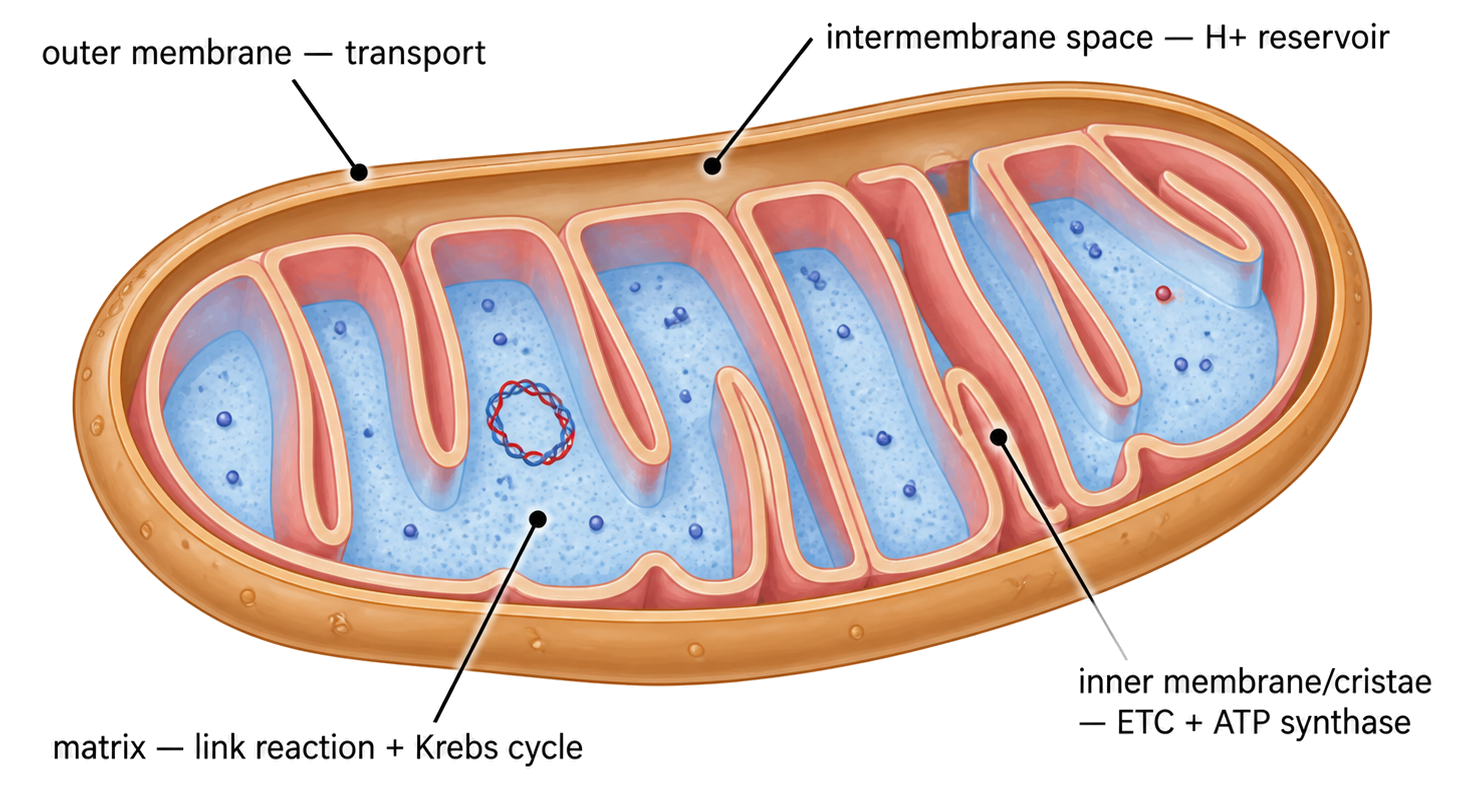
Mitochondrial Architecture Couples Oxidation to ATP Synthesis
HL only
The matrix contains enzymes for the link reaction and Krebs cycle. The inner membrane carries electron-transfer chains and ATP synthase; cristae enlarge its area, while the narrow intermembrane space permits rapid H⁺ accumulation.
reduced carriers donate electrons → inner-membrane complexes pump H⁺ → electrochemical gradient forms → H⁺ returns through ATP synthase → ATP is produced
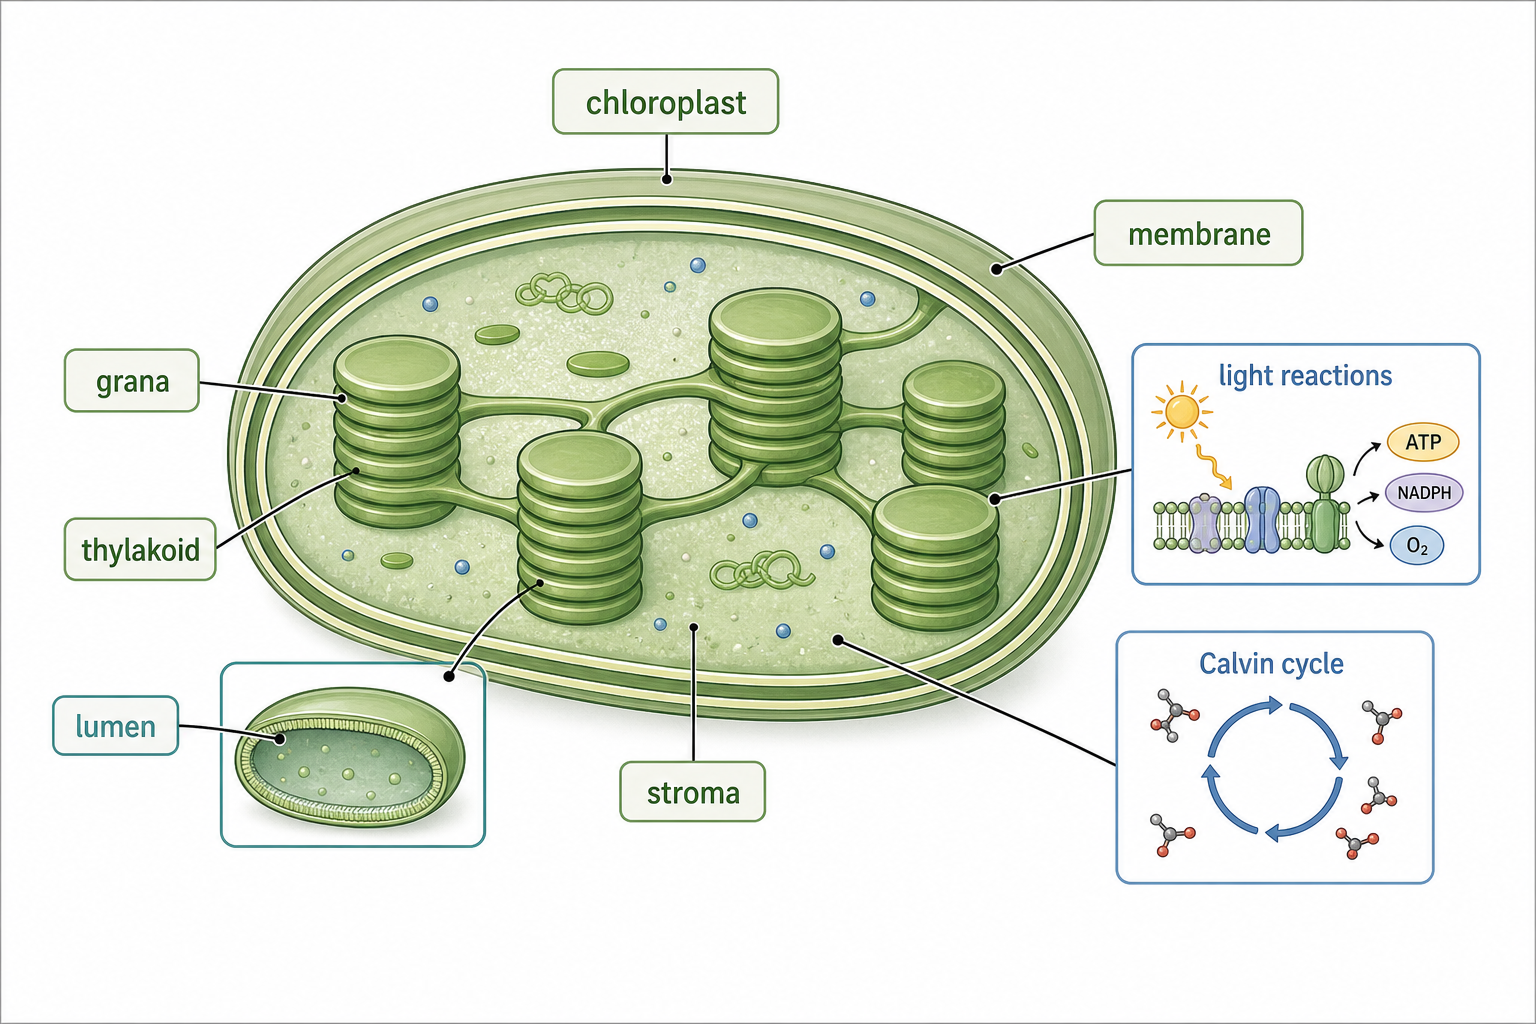
Chloroplast Compartments Link Light Capture to Carbon Fixation
HL only
Thylakoid membranes contain chlorophyll, electron carriers and ATP synthase. Their lumen accumulates H⁺; the surrounding stroma contains enzymes for the Calvin cycle. Grana increase thylakoid membrane area.
light excites electrons → H⁺ accumulates in thylakoid lumen → ATP and reduced NADP form at the membrane → both enter the stroma and support carbon fixation
The Double Nuclear Envelope Protects DNA Yet Permits Exchange
HL only
The nucleus has inner and outer membranes separated by a perinuclear space. The outer membrane is continuous with rough ER; nuclear pore complexes selectively control traffic between nucleoplasm and cytoplasm.
out: processed mRNA, tRNA and assembled ribosomal subunits
in: histones, polymerases, transcription factors and other nuclear proteins
lamina: supports nuclear shape and organizes chromatin
A Targeting Signal Selects Free Ribosome or Rough ER
HL only
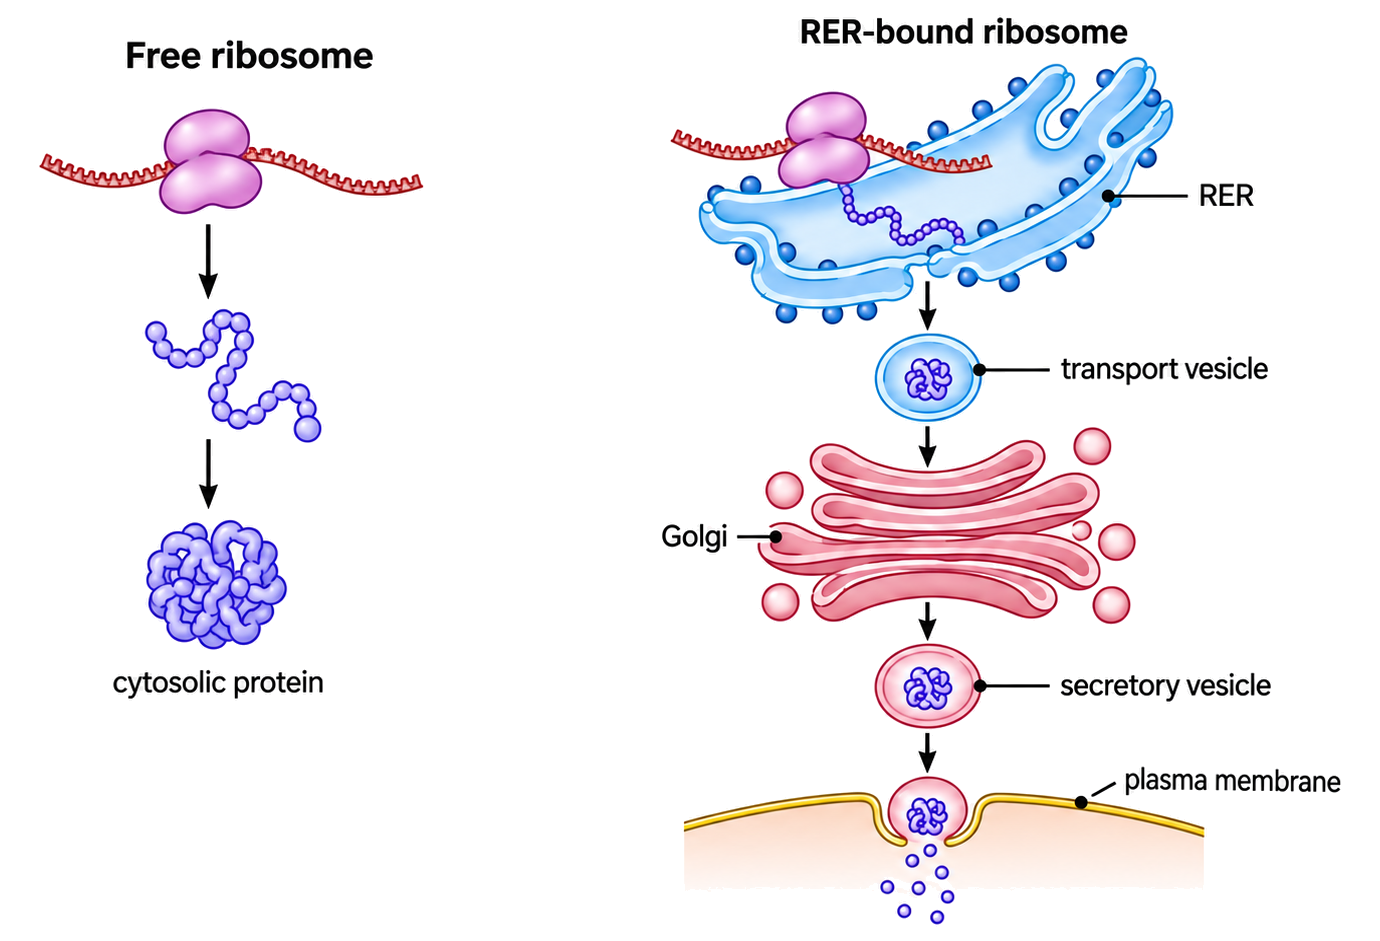
All cytosolic ribosomes begin translation free. A signal peptide on the growing polypeptide can redirect the ribosome to rough ER, where translation continues into the ER lumen or membrane.
cytosolic protein → completed on a free ribosome
secreted or lysosomal protein → rough ER → vesicle → Golgi
membrane protein → inserted into ER membrane, then trafficked
The Golgi Processes Cargo in a Directed Sequence
HL only
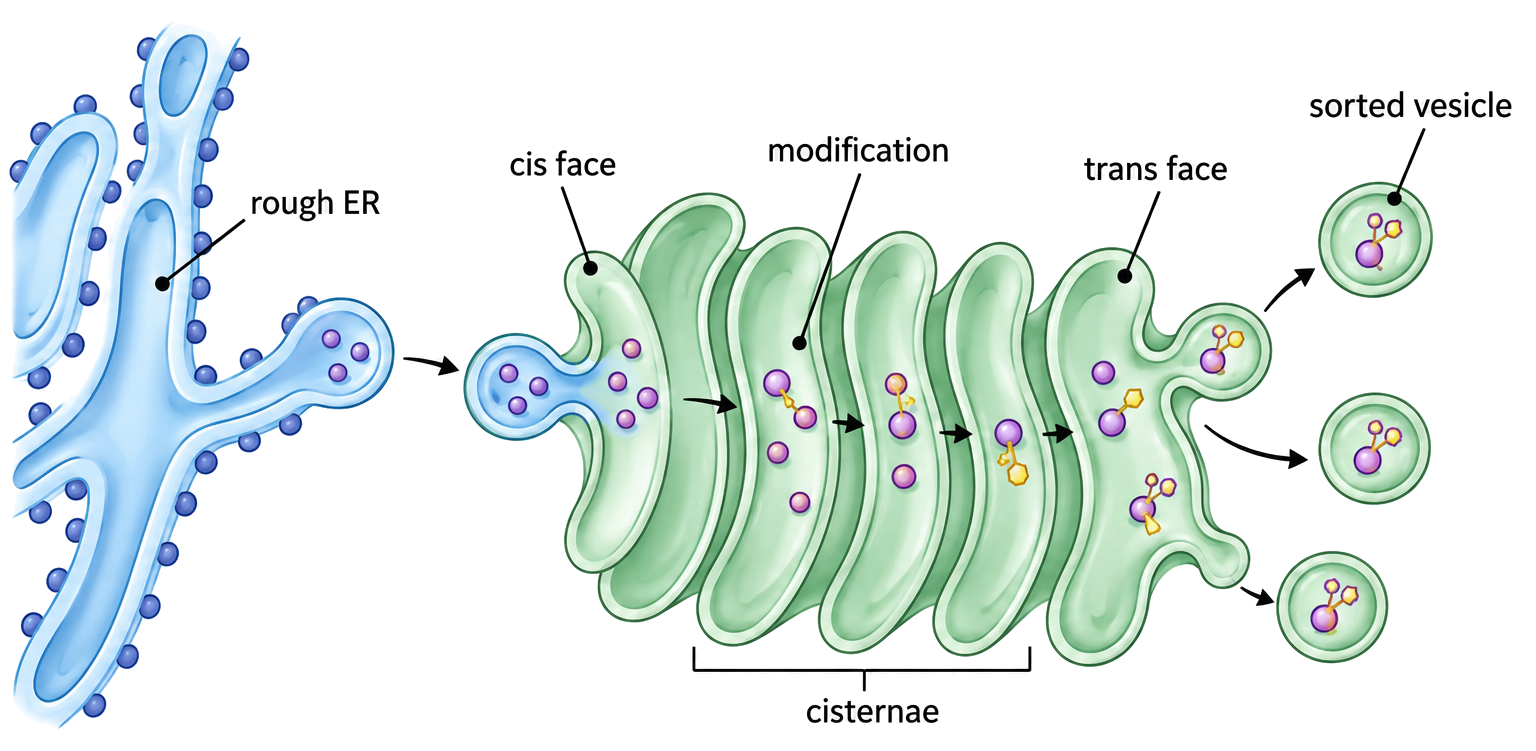
The Golgi is a polarized stack of flattened cisternae. The cis face receives ER vesicles; different cisternae modify proteins and lipids; the trans face sorts cargo into vesicles for distinct destinations.
rough ER → transport vesicle → cis Golgi → sequential modification through cisternae → trans Golgi sorting → lysosome, plasma membrane or secretion
Vesicles Move Cargo Without Mixing Compartments
HL only
A vesicle buds with selected membrane and soluble cargo, travels to a target, and fuses so that cargo enters the correct compartment without exposure to cytosol.
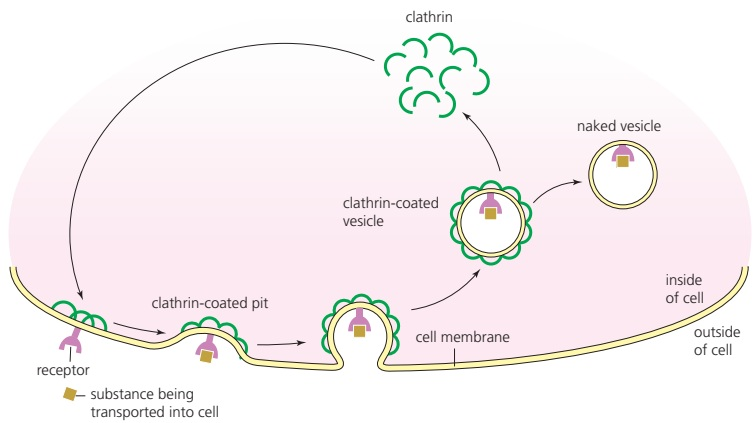
cargo selection → membrane curvature and budding → scission → uncoating → target recognition → fusion; clathrin helps form selected coated buds during receptor-mediated endocytosis
HL Summary: Two Compartment Systems, One Design Principle
HL only
mitochondrion: inner-membrane H⁺ gradient → aerobic ATP
chloroplast: thylakoid H⁺ gradient → ATP and reduced NADP
endomembrane system: preserved cargo and orientation → sorting and secretion
Secreted protein: targeting signal → rough ER → vesicle → cis-to-trans Golgi → secretory vesicle → plasma membrane.
Organelles as discrete subunits
[ 7 ]
Describe the organelles and other structures in animal cells that are visible in electron micrographs.
Advantages of compartmentalization
[ 4 ]
Discuss the use of membranes for compartmentalization in eukaryotic cells.
Mitochondrion adaptations
HL only
[ 3 ]
Explain the relationship between the structure of the mitochondrion and its function.
Drawing canvas
Chloroplast adaptations
HL only
[ 4 ]
Describe how the structure of the chloroplast is adapted to its function in photosynthesis.
Drawing canvas
Nuclear membrane benefits
HL only
[ 1 ]
What is a benefit of double membranes surrounding the nuclei of eukaryotic cells?
Free ribosomes vs. rough ER
HL only
[ 1 ]
Which statement distinguishes between the roles of free and bound ribosomes?
Golgi apparatus
HL only
[ 1 ]
The diagram summarizes the production and secretion of digestive enzymes in an exocrine gland cell of the pancreas.
Which cell organelle is involved at Y ?
Vesicles in cells
HL only
[ 1 ]
What is the role of clathrin molecules in the formation of vesicles?
B2.3 Cell specialization
Cell specialization links selective gene expression, stem cell potency, cell size, exchange surfaces, and specialized tissues to biological function in multicellular organisms.
Syllabus
First assessment 2025
Topic
B2.3
Level
HL
Differentiation changes gene activity, not the genome
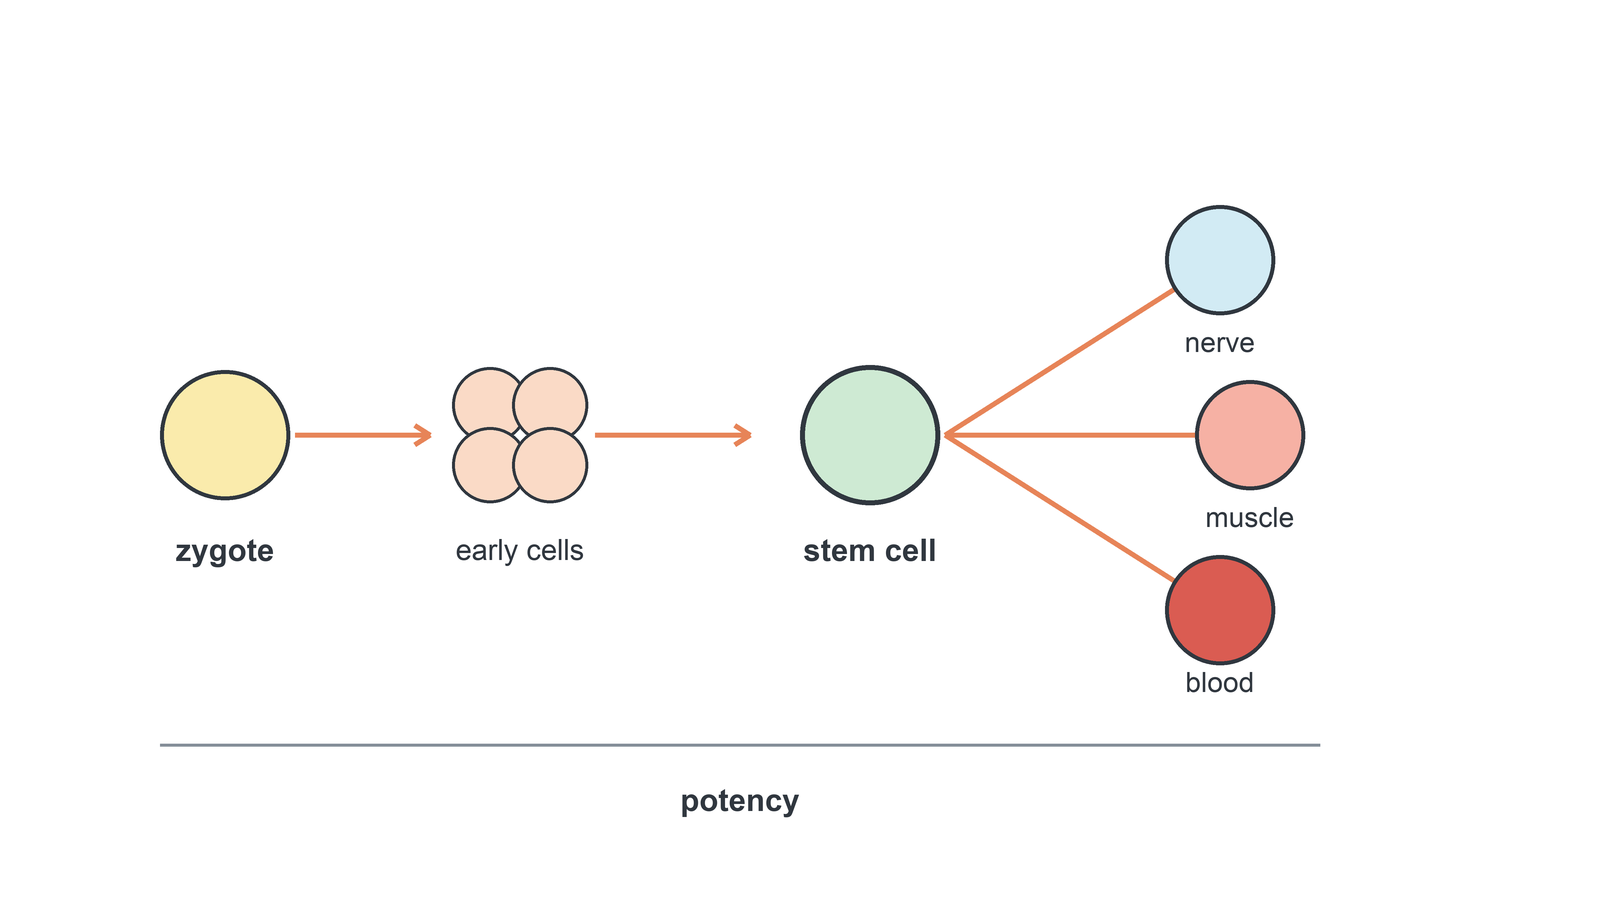
A zygote divides by mitosis to produce unspecialized cells with nearly the same genome. Differentiation occurs when different cells express different subsets of those genes.
1
A developmental signal activates or represses regulatory genes.
2
The pattern of transcription changes, so different messenger RNAs are produced.
3
Translation produces a cell-specific set of proteins.
4
Those proteins change cell structure, metabolism and behaviour.
A neuron and a muscle cell differ mainly because they use the shared genome differently—not because each cell type was given a different set of genes.
A morphogen gradient turns position into cell fate
A morphogen is an extracellular signalling molecule distributed as a concentration gradient across developing tissue. Cells at different positions are exposed to different concentrations.
Local exposure
Gene-regulatory response
Developmental consequence
above a high threshold
one set of genes switches on or off
one cell fate is stabilized
between thresholds
a different regulatory cascade begins
an intermediate fate develops
below a lower threshold
neither higher-threshold response occurs
another fate develops
The morphogen does not build a body part directly. Its concentration supplies positional information; altered gene expression then changes proteins, growth and differentiation.
Stem cells preserve themselves and preserve options
Defining property
What it means
Why it matters
self-renewal
repeated division produces cells that remain undifferentiated
the stem-cell pool is maintained
potency
a cell can differentiate into one or more mature cell types
new specialized cells can be supplied
A stem-cell population must balance these outcomes. If every daughter differentiated, the reserve would be depleted; if none differentiated, the tissue would not gain the mature cells it needs.
Embryonic stem cells generally retain broader potency. Most adult stem cells have a narrower range but remain essential for tissue maintenance and repair.
Potency narrows as developmental commitment increases
Potency
Typical developmental source
Possible descendants
totipotent
zygote and first few divisions
all body cells and extraembryonic tissues such as placenta
pluripotent
inner cell mass of the blastocyst
all body cell types, but not placenta or a totipotent cell
multipotent
adult tissue stem-cell niches
a restricted family of cells in one tissue or organ
Development usually moves from broad potential toward commitment: totipotent → pluripotent → multipotent → specialized. A narrower potency does not mean the cell is less useful; it means fewer fates remain available.
A niche decides whether an adult stem cell waits, renews or commits
A stem-cell niche is a local microenvironment whose neighbouring cells, extracellular matrix and signalling molecules maintain stem cells or change their behaviour.
Adult niche
Stem cells and local control
Tissue outcome
bone marrow
osteoblastic and vascular signals regulate haematopoietic stem-cell dormancy, renewal and mobilization
red blood cells, white blood cells and platelets are continually replaced
hair-follicle bulge
signals activate multipotent cells during a growth phase and allow dormancy during rest
the follicle and hair regenerate cyclically
The niche is not simply a storage site. It is a decision environment that can keep a cell undifferentiated, expand the stem-cell pool or trigger commitment to a mature lineage.
Useful cell size depends on the job
Specialized cell
Useful dimension
Function served
erythrocyte
small and flexible
passes through narrow capillaries
secondary oocyte
large cytoplasmic volume
stores organelles, nutrients and regulatory molecules for early development
neuron
very long axon
carries an impulse over a long distance without a chain of intervening cells
skeletal muscle fibre
long multinucleate cell
coordinates force along an extended contractile unit
Do not call a cell ‘adapted’ merely because it is large or small. Name the dimension that changes, then show how that dimension improves a specific task.
Volume outgrows the surface that must supply it
Surface area sets the capacity for exchange across the plasma membrane. Volume represents metabolically active cytoplasm that consumes nutrients and oxygen and produces wastes and heat.
SAVSA=6l2=l6V=l3
Cube side, l
Surface area
Volume
SA:V
1
6
1
6:1
2
24
8
3:1
4
96
64
1.5:1
As a similarly shaped cell grows, total surface area still increases—but volume increases faster, so SA:V falls and internal diffusion paths lengthen. Exchange can no longer keep pace with demand, limiting cell size unless shape, division or internal transport changes.
SL summary: connect fate, form and exchange
Differentiation: signal or morphogen position → selective gene expression → cell-specific proteins → specialized structure and function
Stem-cell control: self-renewal preserves the reserve; potency describes possible fates; a niche regulates waiting, renewal or commitment
Cell dimensions are useful only in relation to a job such as storage, long-distance signalling or coordinated contraction.
Exchange capacity scales with surface area, while metabolic demand scales with volume.
For similar shapes, growth lowers SA:V because volume increases faster than surface area.
A complete explanation names the signal or structural feature, states what it changes inside or around the cell, and links that change to the biological result.
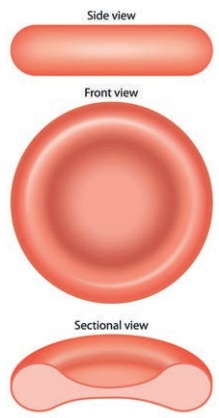
An erythrocyte is shaped for rapid oxygen exchange in narrow vessels
HL only
flattened, biconcave disc: large membrane area relative to volume and a short path from surface to haemoglobin
no nucleus at maturity: more internal space for haemoglobin and freedom to adopt the biconcave form
flexible membrane and small diameter: deformation through capillaries narrower than the resting cell
Together these features speed oxygen loading and unloading while allowing the cell to bring haemoglobin close to tissues throughout the capillary network.
A PCT cell builds two exchange surfaces for reabsorption
HL only
A proximal convoluted tubule epithelial cell reabsorbs useful solutes from nephron filtrate and transfers them toward nearby blood. Its apical and basal faces therefore have different structural jobs.
Cell region
Adaptation
Functional effect
apical surface facing filtrate
dense microvilli form a brush border
more membrane for transport proteins that take up glucose, amino acids and ions
basolateral surface facing tissue fluid and capillaries
deep membrane invaginations
more membrane for pumps and carriers moving solutes out of the cell
cytoplasm between the two surfaces
many mitochondria
ATP supply for active transport that maintains directional reabsorption
The folds increase area only because the added membrane carries transport machinery. Filtrate → apical uptake → cytoplasmic transfer → basolateral export → blood.
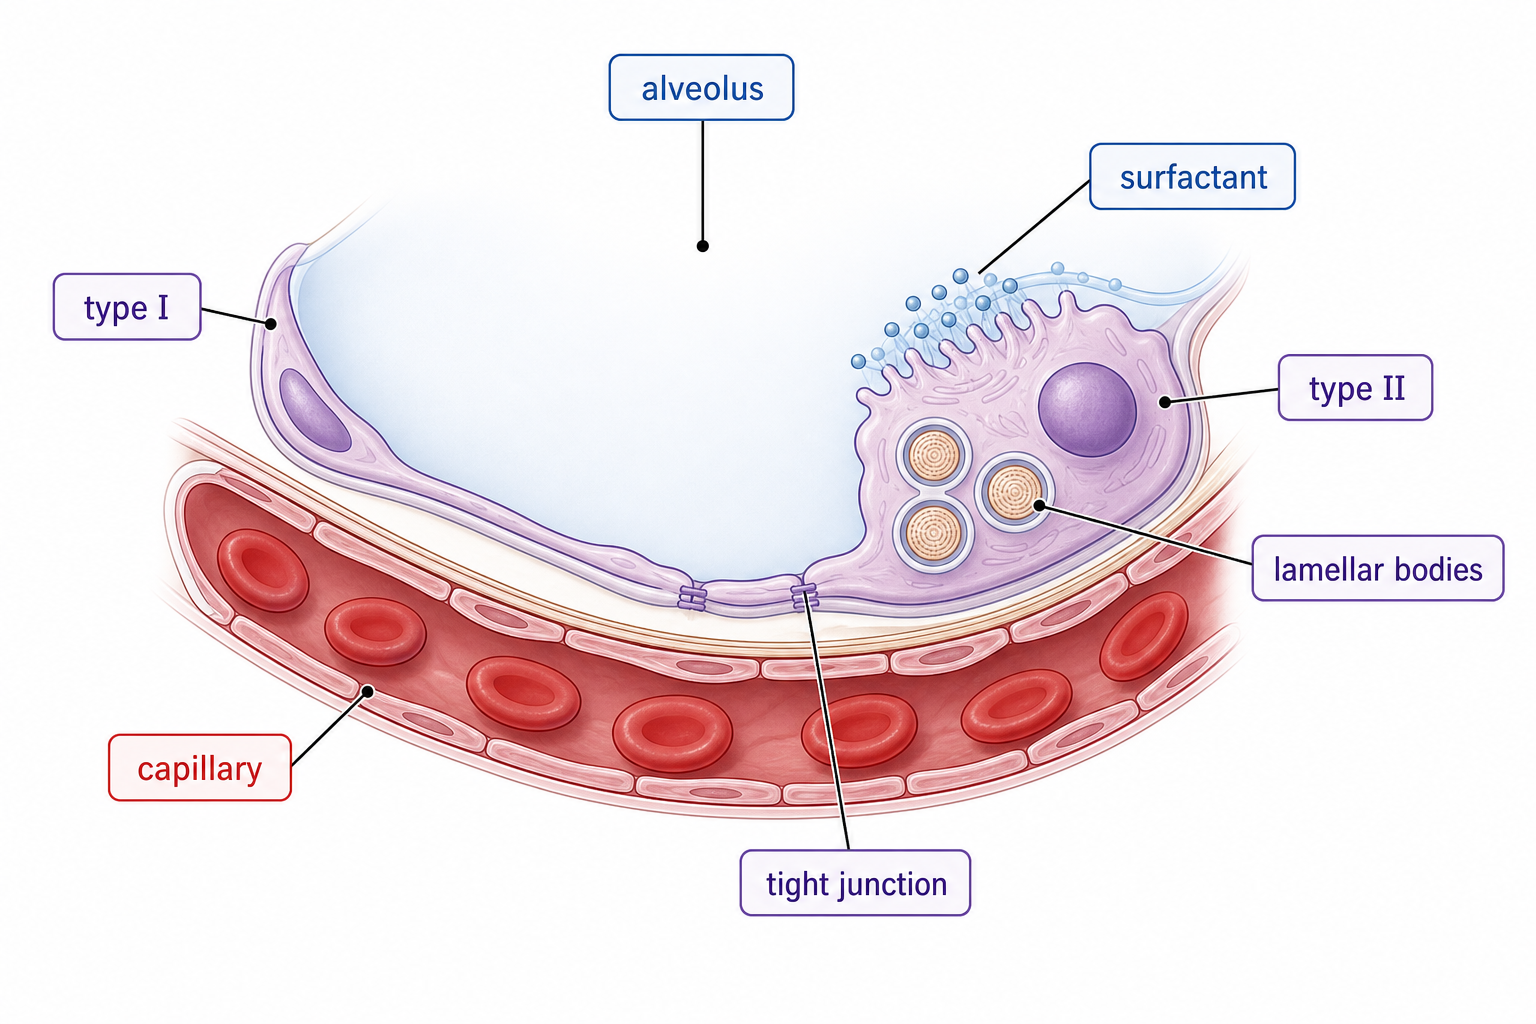
Two pneumocyte types keep an alveolus thin, dry and open
HL only
Cell type
Structure
Main contribution
type I pneumocyte
flattened and extremely thin; covers most exchange surface
minimizes the air-to-blood diffusion distance
type II pneumocyte
cuboidal; lamellar bodies and secretory machinery
releases surfactant, lowering surface tension so alveoli resist collapse
Tight junctions between epithelial cells limit tissue-fluid leakage into the alveolar air space. A dense capillary supply keeps blood close to the thin type I surface.
One cell type cannot be maximally thin and strongly secretory at the same time. Division of labour lets the alveolus preserve a short diffusion path, a dry surface and low surface tension.
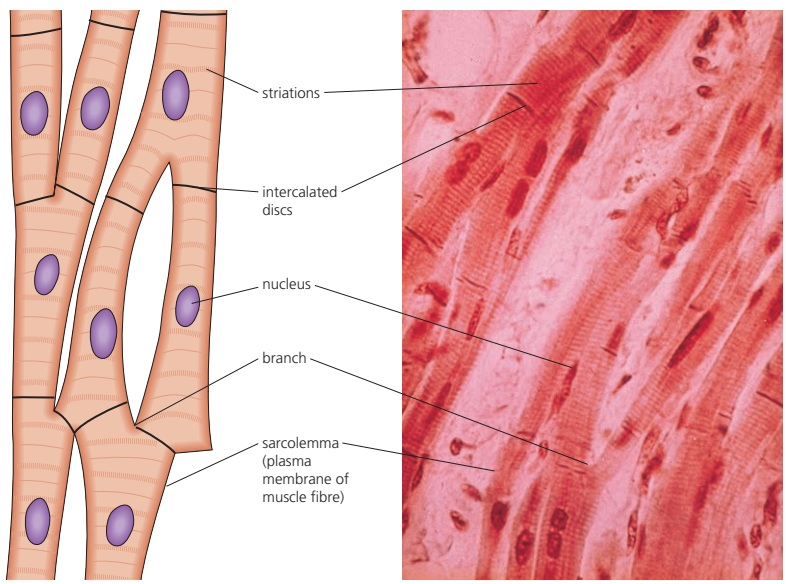
Cardiac cells couple into a synchronized contractile network
HL only
repeating sarcomeres in myofibrils produce the striated appearance and contractile force
branching connects each cell with several neighbours in a three-dimensional network
cardiac muscle is myogenic, so contraction impulses originate within heart tissue
numerous mitochondria support continual ATP demand
At an intercalated disc, strong junctions hold adjacent cells together during forceful contraction, while gap junctions provide low-resistance routes for depolarization to pass from cell to cell.
Electrical coupling spreads excitation rapidly and mechanical coupling prevents separation, so many cardiac cells contract as a coordinated wall.
A skeletal muscle fibre is one long multinucleate force unit
HL only
A skeletal muscle fibre forms by fusion of precursor cells, producing a very long multinucleate syncytium enclosed by one sarcolemma. It is a cell despite its unusual size and many nuclei.
Internal feature
Contribution to contraction
parallel myofibrils packed with repeating sarcomeres
force sums along the length of the fibre and creates striations
many nuclei
support gene expression across a large cytoplasmic volume
mitochondria between myofibrils
provide ATP close to contractile machinery
T-tubules and sarcoplasmic reticulum around myofibrils
carry excitation inward and release Ca²⁺ throughout the fibre
Both cardiac and skeletal muscle are striated and ATP-demanding. Cardiac tissue coordinates many short branched cells through intercalated discs; skeletal muscle coordinates one long fibre internally and is activated at neuromuscular junctions.
A sperm is a compact delivery system for one haploid nucleus
HL only
A sperm cell is specialized to reach a secondary oocyte, cross its outer layers and deliver a haploid paternal nucleus.
streamlined head: reduces resistance during movement and contains the haploid nucleus
acrosome: releases hydrolytic enzymes that digest a route through the zona pellucida
mitochondria-rich middle piece: supplies ATP for flagellar beating
flagellum with a 9 + 2 microtubule arrangement: generates propulsion
Each region serves the same sequence: movement toward the oocyte → penetration of the zona pellucida → fusion → nuclear delivery. Naming a part without this causal link does not explain its adaptation.
A secondary oocyte protects fertilization and provisions the zygote
HL only
A secondary oocyte is much larger than a sperm because it contributes nutrient-rich cytoplasm, organelles and regulatory molecules needed immediately after fertilization. It contains a haploid nucleus and completes meiosis only when fertilization occurs.
follicle cells: nourish and protect the developing oocyte
zona pellucida: glycoprotein layer for sperm binding; after fertilization it is altered to help prevent polyspermy
plasma-membrane microvilli: increase contact and nutrient uptake from surrounding follicle cells
cortical granules: release contents after sperm fusion, changing the zona pellucida so additional sperm are blocked
The gametes are complementary: the sperm is small and motile for delivery; the oocyte is large and resource-rich for controlled fertilization and early development.
HL summary: defend an adaptation with a mechanism
HL only
Cell
Structural change
Physical or cellular consequence
Biological result
erythrocyte
biconcave, flexible, no nucleus
large area, short O₂ path, capillary deformation
rapid oxygen transport
PCT cell
microvilli, basal folds, many mitochondria
more transporter membrane and ATP
directional reabsorption
alveolar epithelium
thin type I + secretory type II cells
short gas path + lower surface tension
efficient exchange without collapse
cardiac muscle
branches + intercalated discs
electrical and mechanical coupling
synchronized contraction
skeletal fibre
long syncytium with parallel myofibrils
force aligned through one fibre
directed voluntary movement
gametes
motile sperm + resource-rich oocyte
delivery paired with protection and provisioning
fertilization and early development
Use the complete chain: structure → changed area, distance, energy supply, coupling or control → cellular process → organism-level result. The word ‘helps’ is not a mechanism.
Specialization creates trade-offs. A type I pneumocyte is thin rather than strongly secretory; a mature erythrocyte gains haemoglobin space but loses its nucleus; a sperm is mobile but contributes little cytoplasm. Tissues and organisms combine different specialists to complete the whole task.
Differentiation after fertilization
[ 1 ]
The micrograph of a section through a plant stem shows at least ten different types of cells.
What explains the differences between these cells?
Properties of stem cells
[ 5 ]
Describe the characteristics of stem cells that make them potentially useful in medicine.
Types of stem cells
[ 1 ]
Which is a description of stem cells?
Cell size as specialization
[ 1 ]
Which specialized cell has the largest volume?
Surface area-to-volume ratios
[ 7 ]
Explain the importance of surface area to volume ratio as a factor limiting cell size.
Adaptations to increase SA:V
HL only
[ 1 ]
Where are microvilli located in the nephron?
Pneumocytes in alveoli
HL only
[ 2 ]
Outline the function of pneumocytes in the lungs.
Cardiac and striated muscle
HL only
[ 3 ]
Explain how the structure of cardiac muscle cells is adapted to their function.
Gamete adaptations
HL only
[ 1 ]
In which part of a mature spermatozoan are mitochondria most numerous?
B3.1 Gas exchange
Gas exchange links animal ventilation, alveolar diffusion, leaf stomata, transpiration and haemoglobin affinity to oxygen supply and carbon dioxide removal.
Syllabus
First assessment 2025
Topic
B3.1
Level
HL
Gas Exchange Must Match Cellular Respiration
Respiration consumes O₂ and produces CO₂. A gas-exchange system is needed when diffusion across the outer body surface cannot move these gases fast enough for all cells.
small/thin organism → high SA:V + short diffusion path → direct exchange may suffice
large or active organism → lower SA:V + long internal distances + high demand → specialized surface, ventilation and transport
The system does not create diffusion. It maintains a large area, a short path and steep partial-pressure gradients so diffusion can meet metabolic demand.
Four Properties Increase Diffusion Rate
Fick’s law predicts faster gas transfer with greater surface area and partial-pressure difference, and with a thinner diffusion barrier. A moist, permeable surface lets gases dissolve before crossing.
For every claimed adaptation, name the changed variable: area, gradient, distance or permeability. Then connect it to faster O₂ or CO₂ diffusion.
Ventilation and Blood Flow Preserve Opposite Gradients
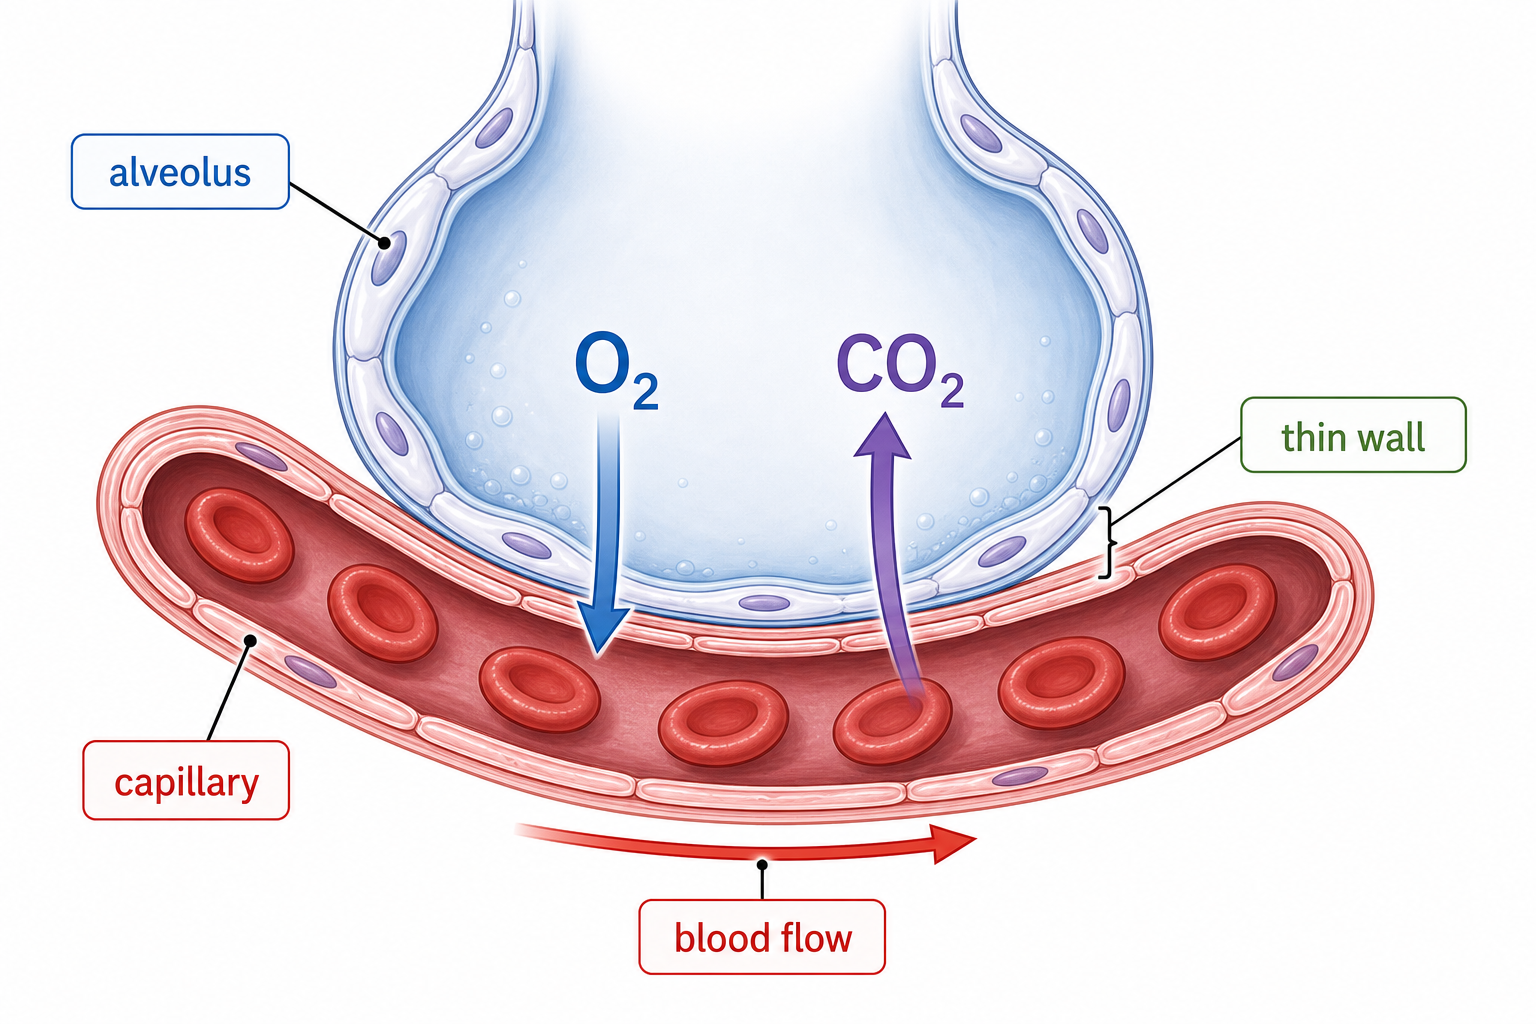
At an alveolus, ventilation replaces air while perfusion replaces blood. Together they keep alveolar O₂ above venous-blood O₂ and venous-blood CO₂ above alveolar CO₂.
alveolar air high O₂ → O₂ diffuses into blood → haemoglobin binding removes dissolved O₂
venous blood high CO₂ → CO₂ diffuses into alveolus → expiration removes it
Reduced ventilation lowers alveolar O₂; reduced perfusion leaves no blood to load. Either mismatch lowers whole-system exchange even if the membrane is intact.
Alveoli Combine Area, Thinness and Gradient Maintenance
Millions of alveoli create a very large moist surface. Type I pneumocytes and capillary endothelium form a short diffusion path; elastic fibres support recoil and surfactant limits collapse.
airway branching → alveolar air → type I pneumocyte → basement membrane region → capillary endothelium → plasma → erythrocyte haemoglobin
Muscle Contraction Creates the Pressure Difference for Airflow
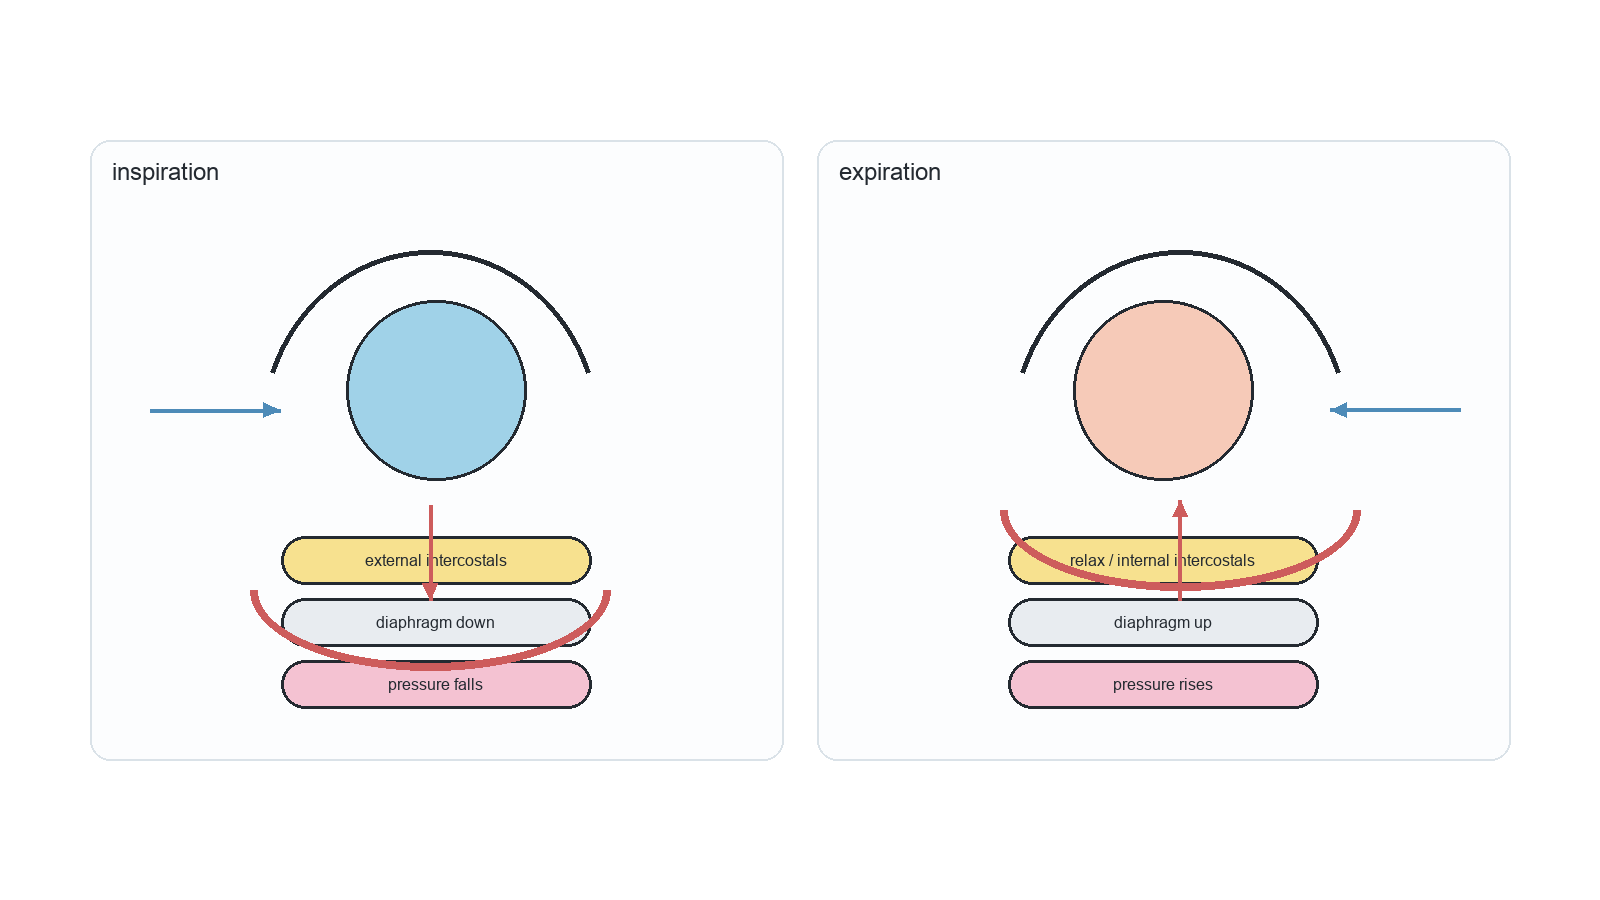
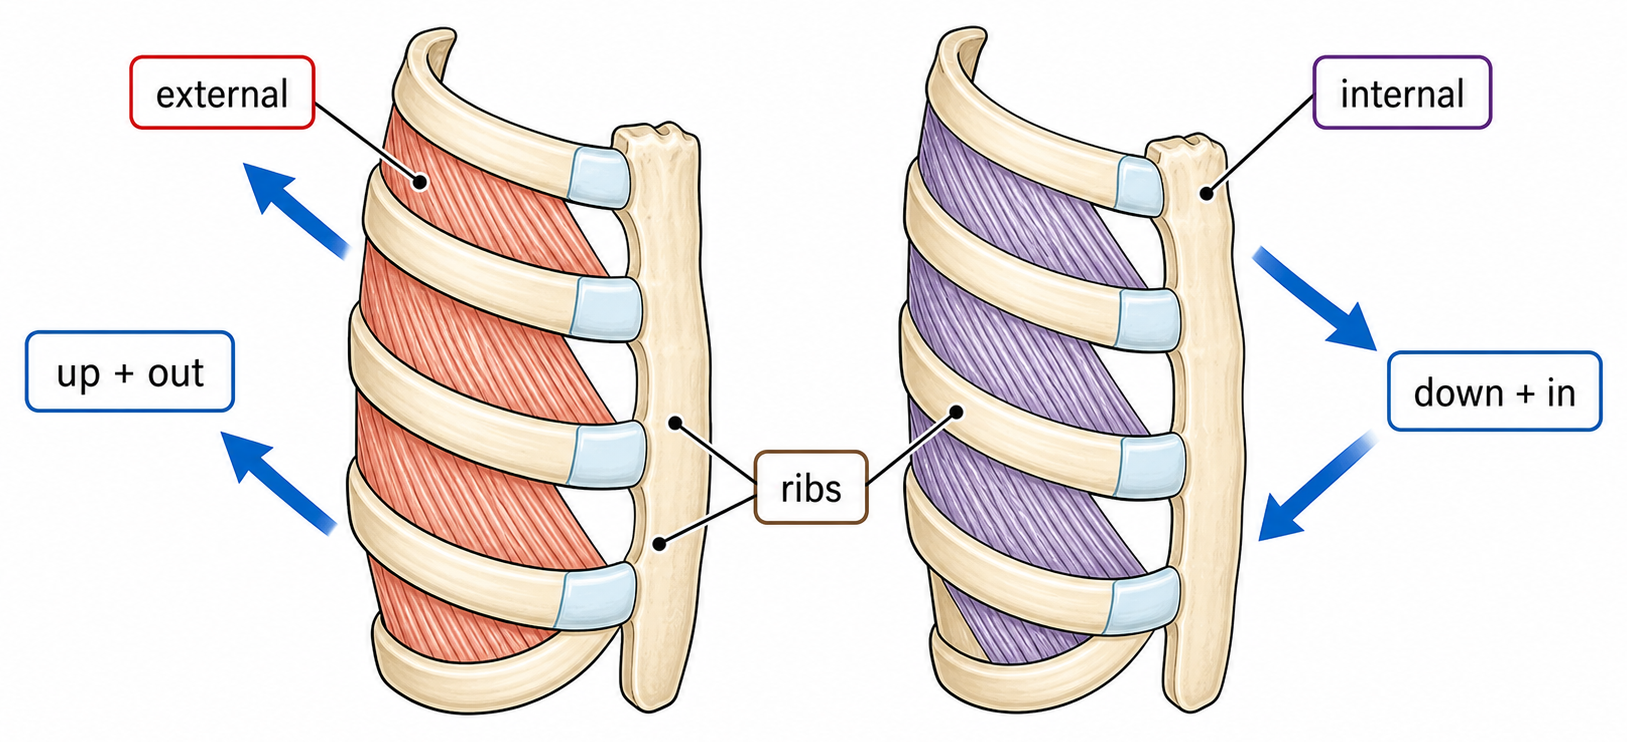
Air moves because thoracic volume changes alter lung pressure. Inspiration is active: diaphragm and external intercostals contract, increasing volume and lowering pressure below atmospheric.
Tidal volume is the change during one normal breath. Breathing rate is cycles per minute. Ventilation rate = tidal volume × breathing rate; vital capacity spans maximum inspiration to maximum expiration.
1 identify axes and calibration
2 measure peak-to-trough height for volume
3 count complete cycles across a known time
4 multiply using consistent units
5 separate amplitude change from frequency change
A Stoma Trades Carbon Entry for Water Loss
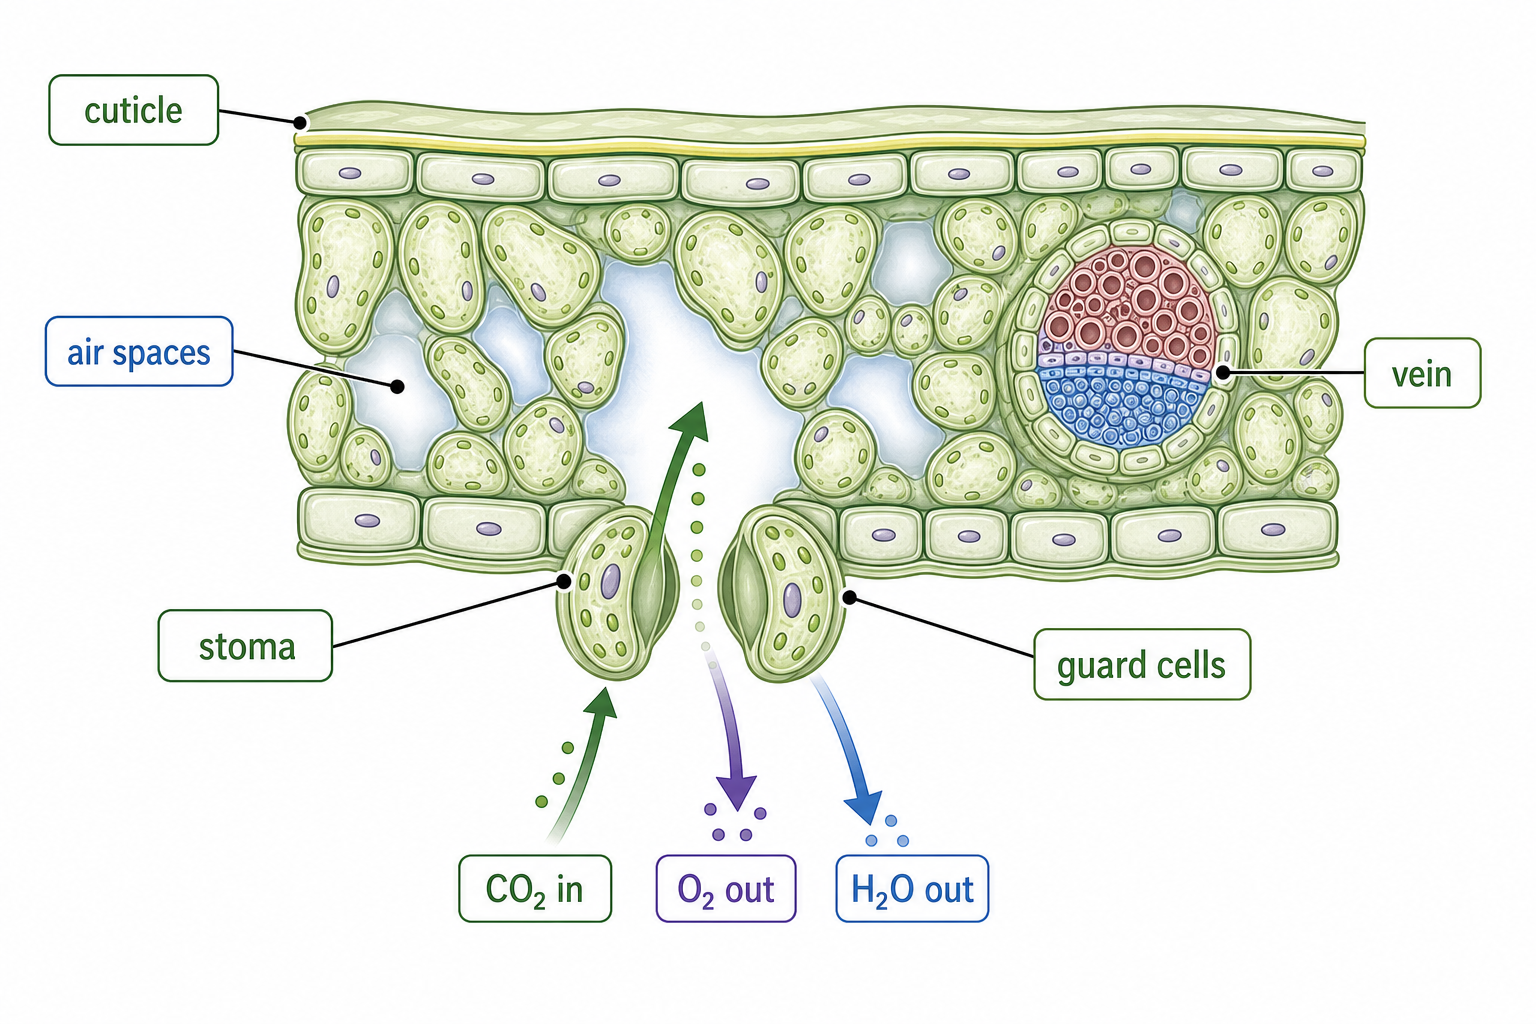
CO₂ enters and water vapour exits mainly through stomata. Guard cells change pore width, balancing photosynthetic demand against dehydration risk.
CO₂: atmosphere → stoma → substomatal air space → moist mesophyll wall → photosynthetic cell
H₂O: xylem → mesophyll wall → evaporation → air spaces → diffusion through stoma
Leaf Layers Coordinate Light, Gas and Transport
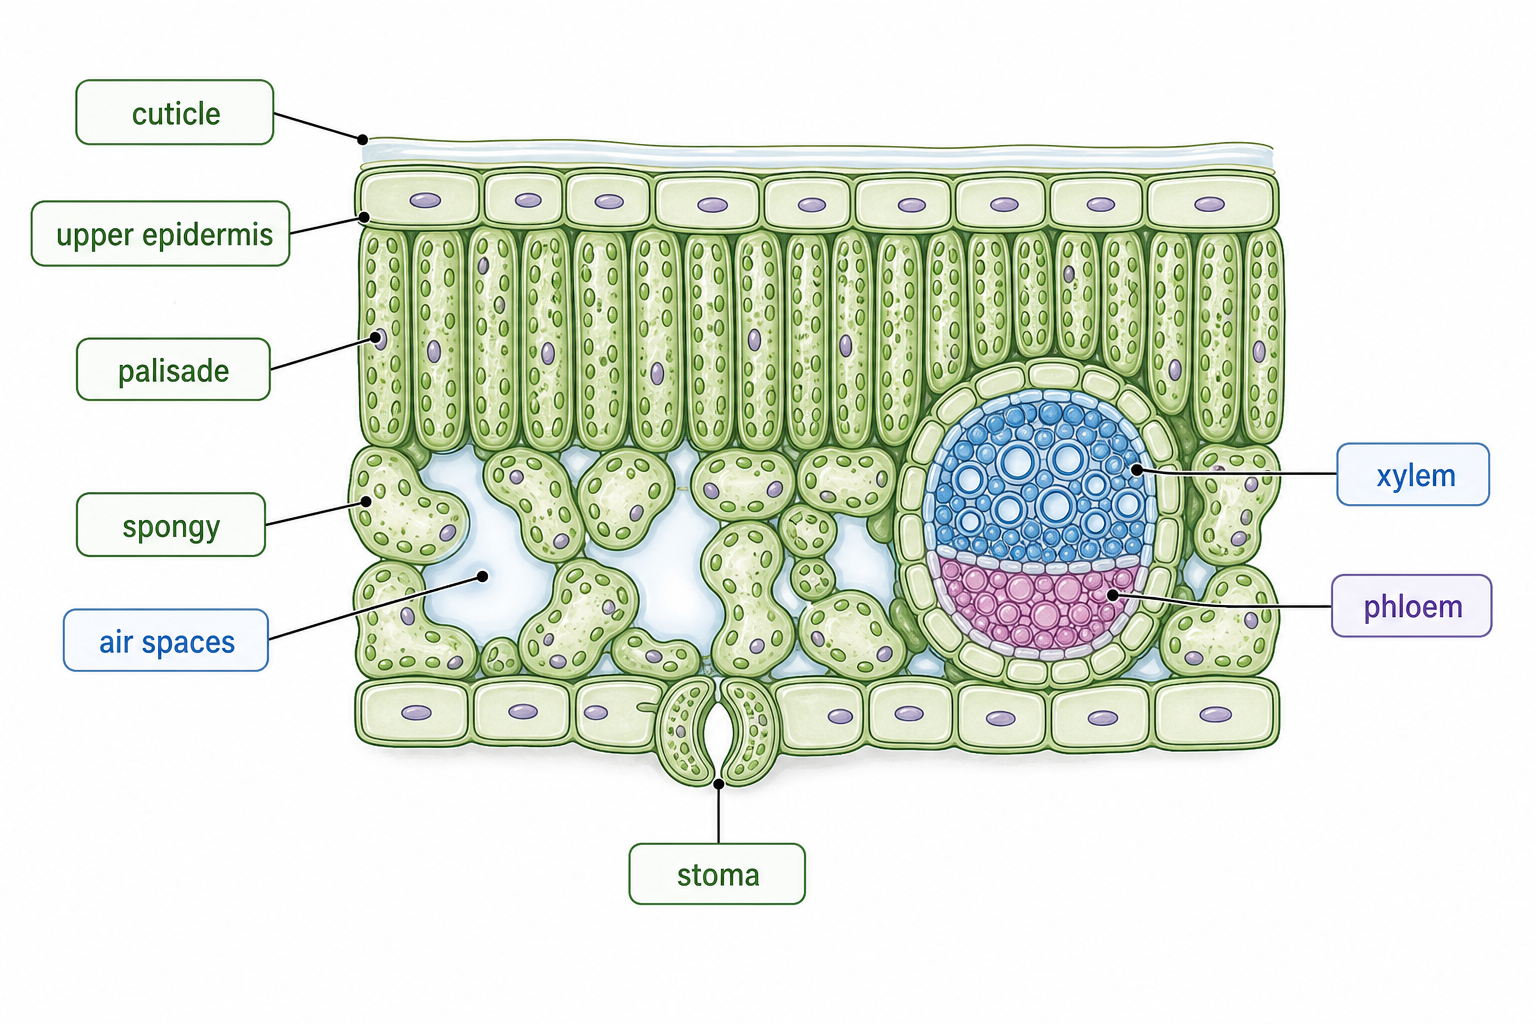
Leaf tissue distribution places palisade cells near light, spongy mesophyll beside interconnected air spaces, stomata in epidermis and vascular bundles within diffusion range of cells.
upper epidermis/cuticle → light entry + water conservation
palisade → chloroplast-rich light capture
spongy mesophyll → moist exchange area + air spaces
xylem/phloem → water supply + assimilate export
Transpiration Responds to the Vapour Gradient and Stomata
Transpiration is water loss by evaporation from mesophyll surfaces followed by diffusion of water vapour out through stomata. Its rate depends on stomatal aperture and the leaf-to-air vapour gradient.
light often opens stomata → rate rises
higher temperature → faster evaporation and often steeper gradient
higher humidity → smaller gradient → rate falls
wind removes moist boundary air → rate rises until stomata respond
Stomatal Density Measures Pores per Leaf Area
Stomatal density = number of stomata counted ÷ sampled epidermal area. It estimates potential pore abundance, while aperture determines how open those pores are at a given moment.
clear nail-varnish impression → peel and mount → calibrate field area → count stomata in random fields → calculate each density → repeat and report variation
SL Summary: One Diffusion Model
Feature
Lung
Leaf
area
many alveoli
broad blade + mesophyll walls
path
thin barrier
thin leaf + air spaces
gradient
air + blood flow
CO₂ use + stomata
Spirometry measures ventilation; a potometer estimates water uptake; a leaf cast measures stomatal density. Match each method to its direct measurement.
Haemoglobin Loads Oxygen Cooperatively
HL only
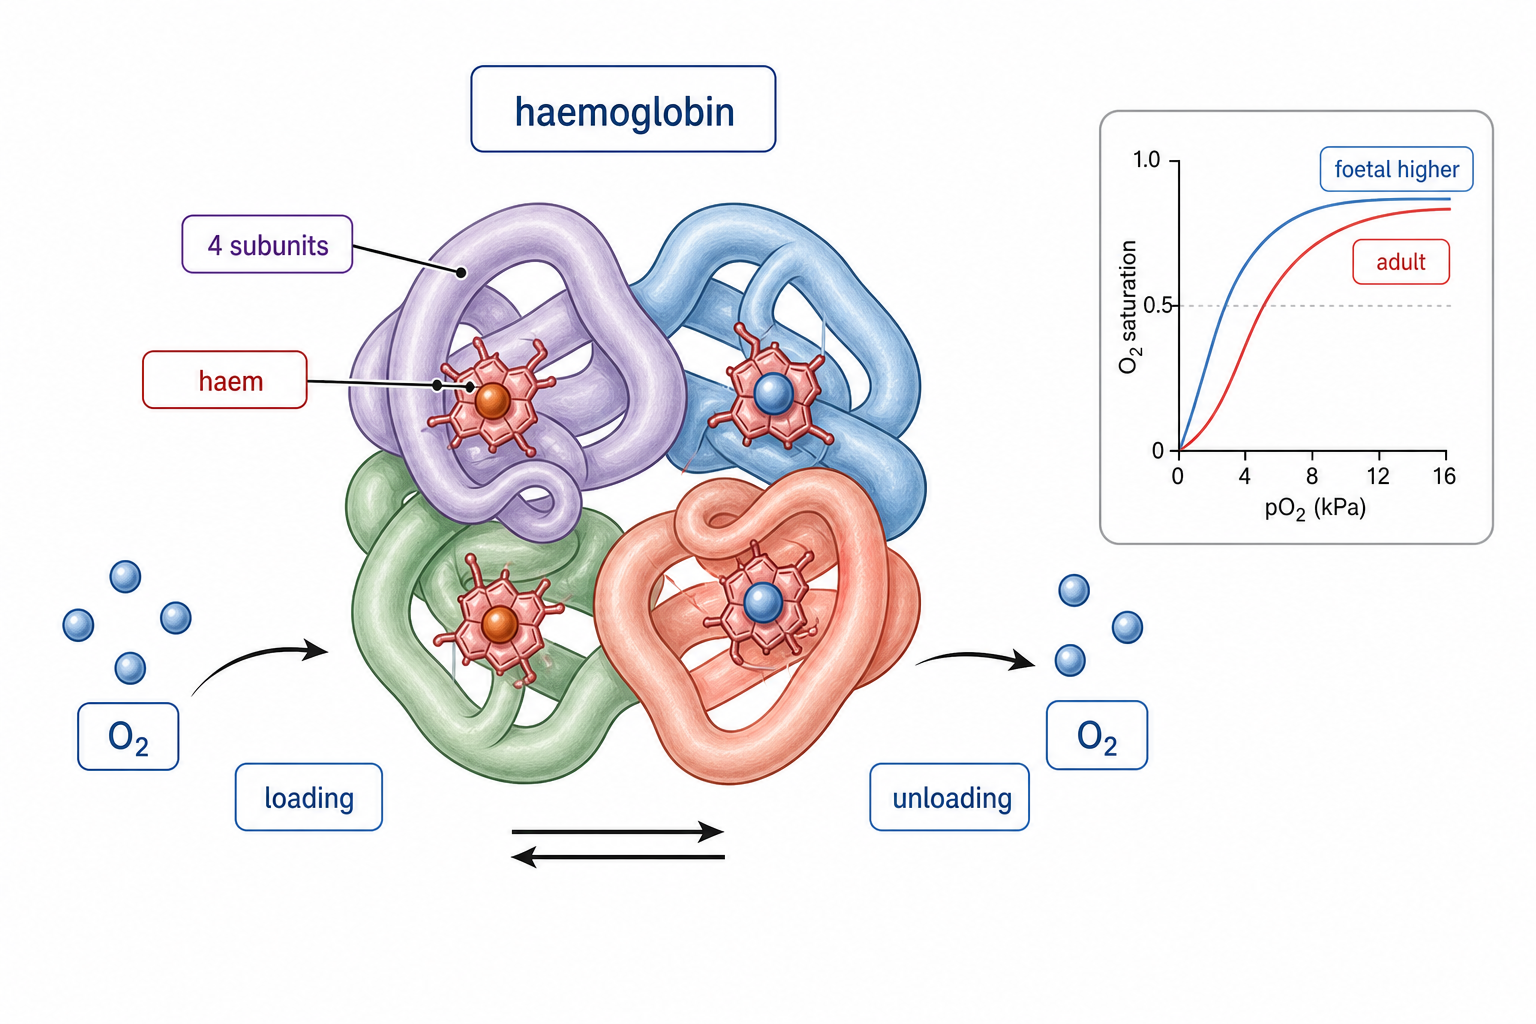
Haemoglobin has four haem-containing subunits and binds O₂ reversibly. Binding one O₂ promotes a higher-affinity conformation, producing the sigmoid oxygen-dissociation curve.
low pO₂: initial binding is difficult
middle range: small pO₂ change causes large saturation change
high pO₂: near plateau, loading remains high despite modest fluctuation
High CO₂ in active tissue lowers pH through carbonic acid and H⁺ production. H⁺ binding stabilizes a lower-affinity haemoglobin state, shifting the dissociation curve right: the Bohr effect.
higher respiration → more CO₂ → more H⁺ / lower pH → reduced O₂ affinity → lower saturation at the same pO₂ → more O₂ unloaded where demand is high
A right shift means lower affinity, not less possible maximum capacity. Compare curves at the same pO₂ to infer the extra unloading.
Read Dissociation Curves at a Fixed Partial Pressure
HL only
Curve height gives percentage saturation at a chosen pO₂. A left-shifted curve has higher affinity; a right-shifted curve has lower affinity and releases more oxygen at the same tissue pO₂.
choose pO₂ on x-axis → draw vertically to each curve → read saturation horizontally → subtract saturations → explain the difference using affinity and biological context
HL Summary: Curve Shape and Position Predict Delivery
HL only
Shape: cooperativity creates a steep responsive region and high-pO₂ plateau. Position: left = higher affinity; right = lower affinity. Conditions: CO₂ and low pH shift adult haemoglobin right.
lungs: high pO₂ → loading near plateau
resting tissue: lower pO₂ → partial unloading
active tissue: lower pO₂ + Bohr shift → greater unloading
placenta: foetal left shift supports uptake
Gas exchange as vital function
[ 3 ]
Outline the process of gas exchange necessary for aerobic respiration in a unicellular eukaryotic organism.
Properties of gas-exchange surfaces
[ 7 ]
Explain the process of gas exchange taking place in the alveoli.
Maintaining concentration gradients
[ 4 ]
Describe how a concentration gradient of oxygen is maintained between the lungs and blood capillaries.
Mammalian lung adaptations
[ 6 ]
A supply of oxygen is needed for aerobic respiration in mitochondria. Describe the features of alveoli in human lungs that adapt them for efficient absorption of oxygen.
Lung ventilation
[ 9 ]
Explain the mechanism of ventilation in the lungs in order to promote gas exchange for cell respiration.
Lung volume measurements
[ 2 ]
Outline how ventilation rate could have been monitored in this study.
Leaf gas exchange adaptations
[ 2 ]
Explain the roles of two leaf structures that help with the process of gas exchange in the leaf.
Leaf tissue distribution
[ 8 ]
Explain how the distribution of tissues in the leaf of a dicotyledonous plant is adapted to production and distribution of products of photosynthesis.
Drawing canvas
Transpiration exam focus
[ 8 ]
Explain how abiotic factors affect the rate of transpiration in terrestrial plants.
Stomatal density
[ 1 ]
Outline how stomatal density in busy Lizzie leaves can be estimated within a known field of view.
Haemoglobin adaptations
HL only
[ 3 ]
Suggest how changes in hemoglobin could help humans become better adapted to living at high altitude.
Bohr shift
HL only
[ 6 ]
Explain, with the aid of an annotated diagram, how physical exercise affects the affinity of hemoglobin for oxygen.
Drawing canvas
Oxygen dissociation curves
HL only
[ 6 ]
Discuss the significance of the oxygen dissociation curves for adult hemoglobin and fetal hemoglobin.
B3.2 Transport
Transport systems move materials through animal blood vessels, plant xylem and phloem, and heart-driven circuits using specialised structures and pressure gradients.
Syllabus
First assessment 2025
Topic
B3.2
Level
HL
Capillaries Slow Blood to Enable Exchange
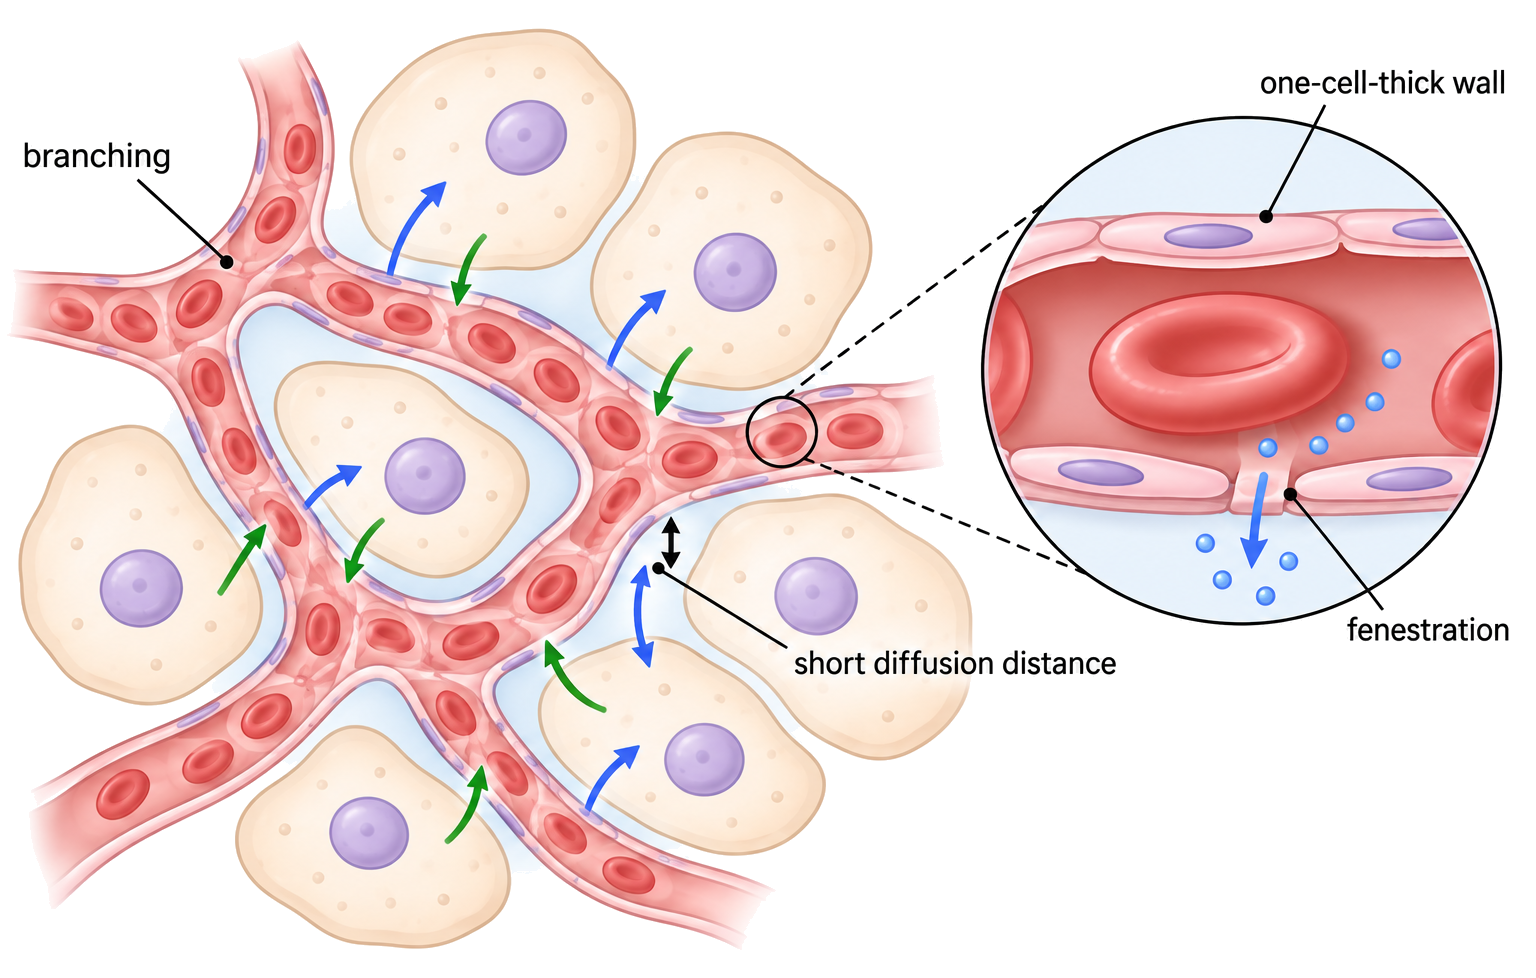
Capillaries are narrow, highly branched exchange vessels whose structure maximizes contact with tissues while minimizing diffusion distance.
Branching produces a very large total surface area. A lumen only slightly wider than a red blood cell brings blood close to the wall, and a one-cell-thick endothelium provides a short path for diffusion.
Arteries and Veins Solve Different Pressure Problems
Arteries carry blood away from the heart under higher pressure; veins return blood at lower pressure and need valves and muscle assistance.
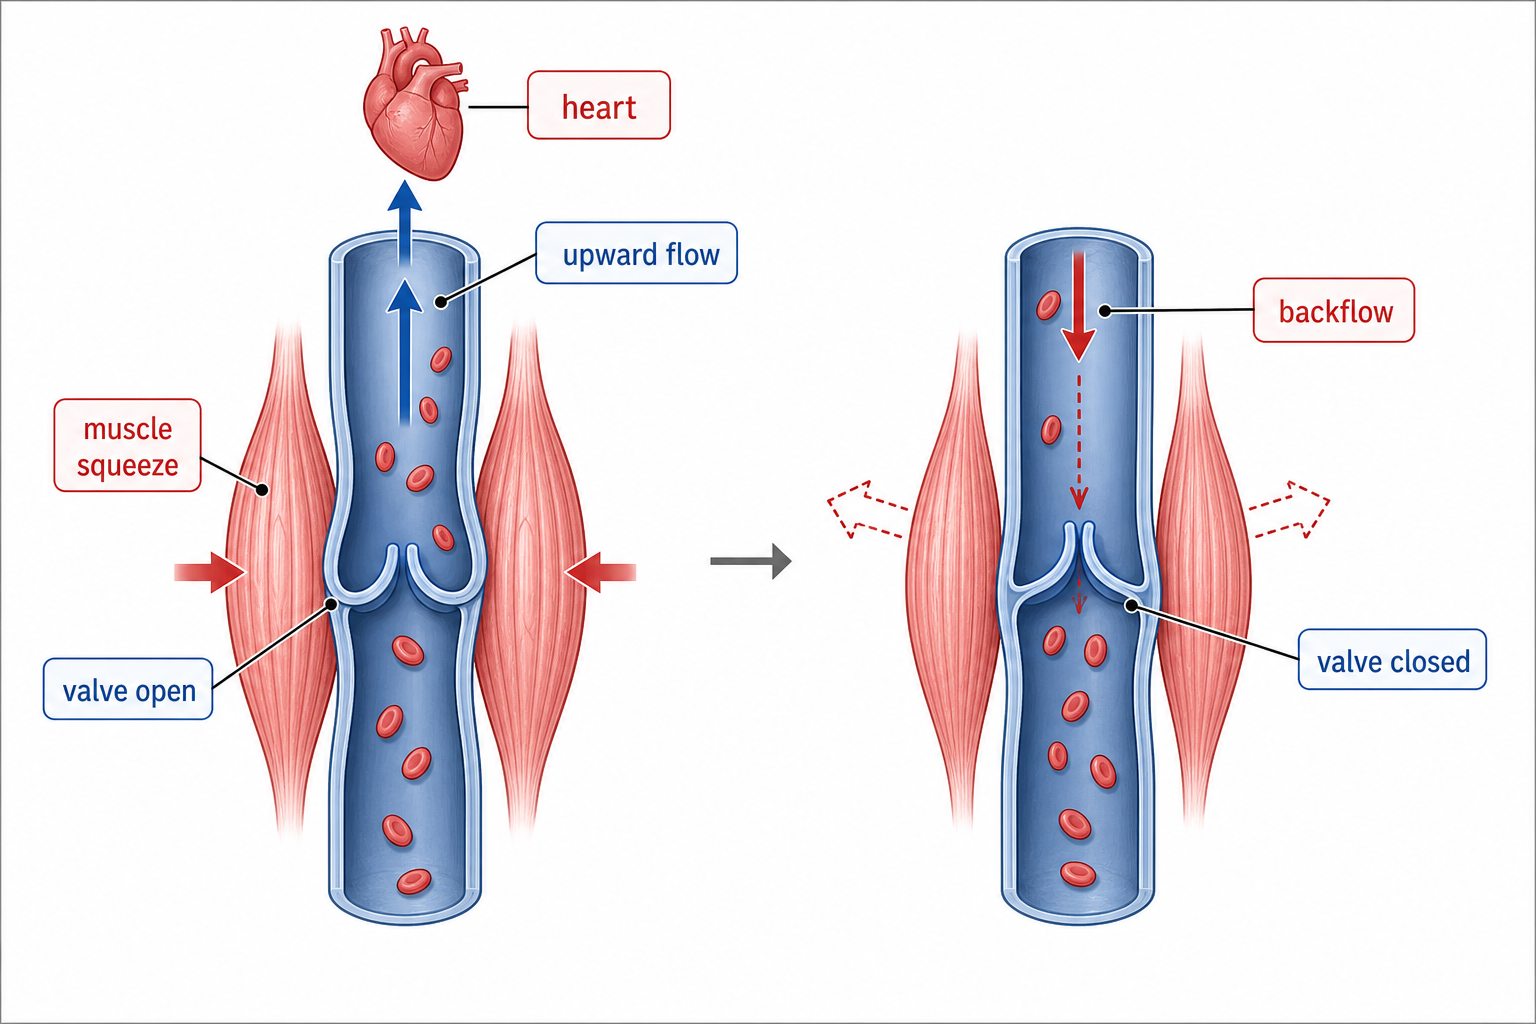
Thick elastic and muscular artery walls absorb pulse pressure. Veins have wider lumens, thinner walls and valves that prevent backflow as surrounding muscles compress them.
Artery Walls Store and Redistribute Pulse Energy
Arteries have thick muscular and elastic walls that maintain a lumen and smooth pressure pulses from the heart.
Elastic recoil helps keep blood moving between heartbeats, while smooth muscle adjusts diameter and resistance. The wall must withstand higher pressure than a vein.
Separate pulse smoothing from resistance control: which wall feature does each job?
Measure Pulse as Repeated Arterial Pressure Waves
Pulse rate is the number of arterial pressure waves per minute, normally corresponding to ventricular contractions.
Place fingertips—not the thumb—lightly over the radial artery at the wrist or the carotid artery in the neck. Count waves for a known interval while the subject is still and use a full minute when maximum accuracy is needed.
Counting 18 pulses in 15 s gives 18 × (60/15) = 72 beats min⁻¹. Repeat after recovery and compare with a digital heart-rate sensor recorded over the same interval.
Valves and Muscles Return Low-Pressure Venous Blood
Veins use large lumens, valves and skeletal-muscle contractions to return blood to the heart despite low pressure.
A wide lumen reduces resistance, valves stop reverse flow and muscle compression raises local pressure. Breathing movements can also help draw venous blood toward the chest.
Coronary Occlusion Cuts ATP Supply to Heart Muscle
A ruptured atherosclerotic plaque can trigger a thrombus that blocks a coronary artery. Oxygen delivery falls, aerobic ATP production fails and prolonged ischaemia kills cardiac muscle: myocardial infarction.
plaque grows beneath damaged endothelium → the lumen narrows and the wall loses elasticity
plaque rupture → platelets and clotting form a thrombus
coronary occlusion → oxygen falls → aerobic ATP production fails → cardiac muscle dies
Transpiration Pulls One Cohesive Water Column
Transpiration creates tension—a negative pressure potential—that pulls a continuous water column from roots to leaves through xylem.
Water evaporating from moist mesophyll cell walls draws replacement water through the wall by capillary action and out of nearby xylem. This lowers pressure in the leaf xylem and transmits tension down the vessel.
Dead, Lignified Xylem Forms a Low-Resistance Tube
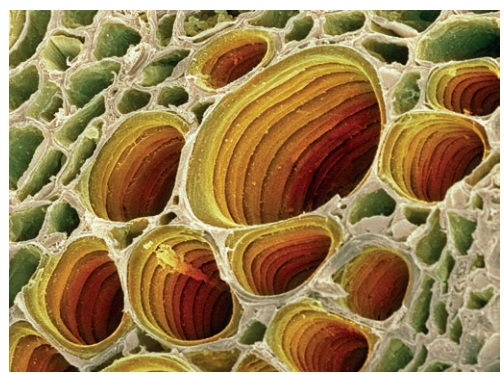
Mature xylem vessel elements form dead, hollow, lignified tubes adapted to carry water under tension with little resistance.
Lignin thickens and waterproofs the wall and prevents collapse under negative pressure. Unlignified pits allow water to enter or leave laterally, bypass a blockage, and move between xylem and surrounding tissue.
A Dicot Stem Separates Water and Assimilate Routes
A transverse section of a young dicot stem has an outer epidermis, cortex beneath it, vascular bundles arranged in a ring and a central pith.
Within each vascular bundle, phloem lies toward the outside, xylem toward the centre and cambium between them. The ring links transport around the stem while lignified xylem and supporting fibres add strength.
A Dicot Root Combines Absorption with Selective Entry
A transverse section of a young dicot root has an outer epidermis, a broad cortex and a central vascular cylinder containing xylem and phloem.
Root hairs extend from epidermal cells to increase absorption area. The endodermis forms the inner boundary of the cortex, surrounding the central vascular tissue and controlling entry to xylem.
SL Summary: Flow Structures
Route
Structural solution
artery
elastic-muscular wall for high pressure
capillary
one-cell wall + many branches for exchange
vein
wide lumen + valves for low-pressure return
xylem
hollow lignified tube for tension
Hydrostatic Pressure Filters Plasma into Tissue Spaces
HL only
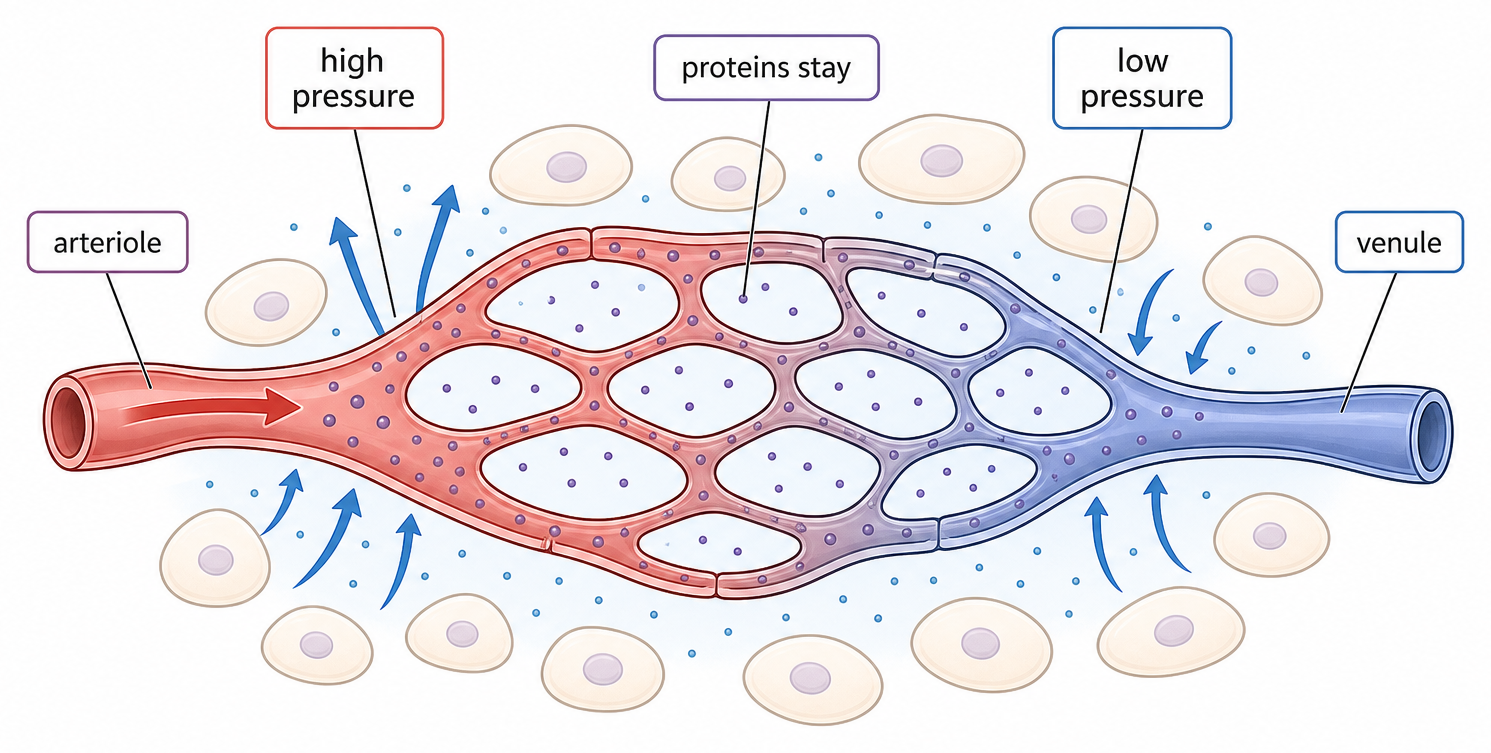
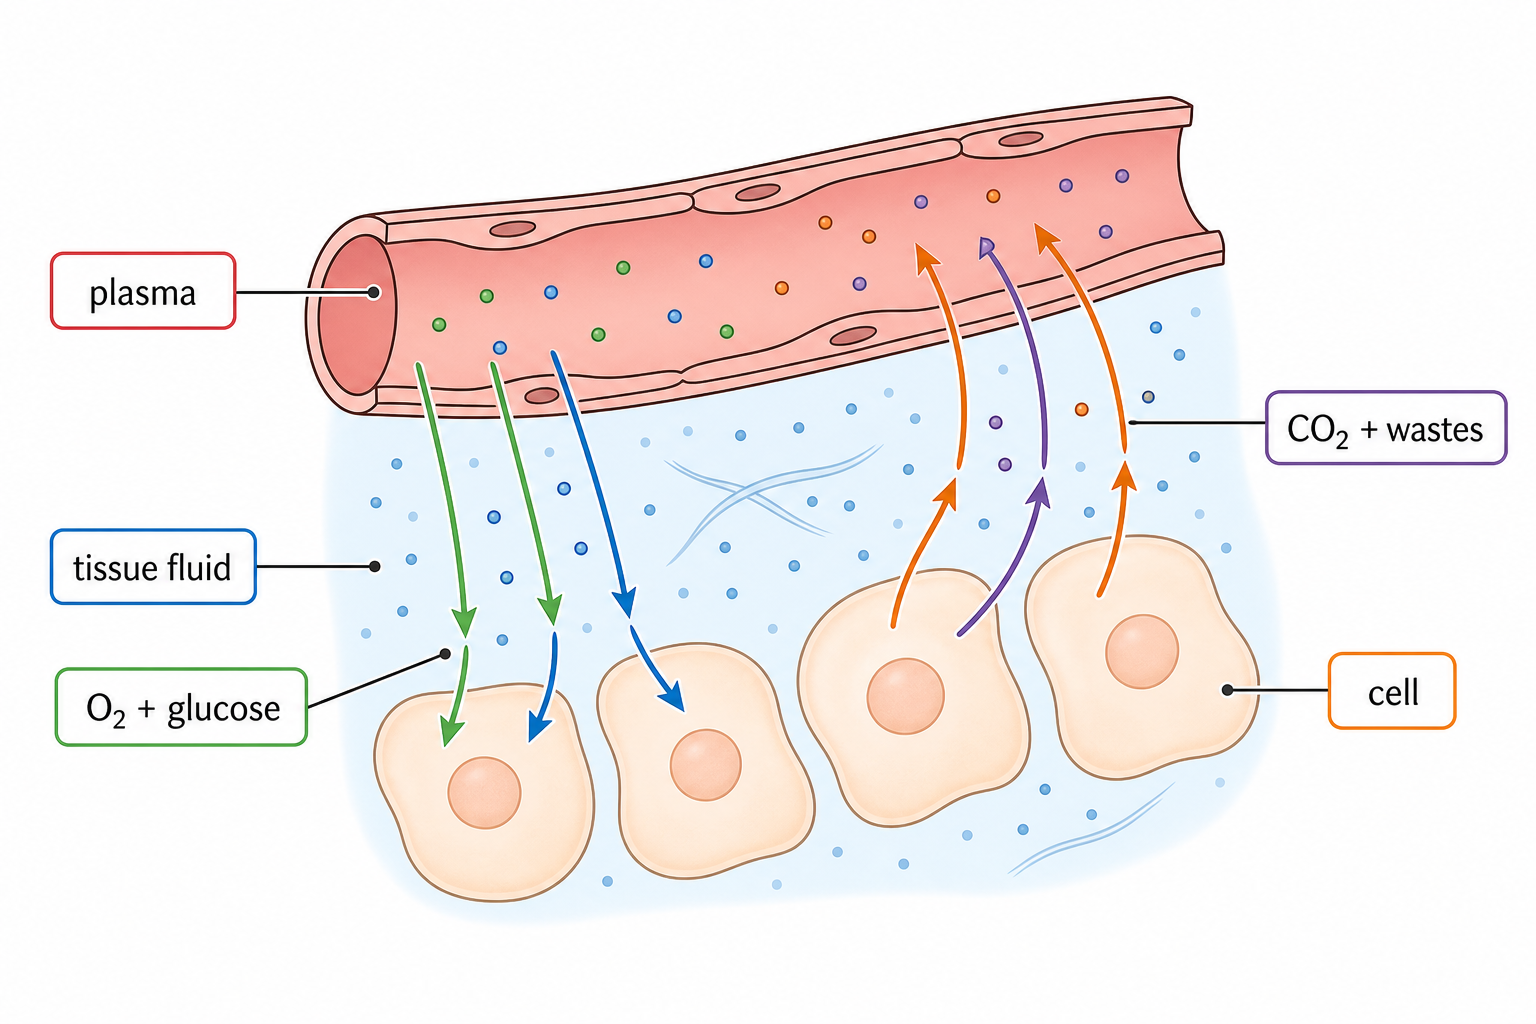
Tissue fluid is formed when hydrostatic pressure at the arteriole end of a capillary forces some plasma out through the capillary wall.
Small solutes and water leave, but cells and most plasma proteins remain in the blood. As pressure falls and osmotic effects change along the capillary, some fluid is reabsorbed.
Tissue Fluid Is the Immediate Exchange Medium
HL only
Tissue fluid is the extracellular liquid that bathes body cells and provides the immediate route for exchange between blood plasma and cell membranes.
Oxygen and nutrients diffuse from tissue fluid into cells, while carbon dioxide and other metabolic wastes diffuse out. After passing cells, tissue fluid tends to contain less oxygen and more carbon dioxide than the plasma that initially supplied it.
Lymph Returns the Fluid That Capillaries Do Not Reabsorb
HL only
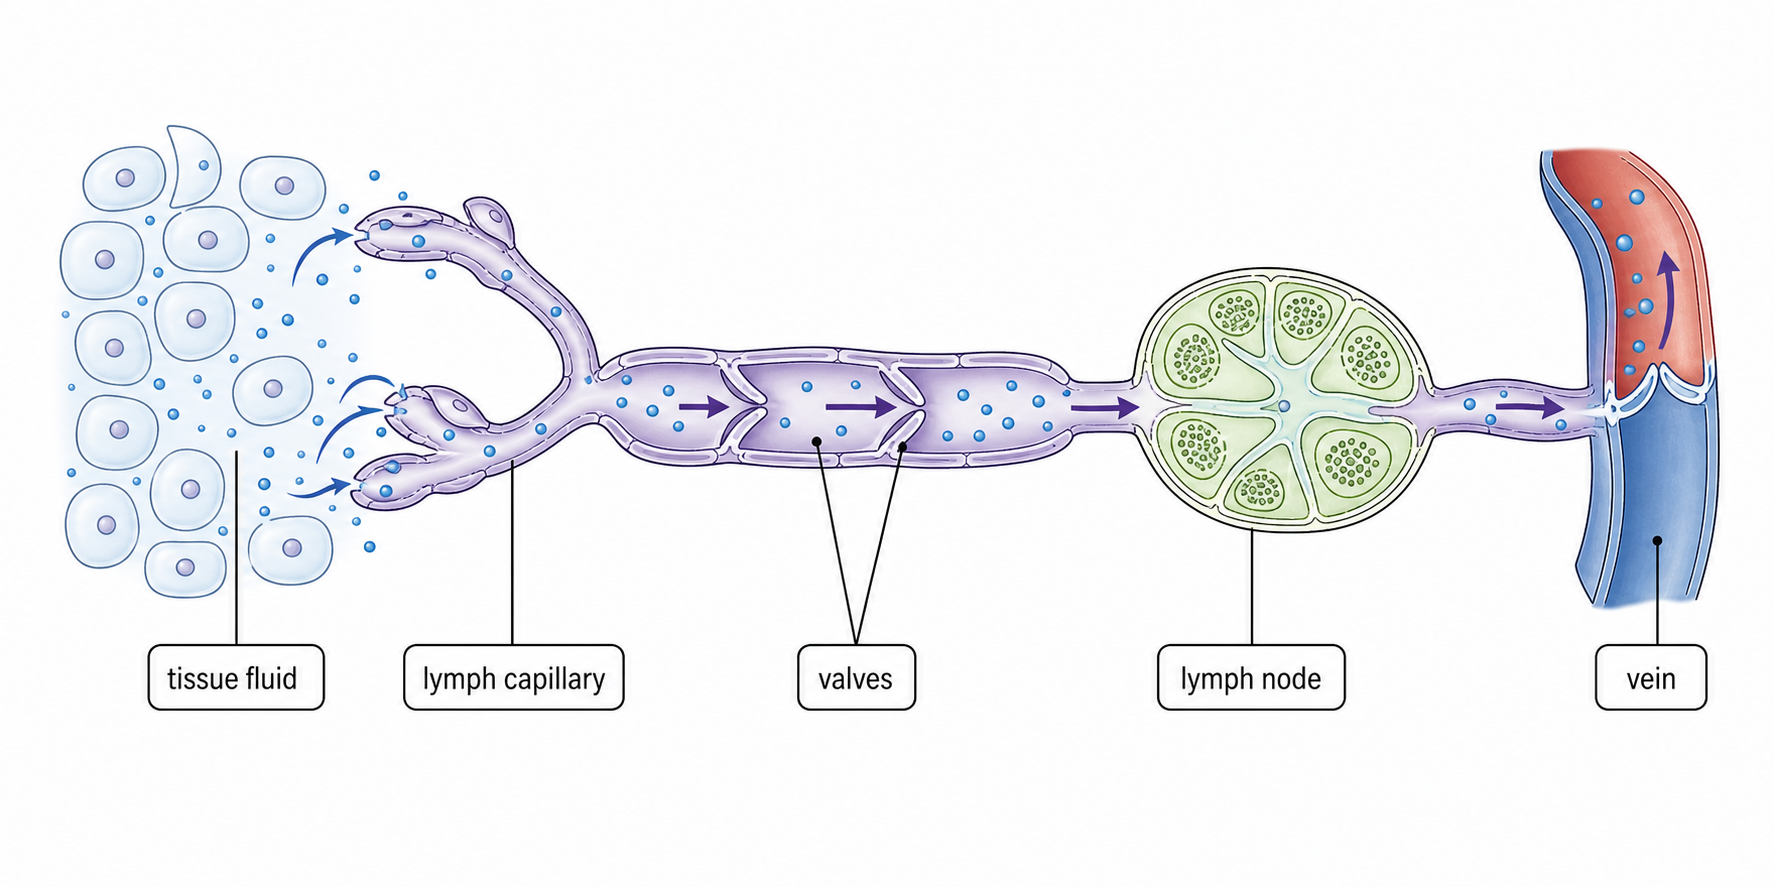
Excess tissue fluid enters blind-ended lymph capillaries and is returned as lymph to the blood circulation.
Larger lymph ducts use one-way valves, smooth-muscle contraction and compression by body movement to move lymph at low pressure. The ducts eventually empty into large veins near the heart.
A complete circuit passes through one or two pumps
HL only
Bony fish
Mammals
Circuit
Heart → gills → body → heart
Right heart → lungs → left heart → body → right heart
Heart passages per circuit
One: single circulation
Two: double circulation
In mammals, the pulmonary circuit serves the lungs; the systemic circuit serves the rest of the body.
The second pump restores pressure without mixing blood
HL only
In fish, blood loses pressure while crossing gill capillaries, then continues to body tissues without another pump.
In mammals, blood returns from lung capillaries to the left ventricle, which re-pressurizes it for systemic delivery. The lung circuit can operate at lower pressure.
A complete septum separates oxygenated and deoxygenated blood, so the systemic supply is not diluted by mixing.
Trace one drop through the four-chambered heart
HL only
1
Body to lungs
Body → venae cavae → right atrium → tricuspid AV valve → right ventricle → pulmonary semilunar valve → pulmonary artery → lungs. This is the deoxygenated route.
2
Lungs to body
Lungs → pulmonary veins → left atrium → mitral AV valve → left ventricle → aortic semilunar valve → aorta → body. This is the oxygenated route.
Arteries carry blood away from the heart; veins return it. Pulmonary artery and veins are the oxygenation exceptions to the usual pattern.
Heart structures solve different pumping problems
HL only
Structure
Function
Septum
Keeps right and left blood pathways separate.
Right ventricle
Pumps to the lungs at lower pressure.
Thicker left-ventricular wall
Generates higher systemic pressure.
Coronary arteries
Supply oxygen and nutrients to cardiac muscle.
Valves are pressure gates, not active pumps
HL only
A valve opens when pressure behind it exceeds pressure ahead; it closes when the pressure difference reverses.
AV valves allow atria → ventricles and close when ventricular pressure rises.
Semilunar valves allow ventricles → arteries and close when arterial pressure exceeds ventricular pressure.
Tendinous cords stop AV valve flaps inverting into the atria during ventricular systole.
Together these structures preserve one-way flow: atrium → ventricle → artery.
The AV delay makes atria contract before ventricles
HL only
1
SA node and atria
The heart is myogenic: its sinoatrial (SA) node starts excitation without a brain signal. It spreads across both atria; atrial systole completes ventricular filling.
2
AV node delays
The atrioventricular (AV) node delays conduction so the atria empty before the ventricles contract.
3
Ventricles eject
The bundle of His and Purkinje fibres conduct to the ventricles. Contraction from the apex ejects blood into the arteries.
Pressure changes, not signals, open the valves
HL only
An electrical impulse triggers muscle contraction; the resulting pressure difference opens or closes each valve. Blood flows from higher to lower pressure.
Phase
Pressure change
Blood movement
Atrial systole
Atria contract.
AV valves open; ventricles fill.
Ventricular systole
Ventricular pressure rises above atrial, then arterial pressure.
AV valves close; semilunar valves open; blood leaves.
Diastole
Ventricular pressure falls below arterial, then atrial pressure.
Semilunar valves close; AV valves reopen; filling resumes.
The two heart sounds mark valve closure
HL only
Sound
Valve closure
Transition
First: ‘lub’
AV valves
Start of ventricular systole
Second: ‘dub’
Semilunar valves
Start of ventricular diastole
A heart sound signals closure, not opening. Use the pressure difference to explain why the valve has just shut.
One route, two pumps, one coordinated beat
HL only
Route: right heart → lungs → left heart → body → right heart.
Separation: the septum keeps the two blood pathways apart.
Pressure: the thicker left ventricular wall re-pressurizes blood for systemic delivery.
Direction: AV and semilunar valves respond to pressure differences, preventing backflow.
Timing: SA-node excitation, then AV-node delay, lets atria fill the ventricles before they eject blood.
For any moment in a heartbeat, ask: Which chamber is contracting? Which side of each valve has higher pressure? Where can blood move next?
Ion Loading Creates Positive Root Pressure
HL only
Root pressure is a positive pressure potential generated when root cells actively load mineral ions into xylem and water follows by osmosis.
ATP-powered ion transport raises solute concentration and lowers xylem water potential. Water enters from surrounding root tissue, creating hydrostatic pressure that can push xylem sap upward.
Root pressure is most useful when transpiration pull is weak—for example during high humidity, at night, or in spring before leaves of deciduous plants have opened.
Source Loading Creates a Phloem Pressure Gradient
HL only
Phloem translocates sucrose, amino acids and other carbon compounds as sap from sources to sinks through sieve tube elements supported by companion cells.
Companion cells contain many mitochondria for ATP-dependent loading and unloading and connect to sieve elements by plasmodesmata. Source loading draws water from xylem and raises pressure; sink unloading lowers pressure, driving bulk flow.
root ion loading + osmosis → positive xylem pressure
phloem source loading + water entry → mass flow to sinks
Name the pressure source, the barrier or valve, and the resulting flow direction.
Capillary adaptations
[ 3 ]
Explain how the structure of capillaries relates to their functions.
Artery and vein structure
[ 8 ]
Explain the structures and functions of arteries and veins.
Artery adaptations
[ 5 ]
Explain how the structure of an artery allows it to carry out its function efficiently.
Pulse rate measurement
[ 2 ]
Outline one method that the researchers could have used to measure heart rate in this study.
Vein adaptations
[ 2 ]
Deduce what the experiment demonstrated about the circulation of blood.
Coronary artery occlusion
[ 2 ]
Outline the causes and consequences of blood clot formation in coronary arteries.
Water transport in plants
[ 8 ]
Explain the process of water uptake and transport by plants.
Xylem vessel adaptations
[ 3 ]
Joints are part of the musculoskeletal system of animals, which provides support and movement to the body. Xylem provides support in plants and also transports water and minerals.
Explain the adaptations of xylem for its functions.
Stem tissue distribution
[ 2 ]
Describe the distribution of vascular tissues in the stem of dicotyledonous plants.
Root tissue distribution
[ 2 ]
Label tissues X and Y .
Single vs. double circulation
HL only
[ 8 ]
Explain how circulation of the blood to the lungs and to other systems is separated in humans and what the advantages of this separation are.
Mammalian heart adaptations
HL only
[ 6 ]
Draw a labelled diagram of the human heart showing the attached blood vessels.
Drawing canvas
Cardiac cycle stages
HL only
[ 6 ]
Explain the events of the cardiac cycle, including the heart sounds.
Root pressure generation
HL only
[ 2 ]
Explain how root pressure is generated to cause movement of water through seedlings.
Phloem adaptations
HL only
[ 7 ]
Describe the transport of carbon compounds such as sucrose and amino acids in phloem.
B3.3 Muscle and motility [HL only]
Muscle and motility connect sarcomere contraction, antagonistic muscles, skeletons, synovial joints and locomotor adaptations to movement across biological scales efficiently.
Syllabus
First assessment 2025
Topic
B3.3
Level
HL
Movement Does Not Always Mean Locomotion
HL only
Movement changes position or shape; locomotion moves the whole organism from one place to another. A sessile organism remains attached yet may move body parts or grow directionally.
Locomotion can improve access to food, escape from predators, mate finding and migration. The benefit must outweigh its metabolic cost and exposure to risk.
Sliding Filaments Shorten the Sarcomere
HL only
A sarcomere runs from Z line to Z line. During contraction, myosin pulls thin actin filaments toward the centre, increasing overlap and bringing Z lines closer; neither filament shortens.
I band and H zone narrow → overlap increases
A band stays constant → myosin length is unchanged
Z lines approach → sarcomere shortens
Calcium Opens the Site; ATP Resets the Myosin Head
HL only
Ca²⁺ permits cross-bridge formation, while ATP controls detachment and re-cocking. Repeated myosin power strokes slide actin toward the sarcomere centre.
1 Ca²⁺ binds troponin; tropomyosin moves
2 energized myosin–ADP–Pi binds actin
3 Pi/ADP release drives the power stroke
4 ATP binding detaches myosin
5 ATP hydrolysis re-cocks the head
Titin Recoils; Antagonistic Muscles Reverse Movement
HL only
Skeletal muscles generate active force by shortening; they cannot actively push themselves longer. Titin and antagonistic muscle pairs provide two different routes back toward the starting state.
titin spans from thick filament toward the Z line, centres myosin and resists overstretching
stretched titin stores elastic energy and recoils as the sarcomere relaxes
an agonist contracts while its antagonist relaxes; reversing the movement swaps their roles
Titin restores sarcomere alignment and passive length; it does not replace the opposing muscle force needed to rotate a joint in the reverse direction.
A Motor-Neuron Signal Releases Calcium around Myofibrils
HL only
A motor unit is one motor neuron and all muscle fibres it controls. At each neuromuscular junction, neuronal excitation is converted into sarcolemma excitation and then Ca²⁺ release from sarcoplasmic reticulum.
Muscles pull; they do not push. A tendon transmits tension to a rigid skeletal element, a joint acts as fulcrum, and an antagonistic muscle produces the reverse movement.
At the elbow: joint = fulcrum, biceps force = effort, forearm/hand load = resistance. Attachment close to the joint sacrifices force advantage for speed and range.
Joint Shape Sets the Available Range of Motion
HL only
A synovial joint combines smooth cartilage, lubricating synovial fluid, stabilizing ligaments and force-transmitting tendons. Articulating surface shape constrains its directions of movement.
ball-and-socket hip/shoulder → movement in three planes, including circumduction
hinge knee/elbow → mainly flexion and extension
goniometer → angular change between starting and safe maximum positions
Antagonistic Intercostals Change Thoracic Volume
HL only
External and internal intercostals have opposing fibre directions. Their contraction moves ribs differently, changing thoracic volume and therefore lung pressure.
Marine Mammals Reduce Drag and Surface Efficiently
HL only
Water is dense, so marine mammals combine a streamlined body with controlled thrust and rapid surface ventilation. They remain air-breathing mammals.
Feature
Mechanical or respiratory effect
tapered body and reduced projections
reduces drag in dense water
forelimb flippers
steer and stabilize the body
horizontal tail flukes driven by axial muscles
generate up-down thrust
dorsal blowhole
permits rapid ventilation with little emergence
Summary: From Molecular Pull to Locomotion
HL only
motor signal → ACh → muscle action potential → SR Ca²⁺ → exposed actin sites → cross-bridge cycling → sarcomere shortening → tendon tension → joint rotation
ATP detaches and re-cocks myosin; Ca²⁺ reuptake stops new bridges; titin restores passive sarcomere length, while antagonistic muscle action reverses joint movement. Whole-body form then determines whether force becomes efficient locomotion.
Movement adaptations
HL only
[ 2 ]
Microscopic eukaryotes include Euglena and Paramecium. Outline the range of cellular structures used for locomotion in these organisms.
Sliding filament model
HL only
[ 8 ]
Actin and myosin are two proteins found in muscles. Explain how skeletal muscle contracts, including the interaction of these proteins.
Drawing canvas
Titin and antagonistic muscles
HL only
[ 2 ]
Explain the role of the protein titin in muscle relaxation.
Motor units
HL only
[ 1 ]
What happens when an action potential reaches motor end plates?
Skeletons as anchorage and levers
HL only
[ 1 ]
Outline how the muscle attachment of insects differs from humans.
Synovial joint movement
HL only
[ 2 ]
State the function of structures I and II.
I:
II:
Range of motion
HL only
[ 2 ]
Compare the movements of the hip joint and the knee joint.
B4.1 Adaptation to environment
Adaptation to environment explains how abiotic conditions, tolerance ranges, habitats and biomes shape organism survival, distribution and specialised traits over time.
Syllabus
First assessment 2025
Topic
B4.1
Level
HL
A Habitat Is a Place Plus Its Conditions
A habitat is the physical and biological environment where an organism lives. Describe location together with resources, abiotic conditions and interactions.
A microhabitat is a smaller local environment with distinct conditions. A niche goes further by describing how a species uses resources and interacts within its habitat.
An Adaptation Solves a Particular Abiotic Challenge
An adaptation is an inherited feature that increases survival or reproduction under particular conditions. Explain it as challenge → feature → physical effect → fitness benefit.
marram: rolled leaf + hairs + sunken stomata → humid trapped air → smaller water-vapour gradient
mangrove: aerial roots and salt exclusion/excretion → aeration and ion balance in saline, anoxic mud
Abiotic Limits Filter Where a Species Can Persist
Temperature, water, light, salinity, pH, oxygen, minerals and substrate can restrict distribution when they fall outside the range for survival, growth or reproduction.
sample abundance at fixed positions along a transect + measure candidate abiotic variables with calibrated sensors + repeat with equal effort → test whether distribution changes with the gradient
A Tolerance Curve Has an Optimum, Stress Zones and Limits
For one environmental factor, a species has a critical minimum and maximum. Performance is highest near an optimum and declines through zones of physiological stress toward either limit.
choose an x-value → locate performance on the curve → classify optimum, stress or intolerance → remember another factor may still prevent the species occurring
Coral Reefs Require Several Conditions at Once
Reef-building corals depend on warm, shallow, clear, well-lit seawater with suitable salinity and carbonate chemistry. Photosynthetic symbionts supply much of the energy supporting calcification.
greater depth or turbidity → less light
thermal stress → bleaching risk
lower pH → harder CaCO₃ deposition
sediment/nutrient disturbance → damaged or shaded coral
Climate Narrows the Likely Terrestrial Biome
Long-term temperature and rainfall are the main predictors of terrestrial biomes. Seasonality and insolation refine the prediction because they change water availability, growing season and productivity.
warm + wet year-round → tropical forest
warm + very dry → hot desert
cold + short growing season → tundra
seasonal/moderate rain → grassland or temperate forest, depending on water balance
Similar Climates Can Produce Similar Biomes
A biome is a group of ecosystems with similar abiotic conditions and broadly similar communities. It is defined by climate and dominant vegetation, not by a single species list or a political boundary.
Separated regions can experience the same selection pressures. Natural selection may therefore favour independently evolved features with similar functions—convergent evolution—so their communities can have similar forms even though the species differ.
Climate predicts the broad biome; soil, altitude, fire, grazing and local history can shift the ecosystem found at one site, so biome boundaries are gradual rather than perfectly sharp.
Desert Species Evade Heat or Conserve Water
Hot deserts combine intense daytime heat, large temperature changes and scarce, unpredictable water. Survival depends on evading the worst conditions or enduring them while minimizing water loss.
cactus: succulent photosynthetic stem stores water; spines replace broad leaves and reduce leaf area
kangaroo rat: nocturnal burrowing avoids daytime heat; concentrated urine and no sweating reduce water loss
camel: variable body temperature and water-conserving excretion reduce losses; hump fat supplies energy and metabolic water
The feature must be linked to its physical effect: a camel's hump stores fat, not liquid water, and a cactus spine helps conserve water because it replaces a leaf and deters herbivores.
Rainforest Species Exploit Layers and Scarce Resources
Tropical rainforests are warm and wet, but light, space and mineral nutrients are unevenly distributed through their vertical layers. Adaptations improve access to these resources or reduce exposure to predators.
pitcher plant: modified leaves trap and digest animals → mineral ions supplement nutrient-poor rooting sites
flying lizard: skin stretched between extended ribs forms a gliding surface → movement between trees without descending
gibbon: long forelimbs, hook-like fingers and mobile shoulders → efficient brachiation through the canopy
orchid mantis: flower-like form attracts prey and provides camouflage
Pitcher plants still photosynthesize for carbon and energy; captured animals mainly supply scarce mineral nutrients such as nitrogen.
Summary: Predict Distribution from Environment and Adaptation
measure environment → locate tolerance limits and optimum → predict possible distribution → test abundance in the field → explain how adaptations change performance
microhabitat: local moisture, light and temperature
species range: interacting tolerance, adaptation and dispersal limits
biome: long-term climate filters whole communities; similar pressures can produce convergent forms
Habitat definition
[ 1 ]
Define habitat.
Adaptations to abiotic environment
[ 2 ]
Explain one feature of tree roots that help trees to survive in mangrove swamps.
Abiotic variables affecting distribution
[ 4 ]
Discuss how abiotic factors can affect the distribution of species in an ecosystem.
Range of tolerance of limiting factor
[ 2 ]
Using the data in the graphs, discuss whether species in Group 1 or Group 2 are more likely to be adversely affected by increases in soil temperature due to global warming.
Coral reef formation conditions
[ 2 ]
Outline one way in which reef-building corals are affected by increasing atmospheric carbon dioxide.
Terrestrial biome distribution
[ 3 ]
Outline how the type of stable ecosystem that will develop in an area can be predicted based on climate.
Biomes exam focus
[ 2 ]
State what a biome is.
Adaptations to hot deserts and tropical
[ 7 ]
Describe adaptations that are typical of plants growing in hot deserts throughout the world.
B4.2 Ecological niches
Ecological niches connect species roles, nutrition modes, adaptations and competition to how organisms use resources and interact within communities over time.
Syllabus
First assessment 2025
Topic
B4.2
Level
HL
A Shared Coast Does Not Mean a Shared Niche
A species' niche is its role in a community: the conditions it tolerates, resources it uses, times and places it is active, and interactions that affect survival and reproduction.
cormorant: feeds nearer shore, often on seabed fish
shag: feeds farther offshore in upper water and nests on narrower ledges
Their habitat overlaps, but diet, feeding position and nesting behaviour separate their niches and reduce competition.
Oxygen Draws a Physiological Niche Boundary
Oxygen availability changes which respiration pathways can operate and whether reactive oxygen compounds can be tolerated. That physiology predicts position along an oxygen gradient.
Organism type
Response to oxygen
Example and likely niche
obligate aerobe
requires O₂ for respiration
Mycobacterium tuberculosis in oxygenated tissue
obligate anaerobe
oxygen is toxic; only anaerobic metabolism
methanogens in anoxic sediments or guts
facultative anaerobe
uses aerobic respiration when O₂ is present, switches without it
E. coli across oxygen-rich and oxygen-poor sites
“Anaerobe” does not always mean oxygen is poisonous: that is true of an obligate anaerobe, whereas a facultative anaerobe can grow on either side of the oxygen boundary.
Classify Nutrition by Inputs and Where Food Is Processed
A nutritional mode specifies the source of carbon and energy and how usable molecules enter cells. The same habitat can contain species with very different routes.
Mode
Carbon / food source
Decisive process
photoautotrophic
inorganic CO₂
light energy drives carbon fixation
holozoic
ingested organic matter
internal digestion, then absorption
saprotrophic
dead organic matter
external digestion, then absorption
mixotrophic
inorganic and organic carbon
combines or switches routes
Do not classify by energy alone: light is an energy source, while carbon dioxide or organic food supplies the carbon atoms used to build biomass.
Photoautotrophs Convert Light Energy and Fix Carbon
Photosynthetic pigments absorb light. The captured energy produces ATP and reducing power, which drive the reduction of carbon dioxide into organic molecules.
light energy → chemical energy
inorganic CO₂ → organic carbon compounds
organic compounds → biomass and respiratory substrate
Plants and algae are eukaryotic photoautotrophs; cyanobacteria are prokaryotic photoautotrophs whose oxygen-releasing photosynthesis helped change Earth's atmosphere. Light supplies energy—not carbon or newly created energy.
Holozoic and Saprotrophic Feeding Differ at Digestion
Holozoic consumer
Saprotroph
starts with
ingested living or recently killed matter
dead matter or waste outside the organism
digestion
internal
enzymes secreted onto the material
uptake
soluble products absorbed from gut
soluble products absorbed across surface
examples
herbivores, carnivores, omnivores
many fungi and bacteria
Saprotrophs release inorganic nutrients that producers can reuse, but energy is not recycled: decomposers respire organic molecules and energy ultimately leaves the ecosystem as heat.
A detritivore ingests dead material and digests it internally, so it is holozoic rather than saprotrophic. Egestion removes undigested food; excretion removes metabolic waste.
A Mixotroph Can Change Its Resource Strategy
A mixotroph combines autotrophic and heterotrophic nutrition. The two contributions need not be equal or simultaneous; conditions can shift which route dominates.
In light, Euglena can photosynthesize in chloroplasts. It can also take in bacteria by phagocytosis and digest them in food vacuoles. Facultative mixotrophs shift route as light, prey or nutrients change; obligate mixotrophs require both contributions.
Archaea Do Not Share One Nutritional Mode
Archaea form one domain, but different species occupy different metabolic niches. Domain membership does not imply one habitat, carbon source or energy pathway.
Route
Energy mechanism
Carbon source / example
light-driven pumping
retinal protein pumps ions; gradient drives ATP synthase
often organic carbon; halobacteria, without oxygenic photosynthesis
chemoautotrophy
oxidation of inorganic substances supplies energy
CO₂ fixed into organic matter; hydrogen-dependent archaea
heterotrophy
organic molecules are oxidized
organic carbon; some marine archaea degrade lignin
Methanogens occupy anoxic niches and use electron donors such as hydrogen while producing methane. Their metabolism shows why not all chemical energy entering food webs originally comes from sunlight.
Nutrition Checkpoint: Track Energy, Carbon and Digestion
For any organism, ask:
Is oxygen required, toxic or optional?
Is energy captured from light, inorganic chemical reactions or organic molecules?
Does carbon come from CO₂ or pre-existing organic matter?
Is digestion internal, external, both or absent?
photoautotroph ≠ organism that creates energy
holozoic consumer ≠ every heterotroph
detritivore ≠ saprotroph
mixotroph ≠ half-autotroph at all times
archaeon ≠ one fixed metabolism
Tooth Shape Reveals a Food-Processing Job
Tooth
Shape and main mechanical job
incisor
sharp edge slices or bites off pieces
canine
pointed crown grips and tears
premolar
broader surface crushes and begins grinding
molar
large surface grinds food repeatedly
Dietary inference uses more than one tooth: relative tooth area, cusp shape, enamel wear, jaw robustness and muscle-attachment sites reveal the forces and movements emphasized during feeding.
Form supports a probable processing strategy, not a complete menu. Tools, cooking, ancestry and convergent evolution can weaken a simple tooth-to-diet rule.
Infer Hominid Diet from a Cluster of Skull Features
Evidence pattern
Supported inference
gorilla: large post-canine teeth, robust jaw, large chewing muscles and sagittal crest
repeated forceful processing of tough vegetation
Paranthropus robustus: megadont cheek teeth, thick enamel and robust mandible
high chewing loads from tough or abrasive foods
human: smaller canines and molars, gracile jaw, rounded molar cusps
generalized omnivorous processing with less emphasis on forceful grinding
Make the inference from the combined pattern, then state its limit. Tooth wear and muscle attachment strengthen a claim; one isolated feature cannot prove exactly which foods were eaten.
Herbivores and Plants Change Each Other's Selective Environment
Herbivore route to food
Plant defence
Possible counter-adaptation
chewing mouthparts remove tissue
thorns, spines or stinging hairs raise handling cost
selective feeding or protected mouthparts
aphid stylet reaches phloem sap
tougher tissues or defensive chemistry
pectinase helps the stylet pass between cell walls
microbial cellulose digestion
low digestibility and toxic compounds
symbiotic microbes or detoxifying enzymes
A defence lowers feeding success or raises its cost; it rarely makes a plant invulnerable. If heritable counter-adaptations improve feeding, selection can favour them in the herbivore population, which in turn changes selection on the plant.
Nettle hairs deliver irritants, oleander contains cardiac glycosides and cassava releases cyanide precursors unless processed. Always link the named chemical or structure to how it changes herbivore survival or feeding.
Predation Can Fail at Several Different Stages
Interaction stage
Predator advantage
Prey resistance
detect
acute vision, smell, heat sensing or echolocation
camouflage, stillness or hiding
approach
stealth or coordinated movement
vigilance and wide field of view
capture
speed, grasping limbs, claws or venom
escape, grouping or erratic movement
handle
strong jaws or digestive tolerance
armour, spines, toxins or chemical spray
Forward-facing eyes increase binocular overlap for depth estimation; side-facing eyes broaden surveillance. Neither arrangement alone labels every species as predator or prey—the mechanism must be interpreted with behaviour and ecology.
Adaptations often work together: rolling into a ball is useful because a tough exterior then faces the predator, and a stealth predator benefits from both still behaviour and camouflage.
Colour Can Hide, Warn or Deceive
Pattern
Information available to predator
Result
camouflage
prey matches background
detection becomes less likely
aposematic colour
conspicuous pattern is associated with toxicity or defence
experienced predators avoid attack
Batesian mimicry
harmless species resembles a defended model
predator may avoid the mimic
poison dart frog: toxin plus bright warning colour
coral snake: defended model with warning bands
non-venomous king snake: gains protection by resembling the model
bombardier beetle: chemical spray plus warning and escape behaviour
Mimicry works only if predators encounter and avoid the defended model often enough. Conspicuous colour is therefore not automatically poor camouflage; its function depends on the receiver's learned or evolved response.
Forest Plants Pay Different Costs to Reach Light
A forest canopy intercepts most incoming light, creating a steep vertical gradient. Plant form determines how a species reaches light and which costs it accepts.
canopy tree: builds costly support and transport tissue for first access to light
liana: roots in soil but uses a tree for support
epiphyte: starts high on a branch, gaining light but facing water and nutrient limits
shade plant: persists in weak filtered light with large leaves and suitable pigments
A strangler fig can surround and eventually kill its host, while an ordinary epiphyte uses support without necessarily harming it. Position changes access to light, but also water, minerals and pollinators.
Interactions Contract a Potential Niche into a Realized Niche
The fundamental niche is the range of conditions and resources a species could use from its adaptations and tolerance limits. The realized niche is the range it actually occupies after competition, predation, mutualism and dispersal act.
Observe the focal species with the competitor present → remove the competitor while keeping abiotic conditions comparable → observe expansion into previously unoccupied space → infer that competition had narrowed the realized niche.
A realized niche is often narrower than the fundamental niche, but beneficial interactions can also make occupancy possible. Absence alone does not reveal which interaction or dispersal barrier is responsible.
Complete Niche Overlap Makes Coexistence Unstable
Competitive exclusion predicts that two species cannot coexist indefinitely under stable conditions if they occupy effectively identical niches and depend on the same limiting resource.
In Gause's cultures, Paramecium aurelia and P. caudatum both grew when cultured separately. In mixed culture, P. aurelia increased while P. caudatum declined to exclusion. The difference between separate and mixed cultures identifies interspecific competition.
Ecological situation
Expected outcome
strong overlap for one limiting resource
one population declines or is locally excluded
partitioning by food, space or time
overlap falls and coexistence becomes possible
changing conditions
competitive advantage may alternate
The principle is conditional, not a claim that competitors never coexist. Field communities can retain competition when niches overlap only partly or environments vary.
Summary: Build a Niche from Constraints and Interactions
A niche connects abiotic tolerance + resource acquisition + activity and form + interactions. These dimensions explain how a species survives and reproduces, not merely where it is found.
potential conditions and resources → fundamental niche
competition, predation, mutualism and dispersal → realized niche
strong overlap for a limiting resource → competition
partitioning by food, space or time → reduced overlap and possible coexistence
To explain an adaptation, name the challenge, the feature or behaviour, its physical or physiological effect, and the consequence for survival or reproduction within that niche.
Ecological niche
[ 3 ]
Explain the niche concept.
Oxygen tolerance
[ 1 ]
Seaweeds are obligate aerobes. Describe an environmental condition required for seaweed survival.
Photosynthesis as nutrition mode
[ 3 ]
There is evidence that prokaryotes were responsible for changes in the atmospheric gases 3.5 billion years ago. Outline the role of bacteria in producing an oxygen-rich atmosphere.
Holozoic nutrition
[ 1 ]
Outline the method of nutrition carried out by P. caudatum.
Mixotrophic nutrition
[ 1 ]
Outline the reason that some species of protists are classified as mixotrophs.
Saprotrophic nutrition
[ 1 ]
Which organism can best be described as a saprotroph?
Diversity in archaea
[ 3 ]
Using the table, distinguish between chemoautotrophs, photoheterotrophs and chemoheterotrophs.
Energy sources
Carbon sources
chemoautotrophs
____________
____________
____
____
photoheterotrophs
____
____
____
____
chemoheterotrophs
____
____
____
Herbivore and plant adaptations
[ 4 ]
Outline adaptations of animals to herbivory and ways in which plants are adapted to resist herbivores.
Predator and prey adaptations
[ 2 ]
The graph shows that distasteful butterflies tend to have a lower ability to escape from predators than palatable butterflies. Suggest reasons for this trend.
Fundamental vs. realized niche
[ 3 ]
Suggest how this experiment shows that pigeon droppings represent a realized ecological niche for C. neoformans and a fundamental (but not a realized) niche for C. gattii.
Competitive exclusion
[ 1 ]
Paramecium aurelia and Paramecium caudatum are two species of paramecium that grow well individually. Scientists grew these two species of paramecium together, and the result is shown in the graph.