CAIE IGCSE Mathematics Core C9.5.1 Draw & interpret scatter diagrams.
Practise plotting paired data on scatter diagrams and interpreting individual points or overall relationships from real contexts.
- Syllabus
- 2028–2030
- Objective
- C9.5.1
- Level
- Core
Practise plotting paired data on scatter diagrams and interpreting individual points or overall relationships from real contexts.
Ten students eat cereal with milk for breakfast.
The amounts are shown in the table.

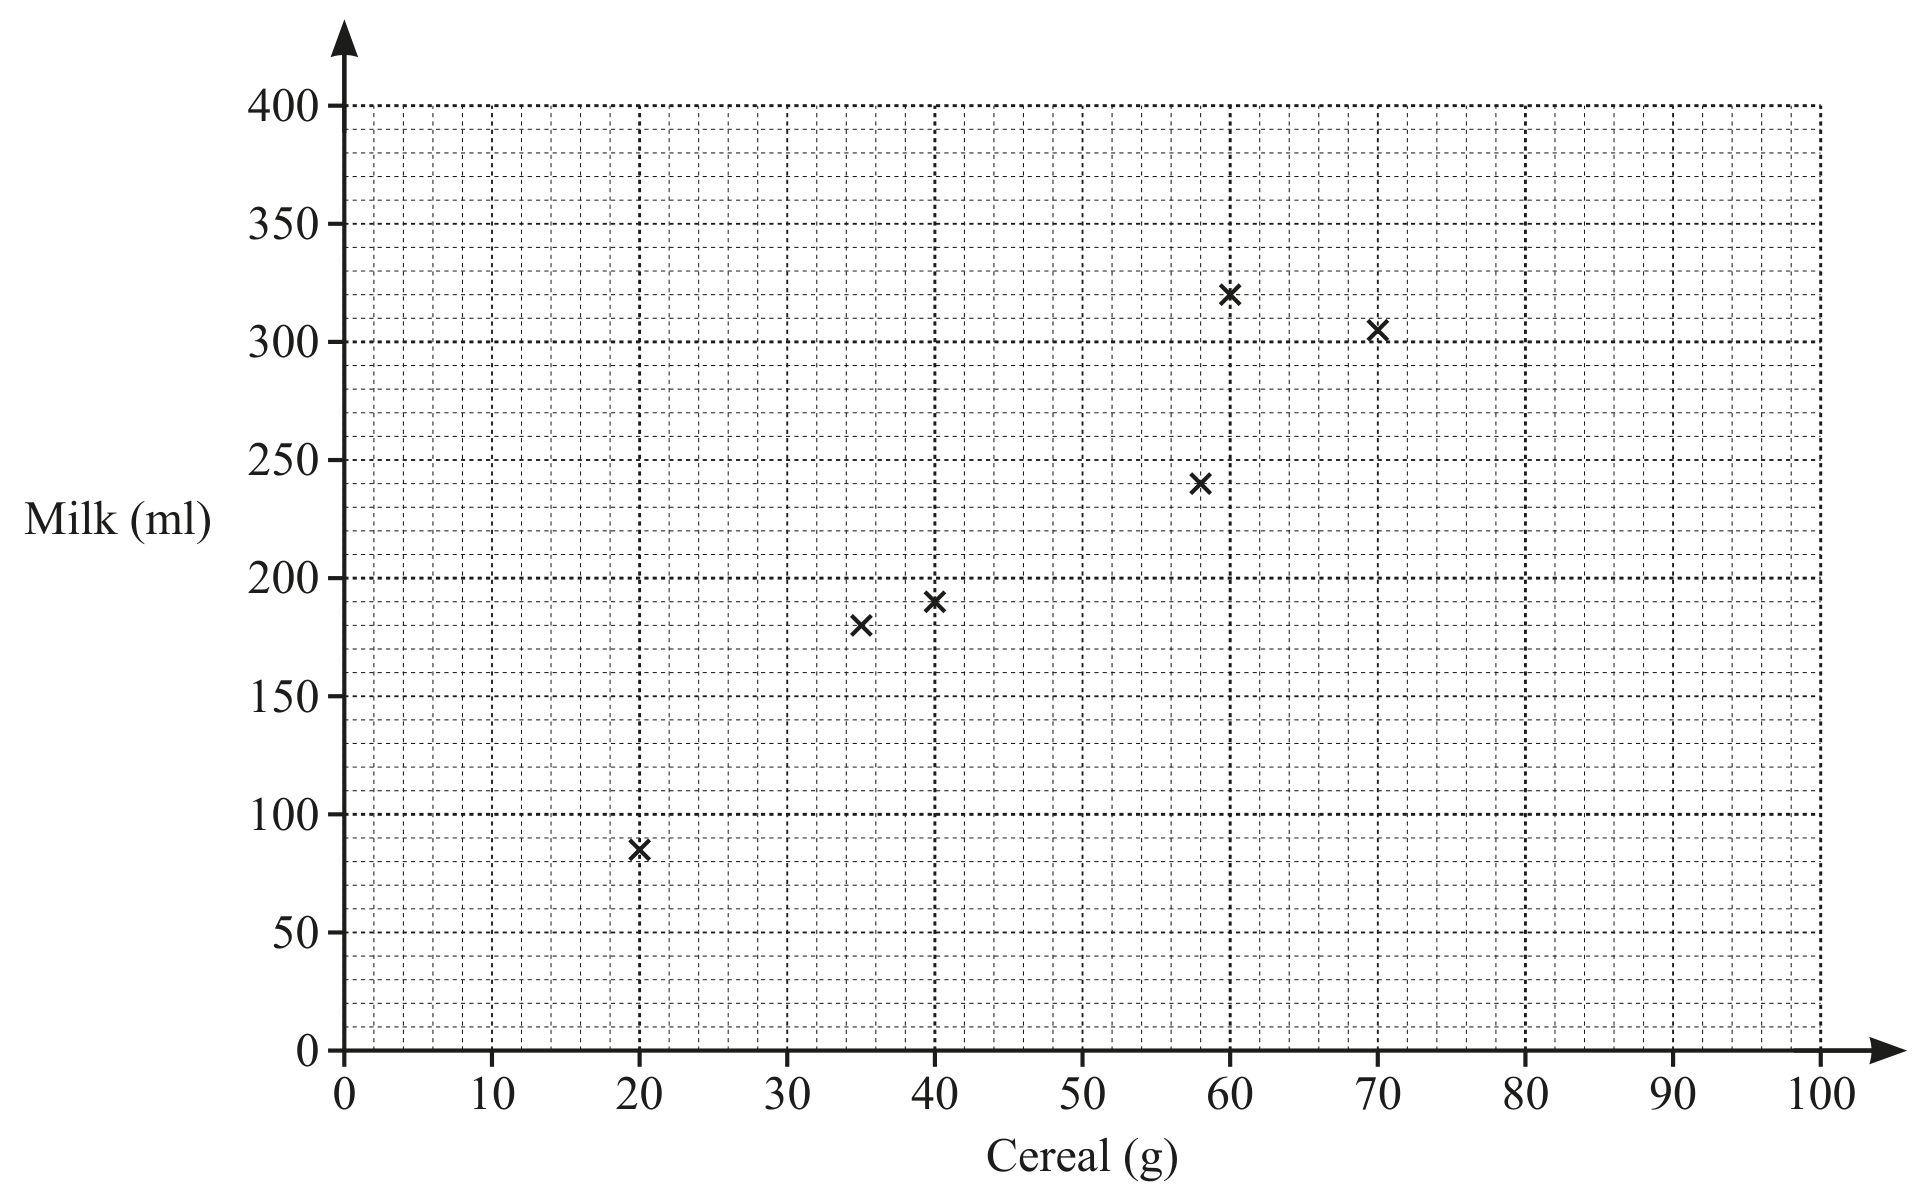
Complete the scatter diagram.
The first six points have been plotted for you.