CAIE IGCSE Mathematics Core Straight-Line Best Fit
Practise selecting or drawing a ruled line that represents a scatter trend and using the line with the diagram scale to estimate an unknown value.
- Syllabus
- 2028–2030
- Objective
- C9.5.3
- Level
- Core
Practise selecting or drawing a ruled line that represents a scatter trend and using the line with the diagram scale to estimate an unknown value.
Ten students eat cereal with milk for breakfast.
The amounts are shown in the table.

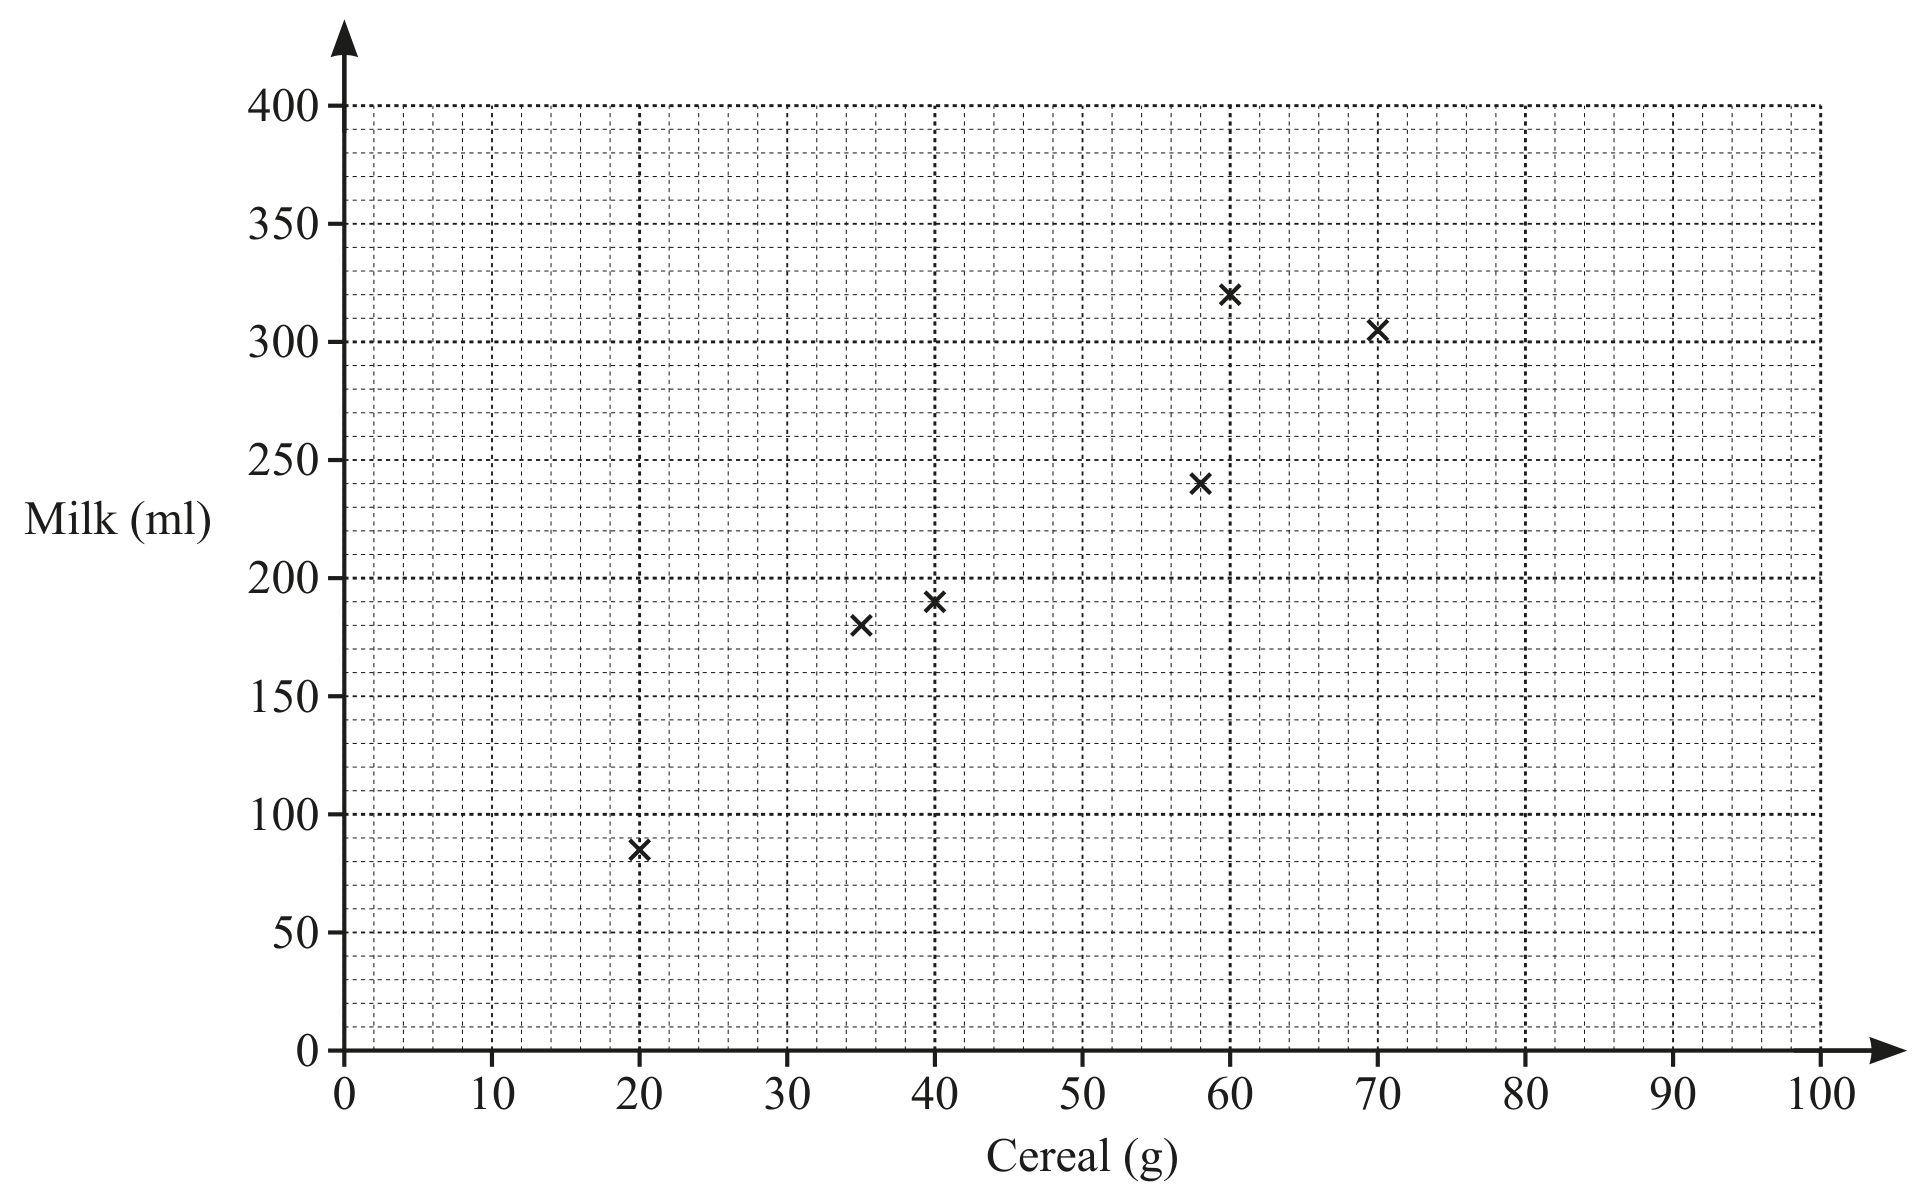
On the grid, draw a line of best fit.
Another student has 280 ml of milk with her cereal.
Use your line of best fit to estimate an amount of cereal this student has.
___ g