(a)
(i)
With reference to Figure 5 and Figure 6, discuss the effect Iraq's pattern of population growth may have on water resources.
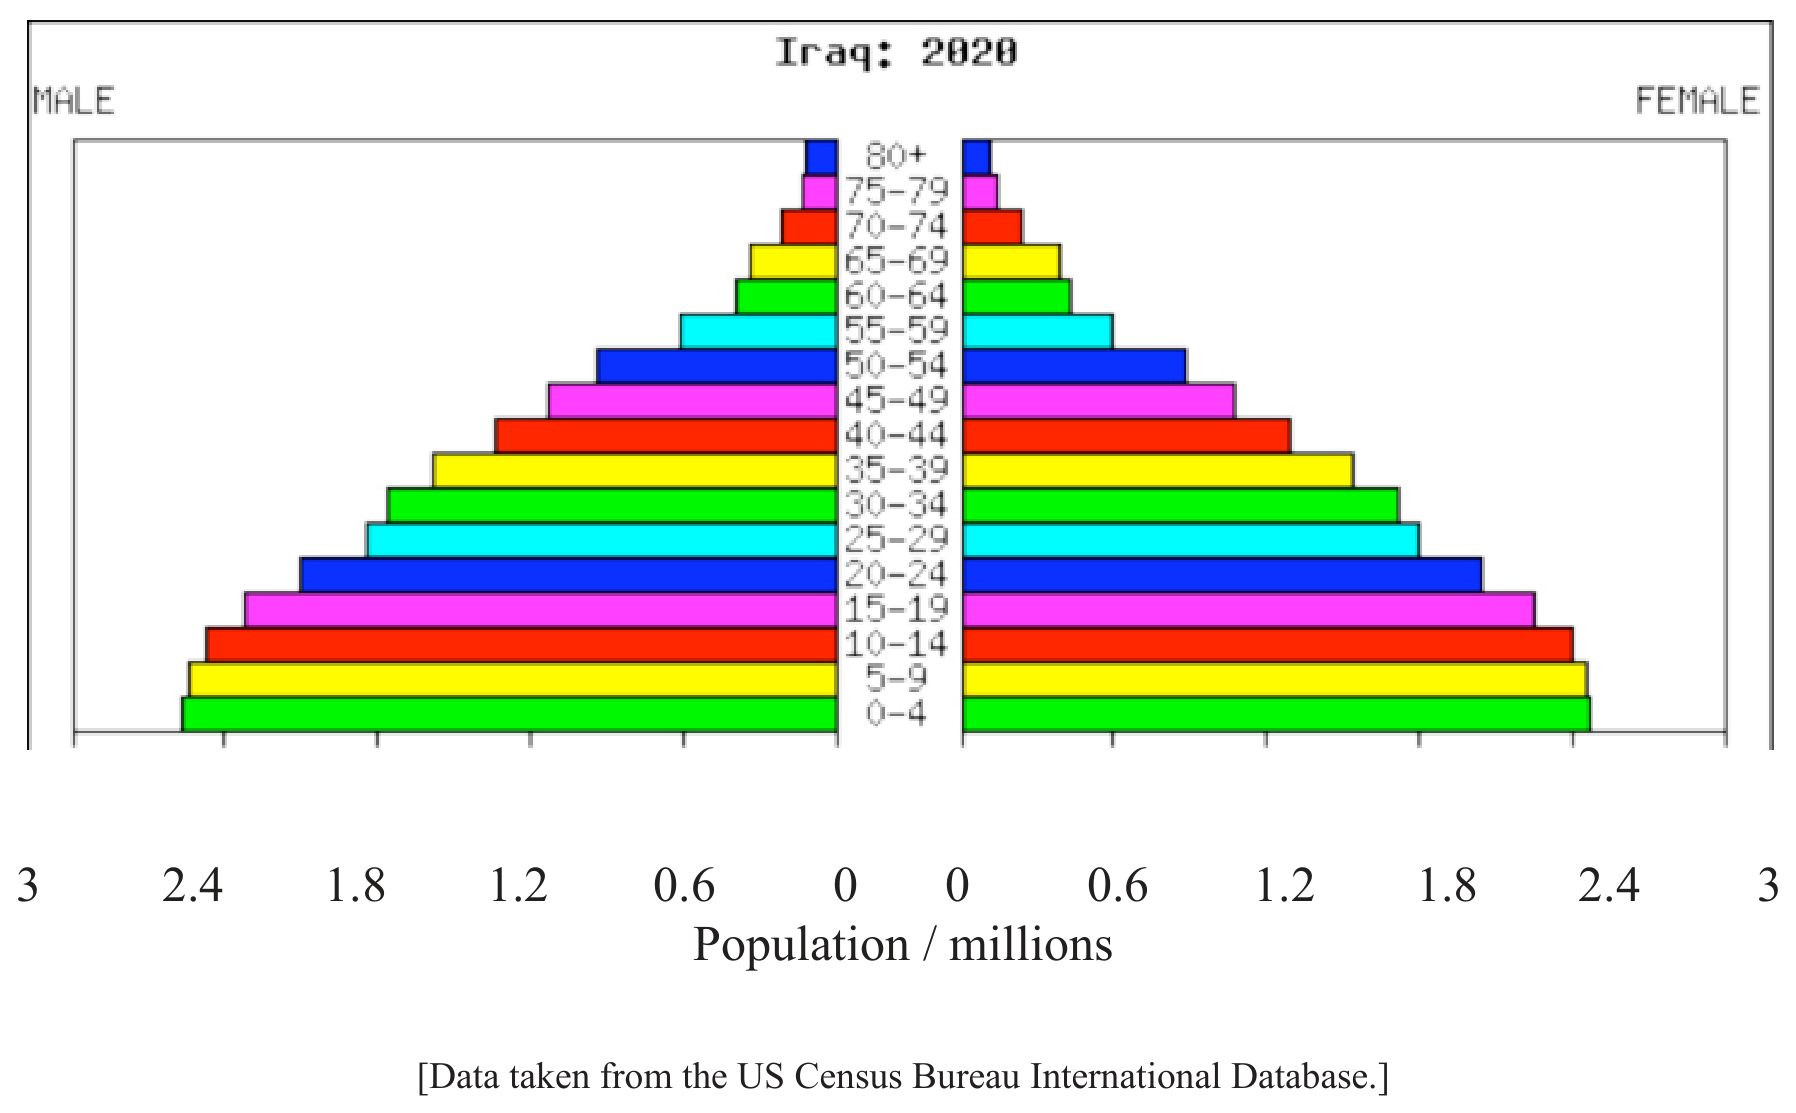
Figure 5: 2009 age/sex pyramid for Iraq
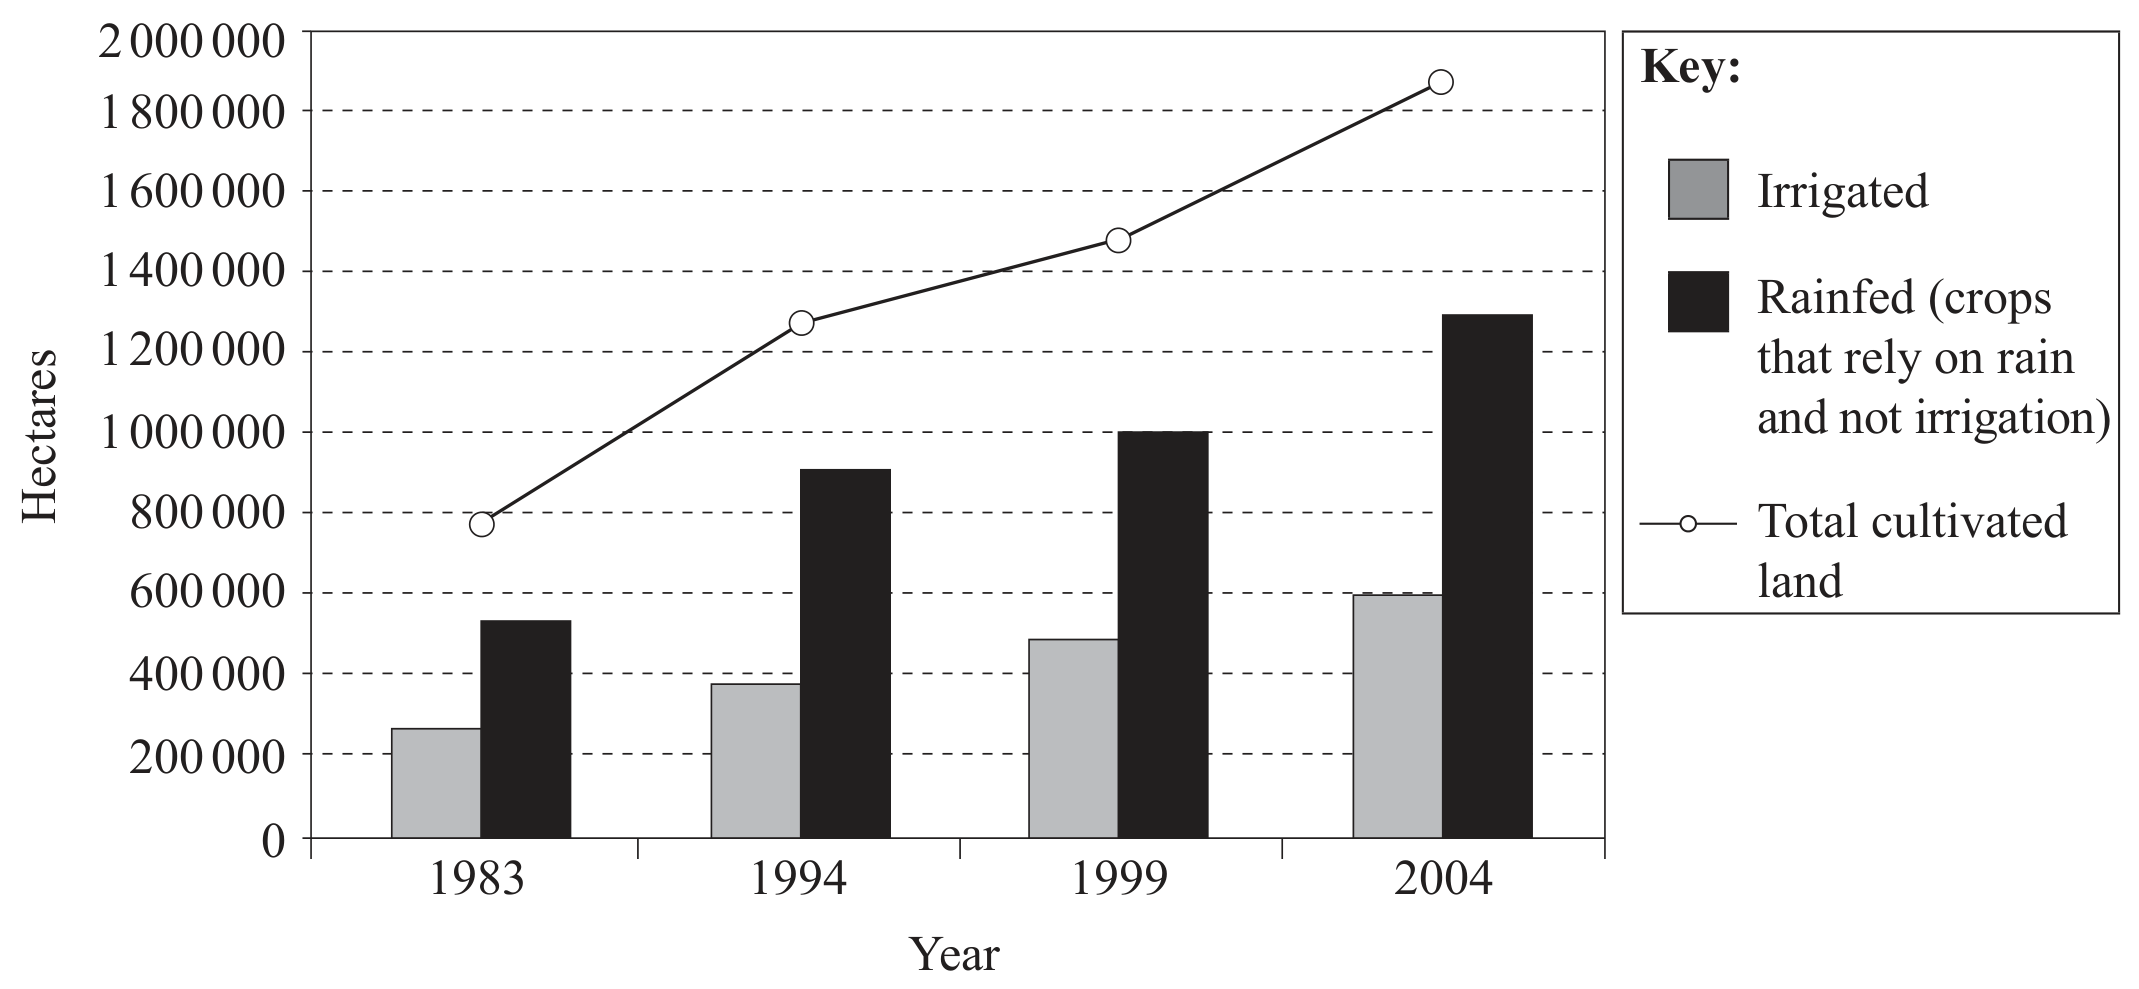
Figure 6: Irrigated, rainfed and total cultivated land in Iraq
The Iraq/Iran marshlands once covered about 15000 km^2.
The marshes receive only about 100 mm of rainfall each year while more than 2500 mm evaporates, leaving salty water.
Spring snowmelt formerly flowed down from Iran and Turkey, bringing sediment and washing away salty water.
The wetlands developed many endemic species and filtered pollutants; local food systems used fishing and water buffalo, and reeds were used for construction.
[ 3 ]