[Maximum number: 2]
The figure refers to a typical Western European diet. This example shows recommended consumption of food types (on the basis of health) and the environmental impact of their production.
Figure 1(b): Environmental impact pyramid
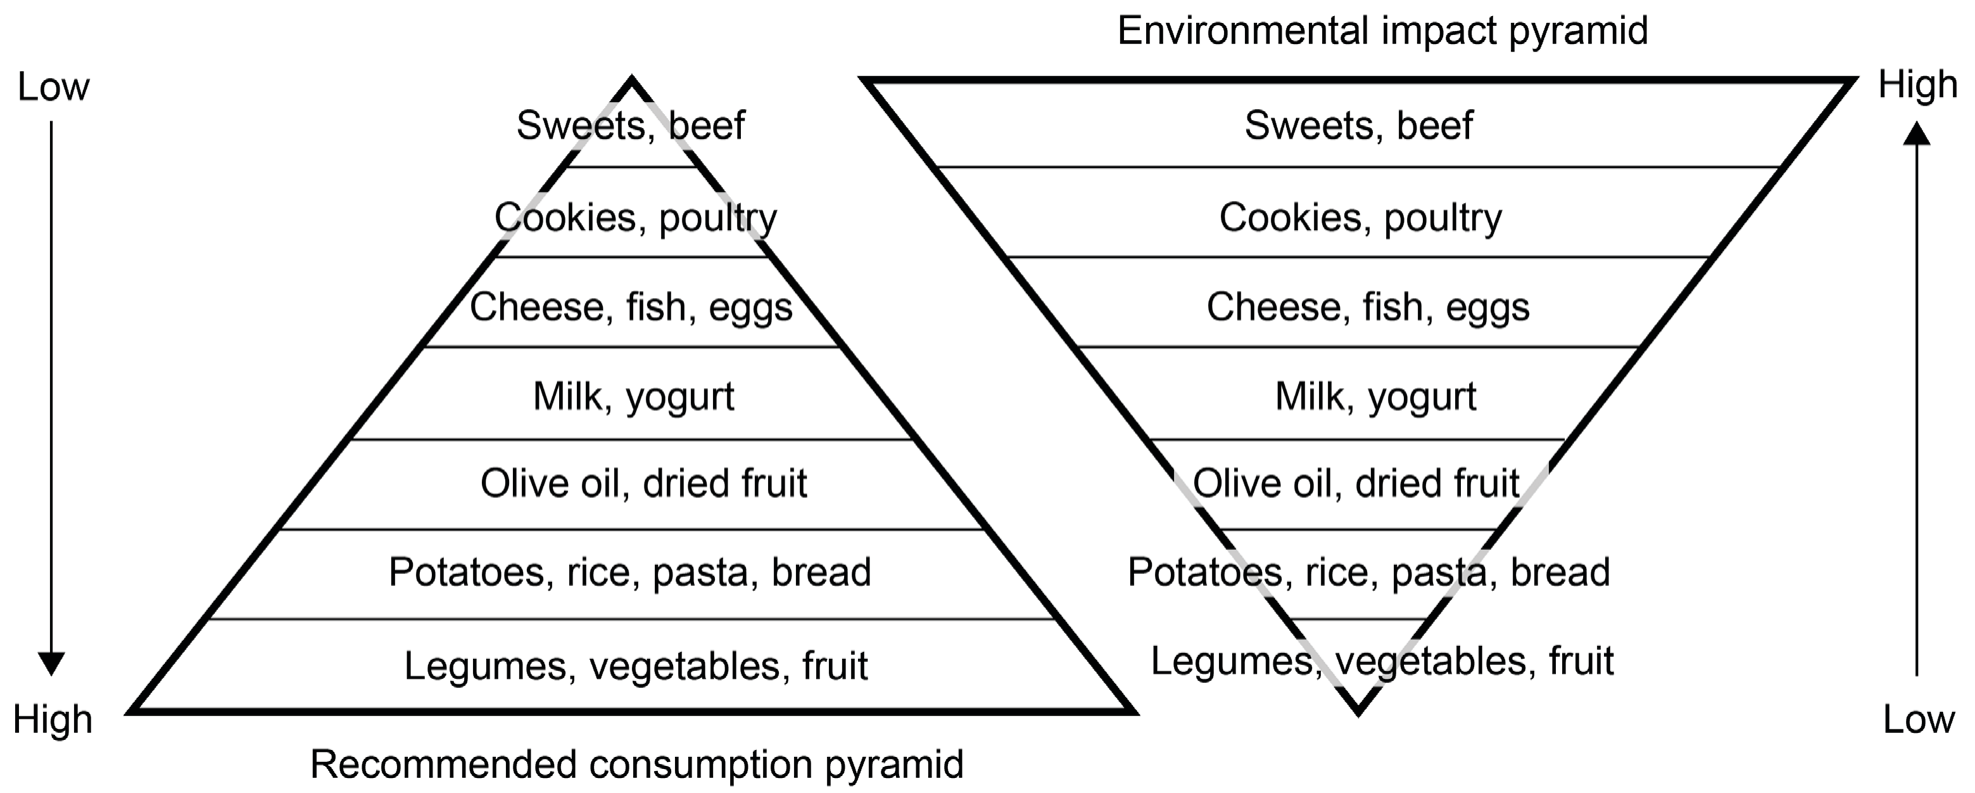
Figure 1(a): Recommended consumption pyramid and Figure 1(b): Environmental impact pyramid
(a)
Describe how foods high on the environmental impact pyramid, shown in Figure 1(b), are likely to affect the ecological footprint of global food production.
[ 2 ]