With reference to Figure 1 (c) and Figure 8, identify which of the three channels of the Danube River delta has been most extensively straightened by dredging and state why this has been done.
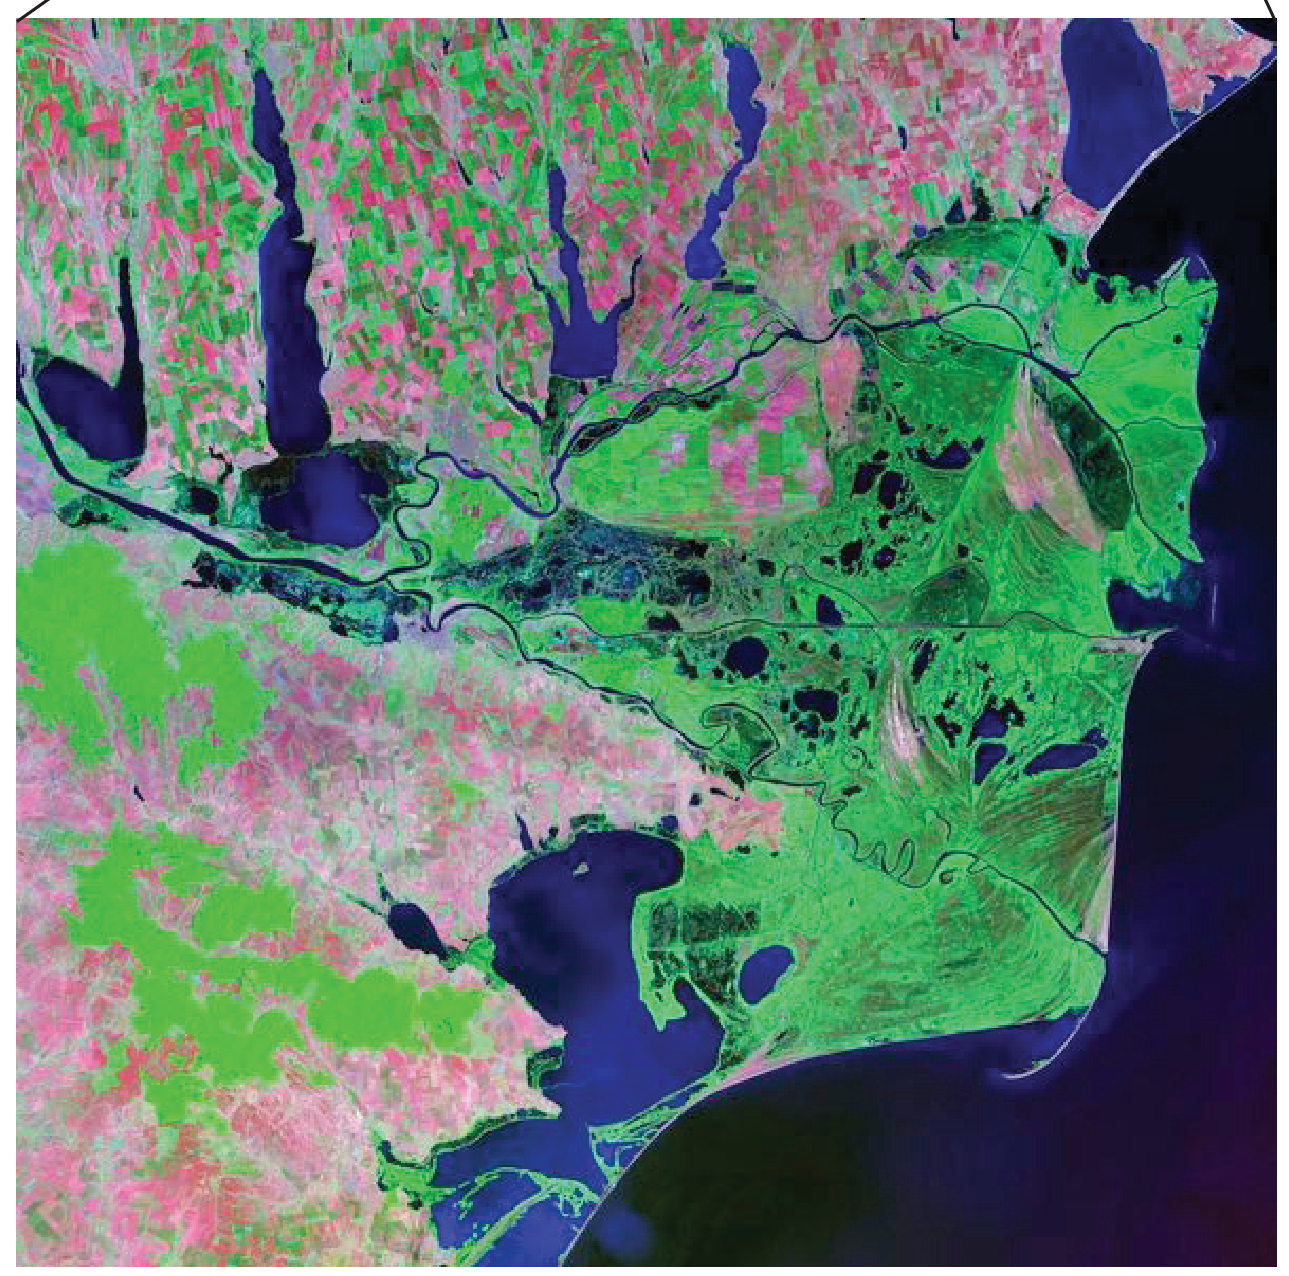
Figure 1(c): Map of the Danube River delta and Kiliya, Sulina and St George channels
Figure 8: dredging is carried out so sediment carried by the river does not interfere with navigation.
Dredging involves scooping out sediment using heavy machinery and has also been used to straighten channels.
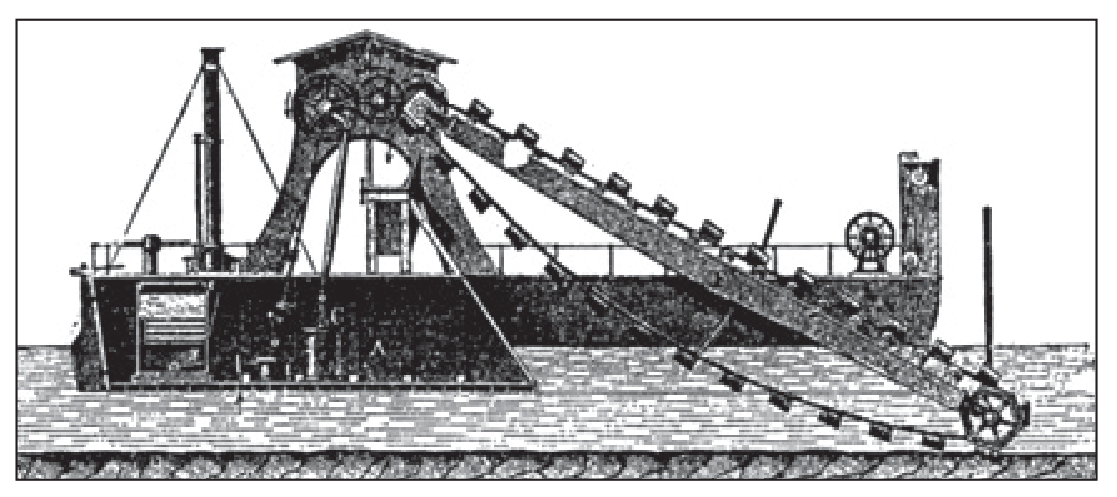
Figure 8(a): Bucket dredging
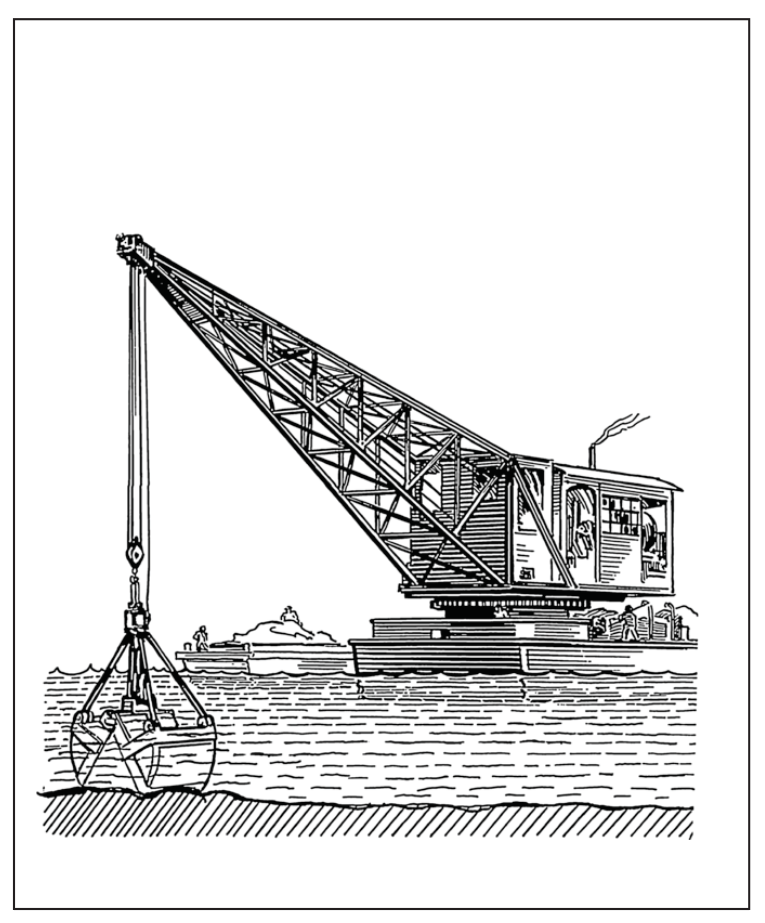
Figure 8(b): Grab dredging
With reference to Figure 7, calculate the percentage decrease in average sediment flow between 1971-1980 and 1981-1990.
| Years | Average sediment flow / tons yr^{-1} |
|---|---|
| 1921-1960 | 67.5 |
| 1971-1980 | 41.3 |
| 1981-1990 | 29.2 |
Figure 7: Changes to sediment flow into the delta
Suggest what effect this change in the sediment flow would have on the maintenance of the Danube River delta.
| Years | Average sediment flow / tons yr^{-1} |
|---|---|
| 1921-1960 | 67.5 |
| 1971-1980 | 41.3 |
| 1981-1990 | 29.2 |
Figure 7: Changes to sediment flow into the delta
The Danube River delta is where the Danube flows into the Black Sea and includes UNESCO Biosphere Reserves and a World Natural Heritage site.
A delta is formed by continuous deposition of sediment carried by the river; sediment adds height and helps it extend into the sea.
The delta is a wetland ecosystem rich in plants, birds and fish, including over 1000 plant species, 300 bird species and endangered sturgeon.
Moldova takes nearly 20% of its water supply requirements from a branch of the Danube.