ConceptConceptDocsDocuments

IB ESS HL Topic 8 Populations and Urban Systems Question Bank

Practise IB ESS HL Topic 8 by calculating demographic rates, analysing population and urban data, and evaluating pollution, migration and planning decisions for sustainable…

Syllabus
First assessment 2026
Course
ESS HL
Level
HL

Topic 8: Human populations and urban systems question 1

[Maximum number: 9]
Figure Crude birth rate, crude death rate, total population (1960-2024) and predicted total population (2025-2100) for South Korea

Figure Crude birth rate, crude death rate, total population (1960-2024) and predicted total population (2025-2100) for South Korea

Question (a)

(a)
YearCrude birth rate
1980
2024

Using Figure, state the crude birth rate (CBR) of South Korea in 1980 and 2024.

[ 2 ]

Question (b)

(b)

Using Figure, calculate the natural increase rate (NIR) in 1980.

[ 1 ]

Question (c)

(c)

Explain which stage of the demographic transition model South Korea was in during 1980.

[ 2 ]

Question (d)

(d)

Outline two national development policies that might have contributed to the changes in the crude birth rates in South Korea between 1960 and 2024.

[ 2 ]

Question (e)

(e)
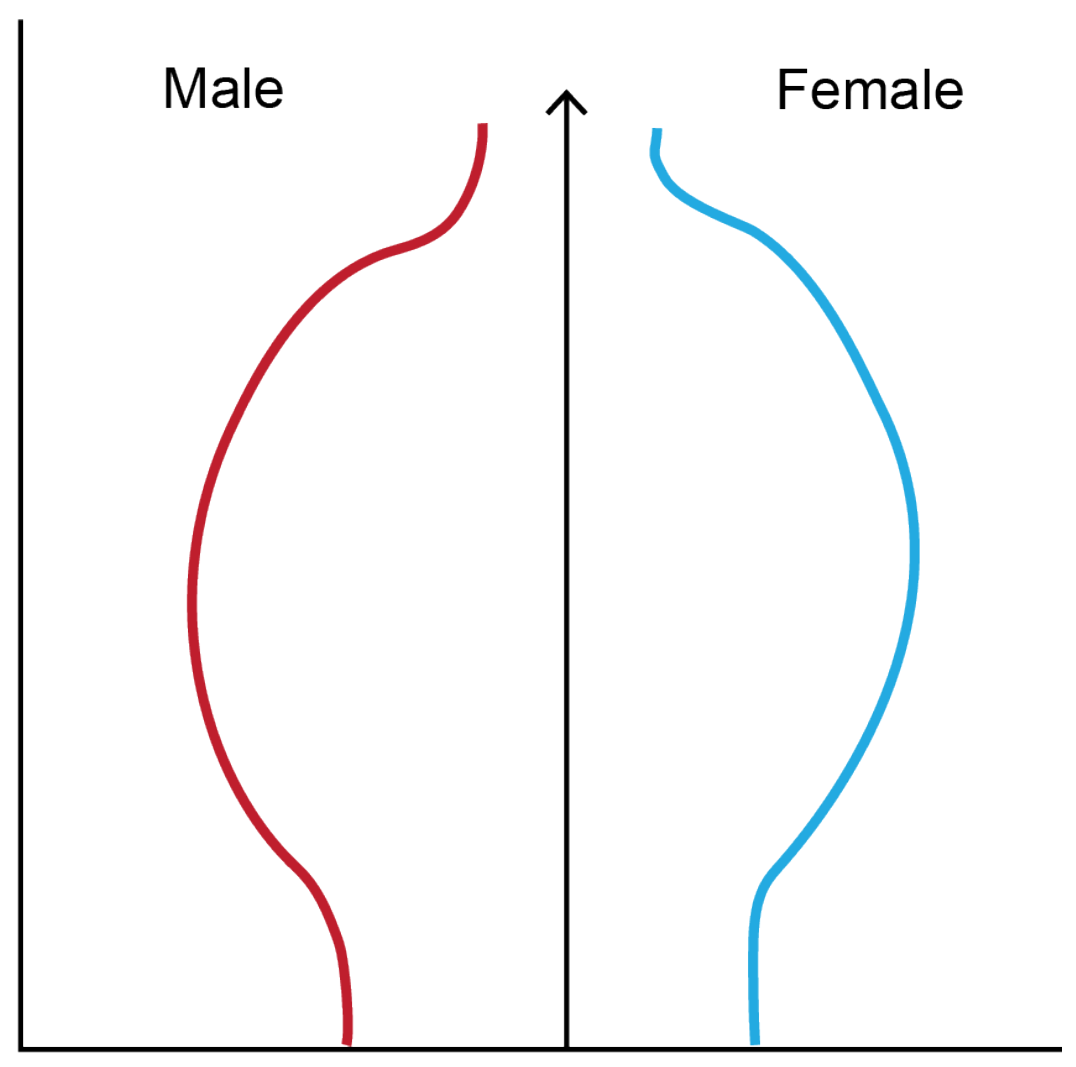
Figure for Question (e) — IB ESS HL

Sketch the shape of the age-gender pyramid for 2024 that would lead to the predicted total population changes from 2024 to 2100, as shown in Figure.

[ 2 ]

Topic 8: Human populations and urban systems question 2

[Maximum number: 1]
Examples of ecosystems in London

Figure:Examples of ecosystems in London

Climate graph for London

Figure:Climate graph for London

Green spaces in London

Figure:Green spaces in London

Figure:Fact file on London as a green city

London green space
- 47% of London is classified as green space.
- London has over 8 million trees and 13,000 species.
- Green spaces can provide ecosystem services such as habitat, air cleaning, cooling and flood mitigation.

With reference to Figure: Examples of ecosystems in London and Figure: Climate graph for London, identify an ecosystem found in London.

Topic 8: Human populations and urban systems question 3

[Maximum number: 10]
Atmospheric pollutants associated with photochemical smog

Figure:Atmospheric pollutants associated with photochemical smog

Question (a)

(a)

Identify one primary pollutant from the pollutants shown in the photochemical-smog pollutant chart shown above.

[ 1 ]

Question (b)

(b)

Outline why the pollutant named in Question 3 (a)(i) is referred to as a primary pollutant.

[ 1 ]

Question (c)

(c)

Outline one reason why there is an increase in nitrogen oxides and hydrocarbons early in the day.

[ 1 ]

Question (d)

(d)

Explain the changes in ozone concentration over the period shown in the photochemical-smog pollutant chart shown above.

[ 3 ]

Question (e)

(e)

State one environmental impact of the accumulation of ozone shown in the photochemical-smog pollutant chart shown above.

[ 1 ]

Question (f)

(f)

Outline two local conditions that may increase the severity of photochemical smog.

[ 2 ]

Question (g)

(g)

Outline the role of catalytic converters in reducing photochemical smog.

[ 1 ]

Topic 8: Human populations and urban systems question 4

[Maximum number: 2]
Population5157100
Live births58887
Deaths38574
Total fertility rate1.66 children per woman

Table:Population statistics for New Zealand, 2022

Question (a)

(a)

With reference to Table: Population statistics for New Zealand, 2022, calculate the crude death rate (CDR) per 1000 people for the year 2022.

[ 1 ]

Question (b)

(b)

Outline how the total fertility rate of New Zealand shown in Table: Population statistics for New Zealand, 2022 will influence its future population.

[ 1 ]
All question bank results loaded