CAIE IGCSE Mathematics Extended Drawing Linear Graphs

Practise rearranging a linear equation when needed, identifying reliable points and drawing the required ruled straight line on a coordinate grid.

Syllabus
2028–2030
Objective
E3.2.1
Level
Extended

Exam points

  • plot two accurate points from each linear equation and join them with a ruled line
  • for x + y = 7, use intercepts (0, 7) and (7, 0) or rearrange to y = 7 − x

E3.2.1 Draw straight-line graphs for linear equations question 1

[Maximum number: 3]
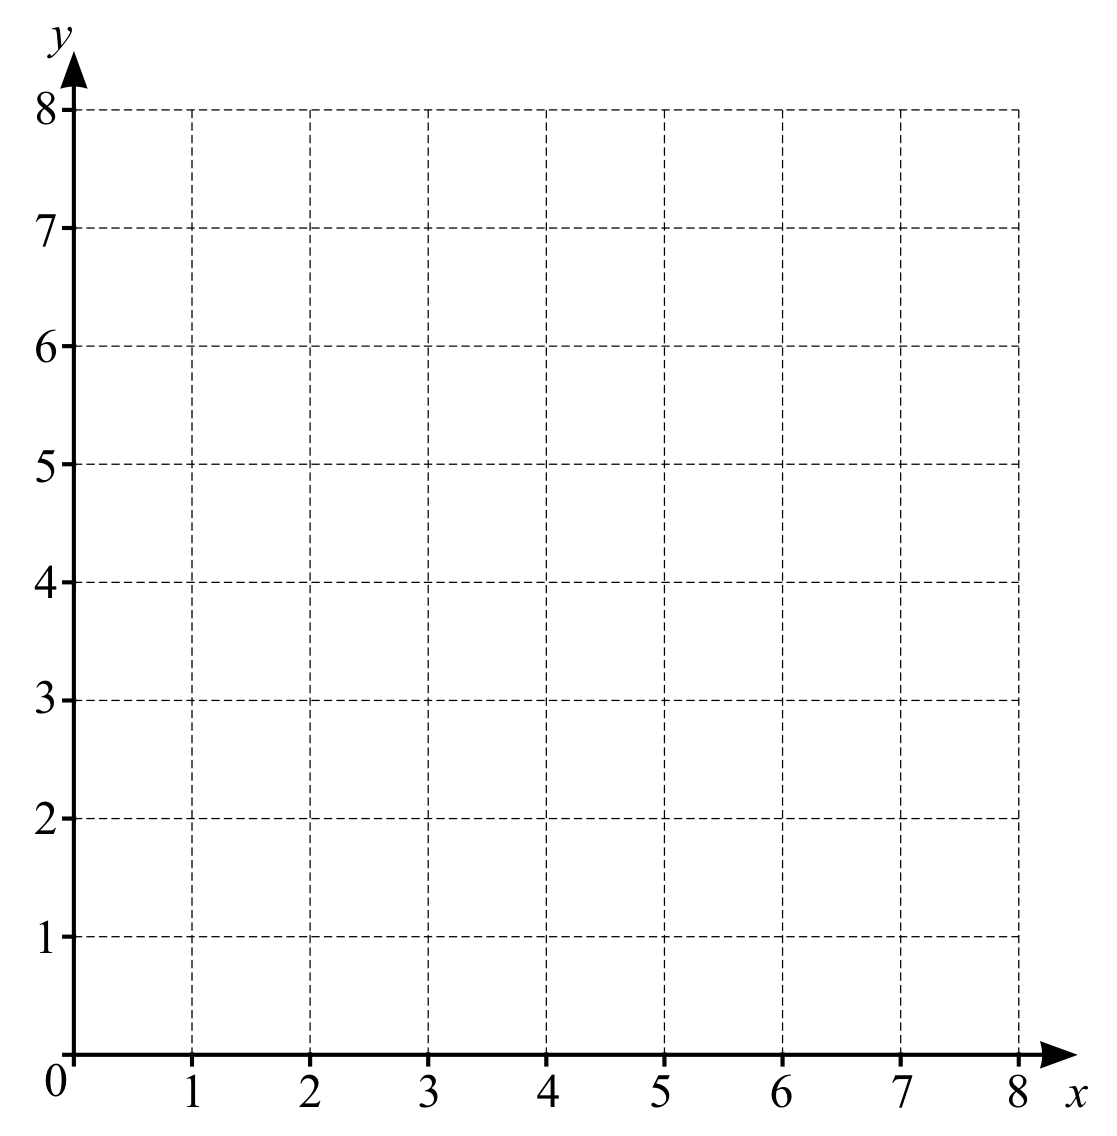
Figure for Question E3.2.1 Draw straight-line graphs for linear equations question 1 — CAIE IGCSE Mathematics Extended

On the grid, draw the lines y=x and x+y=7.

All question bank results loaded