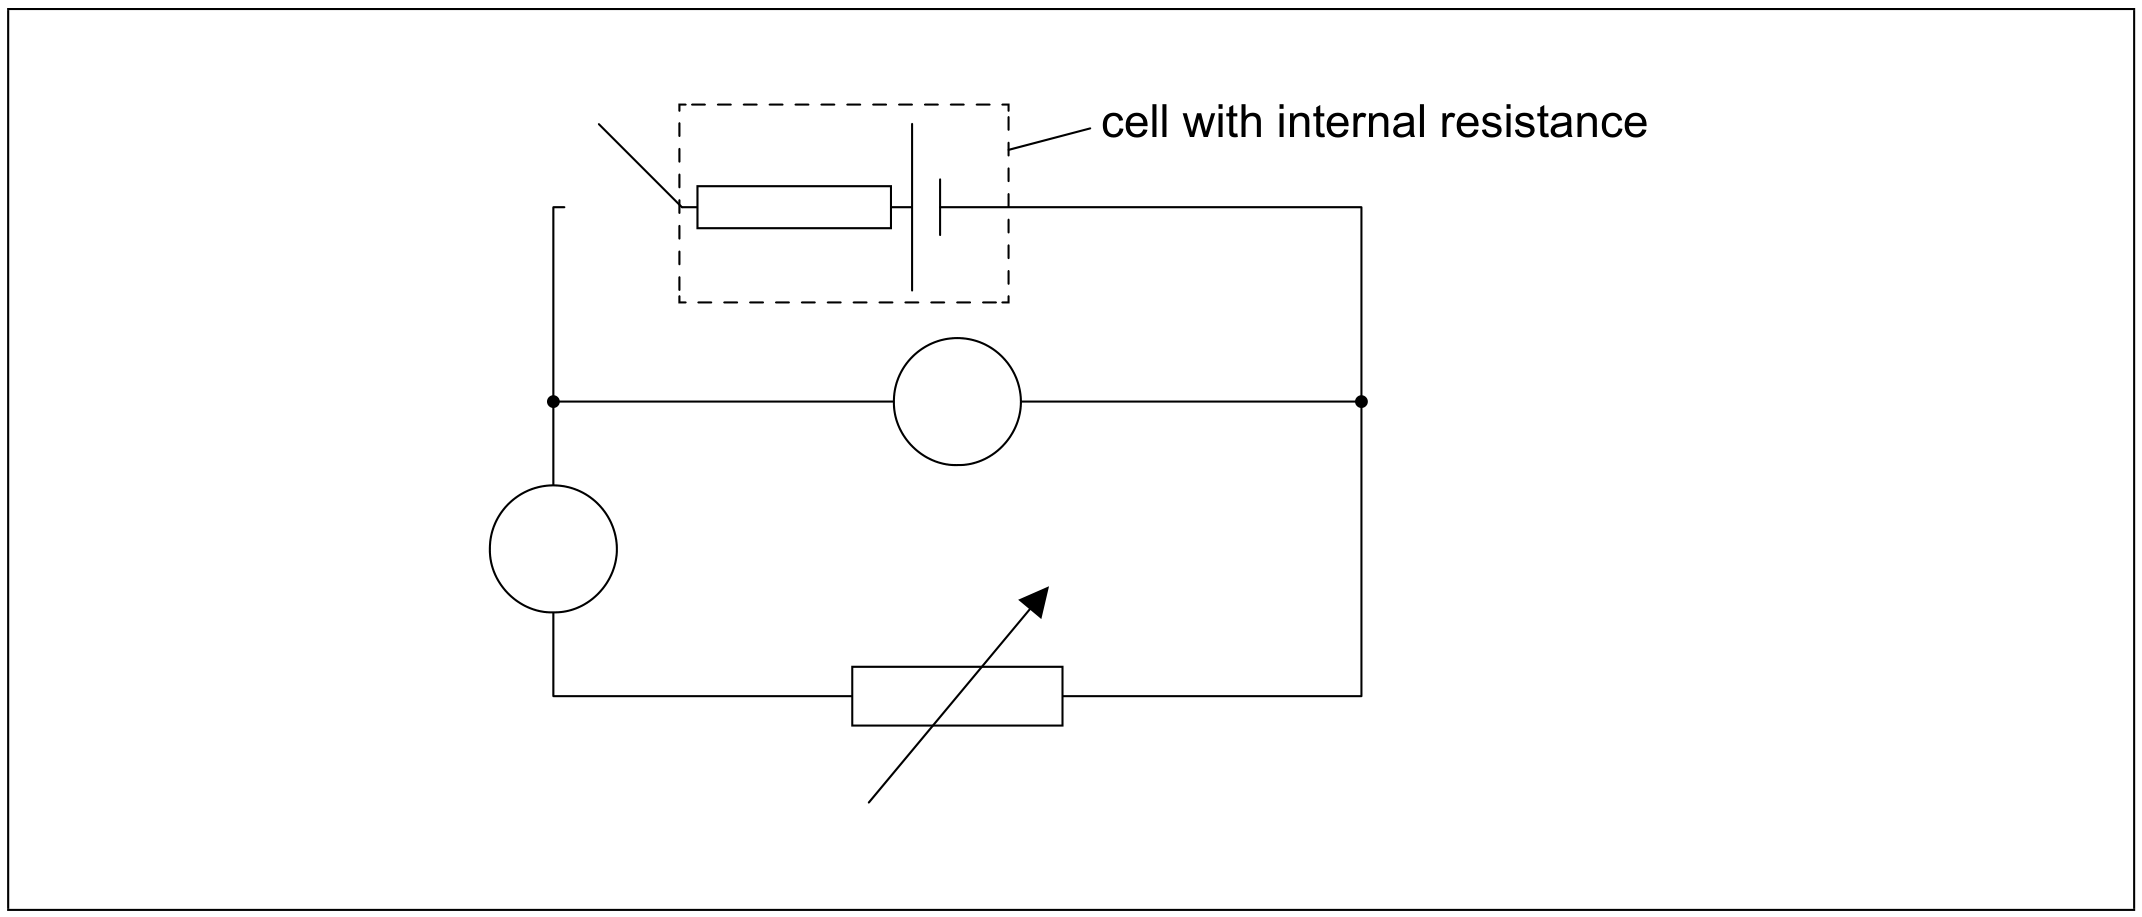
EduNinja

IB Physics HLS2.3 Concluding and evaluatingQuestion Bank

S2.3 Concluding and evaluating

Question 1

[Maximum number: 2]

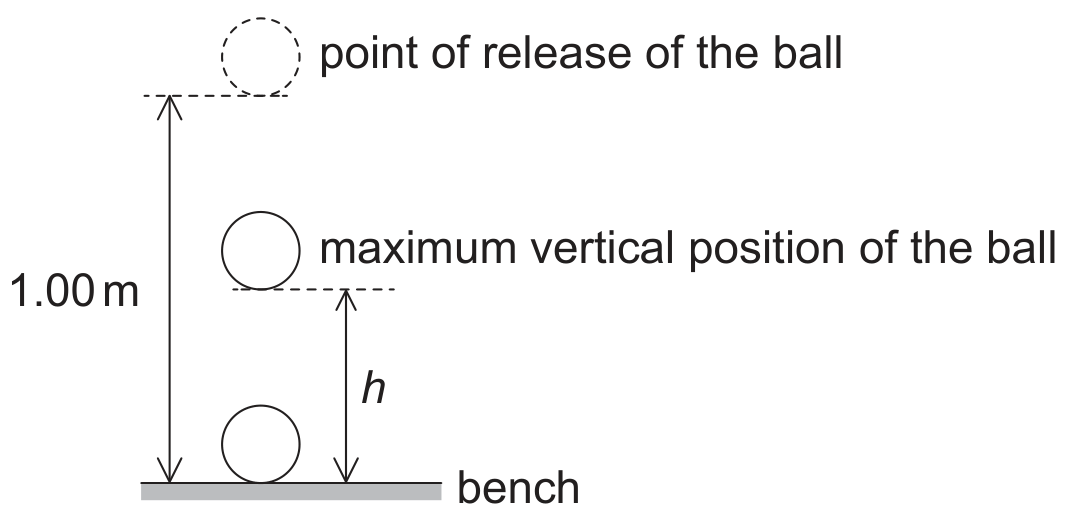
A student investigates the oscillation of a horizontal rod hanging at the end of a vertical string. The diagram shows the view from above.

Question image

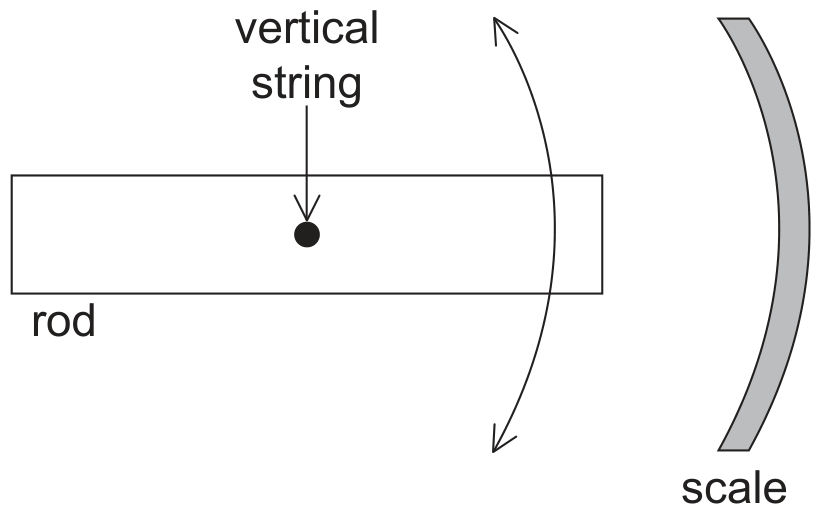
The student starts the rod oscillating and measures the largest displacement for each cycle of the oscillation on the scale and the time at which it occurs. The student begins to take measurements a few seconds after releasing the rod.

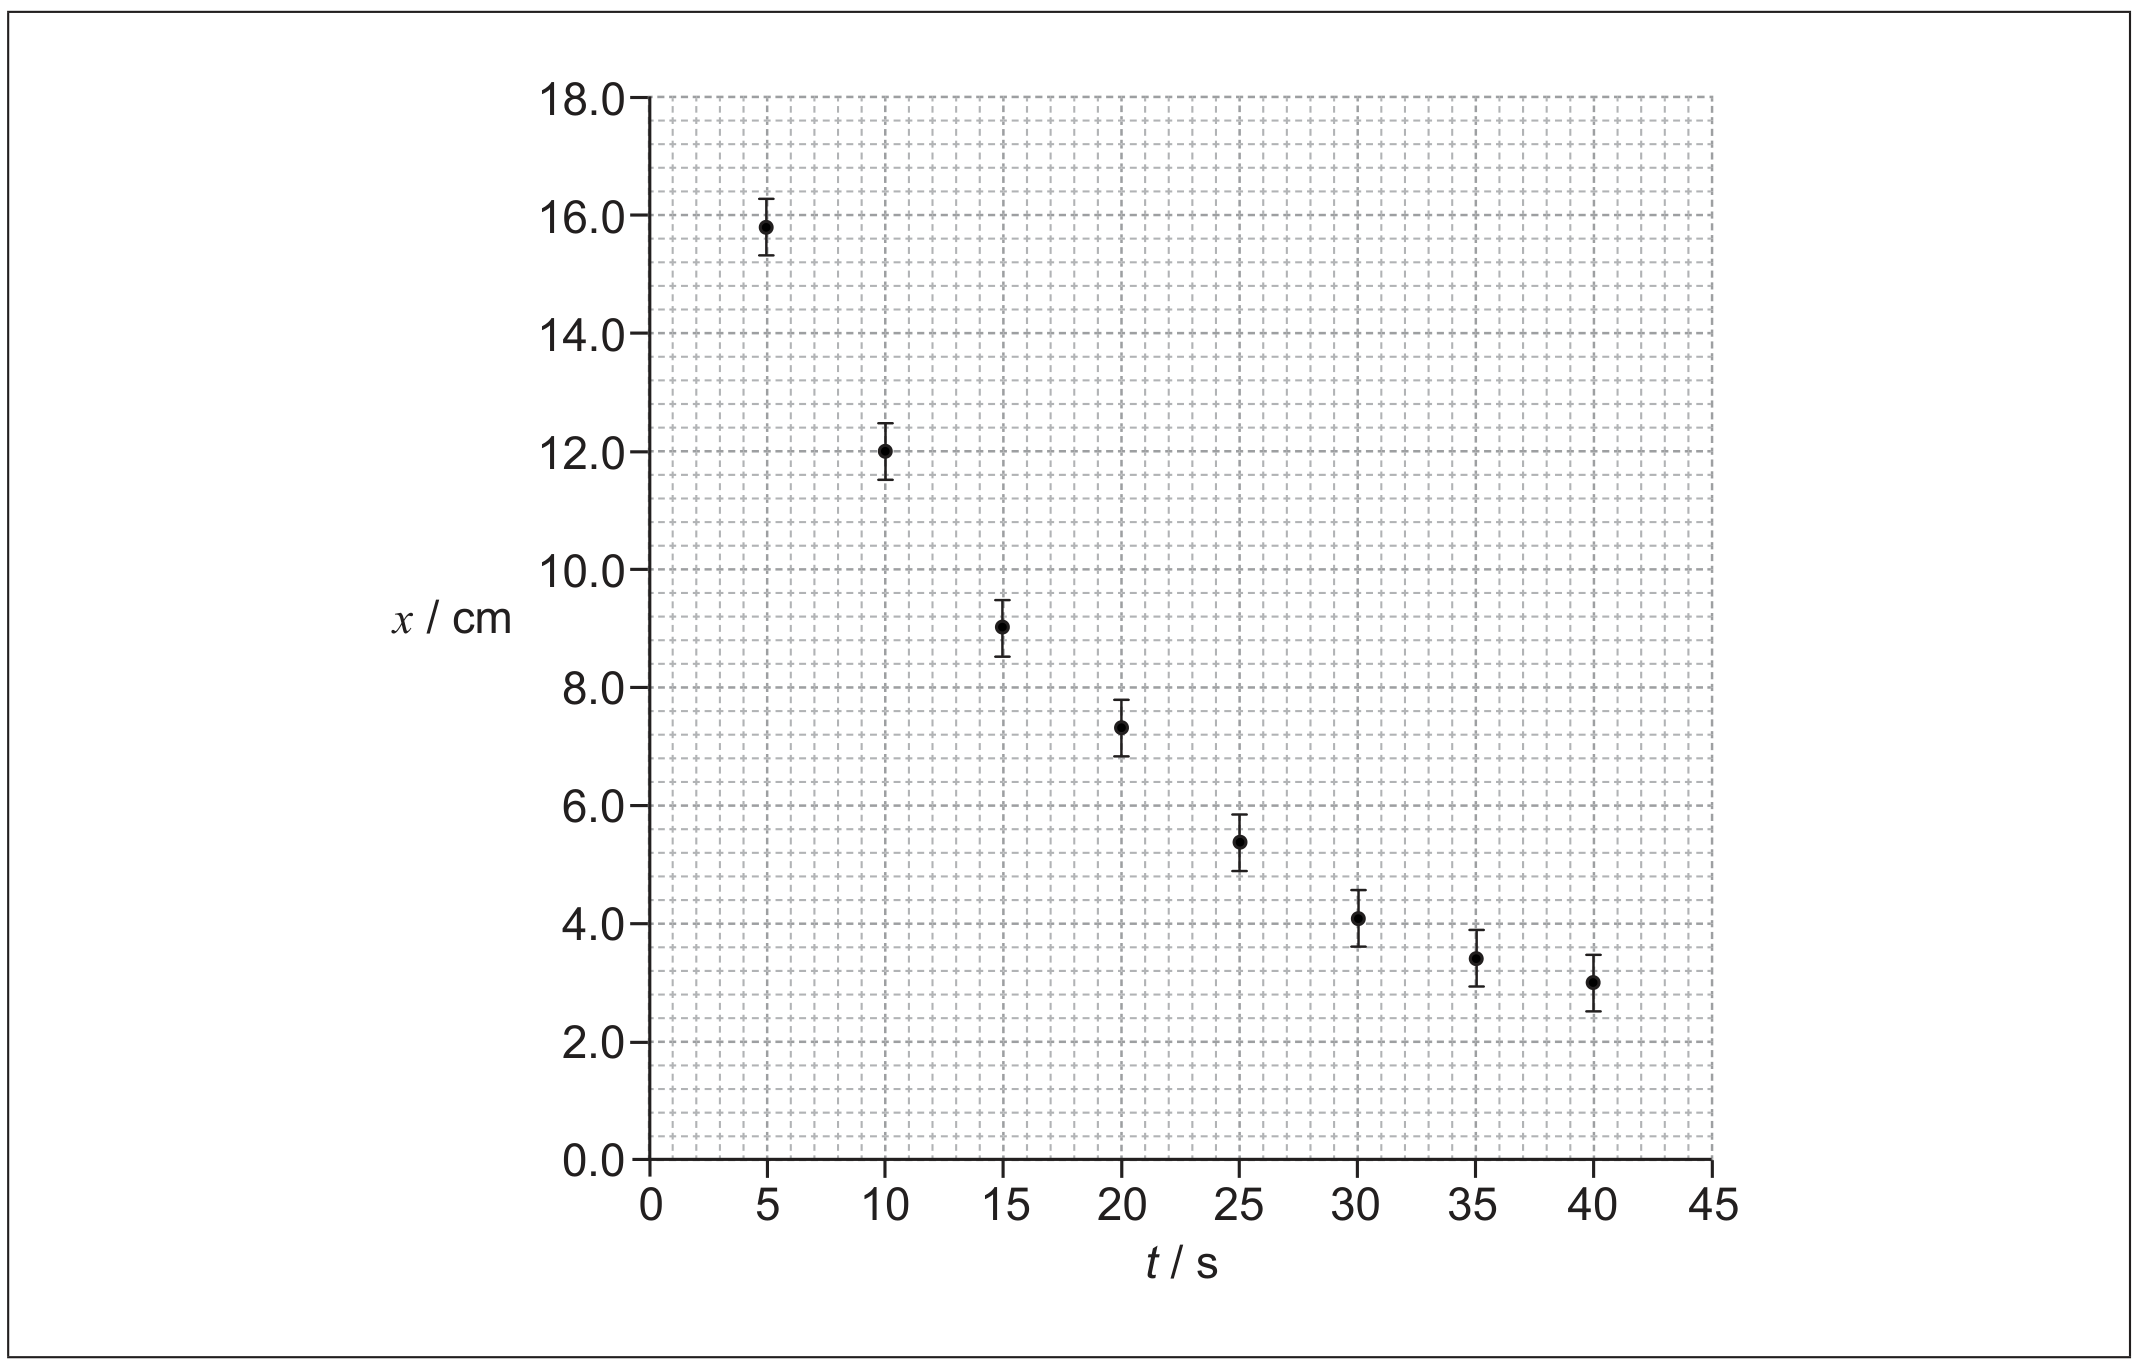
The graph shows the variation of displacement x with time t since the release of the rod. The uncertainty for t is negligible.

Question image

Question 1(c)

(a)

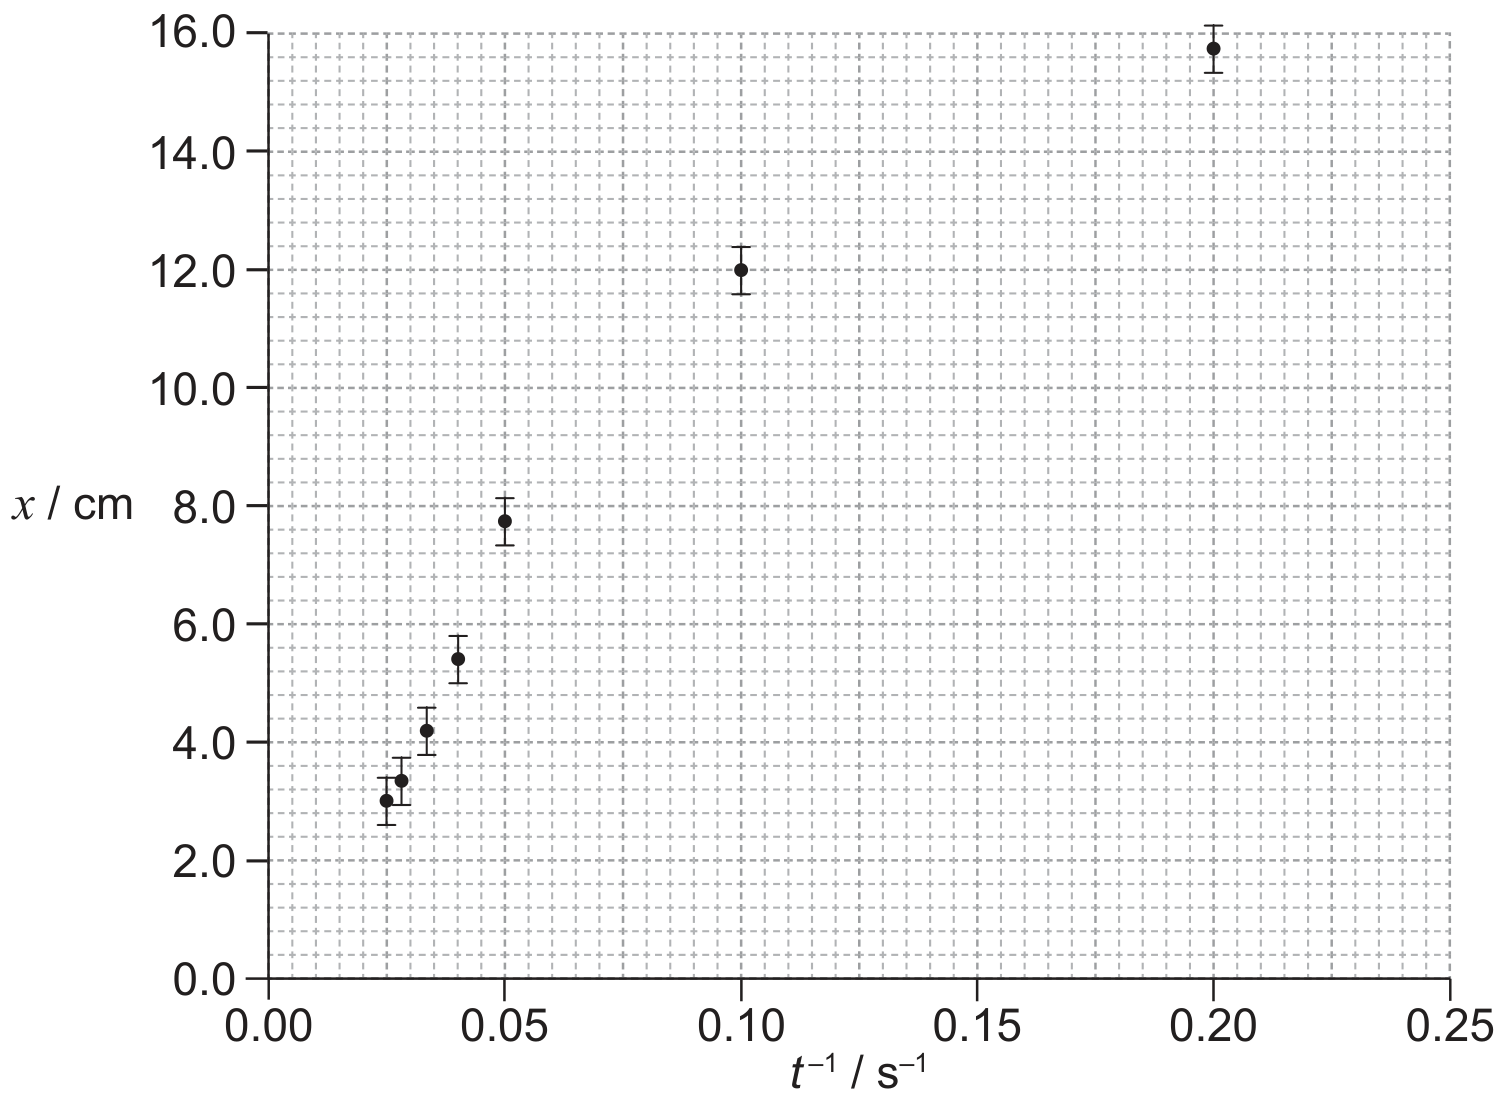
The student hypothesizes that the relationship between x and t is x=atx=\frac{a}{t} where a is a constant.

To test the hypothesis x is plotted against 1t\frac{1}{t} as shown in the graph.

Question image
[ 2 ]

Question 1(c)(ii)

(i)

Suggest the range of values of t for which the hypothesis may be assumed to be correct.

[ 2 ]

Question 1

[Maximum number: 1]

A group of students is trying to determine the density and the viscosity of a liquid.

To determine the density, they use a balance to read the mass m of a sphere in air and immersed in the liquid.

They use a sphere of volume V=1.827×10⁷ m3V=1.827 \times 10^{-7} \mathrm{~m}^{3}.
The readings are mair =1.427 gm_{\text {air }}=1.427 \mathrm{~g} in air and mlmmersed =1.208 gm_{\text {lmmersed }}=1.208 \mathrm{~g} in the liquid.
The readings are different due to buoyancy. The buoyancy force FbF_{\mathrm{b}} is given by

Fb=ρVgF_{\mathrm{b}}=\rho V g

where V is the volume of the sphere and ρ\rho is the density of the liquid.

Question 1(g)

(a)

Suggest a conclusion reached by the students.

[ 1 ]

Question 1

[Maximum number: 2]

Data analysis question.

An experiment is undertaken to investigate the relationship between the temperature of a ball and the height of its first bounce.

A ball is placed in a beaker of water until the ball and the water are at the same temperature. The ball is released from a height of 1.00 m above a bench. The maximum vertical height h from the bottom of the ball above the bench is measured for the first bounce. This procedure is repeated twice and an average hmean h_{\text {mean }} is calculated from the three measurements.

Question image

The procedure is repeated for a range of temperatures. The graph shows the variation of hmean h_{\text {mean }} with temperature T.

Question image

Question 1(b)

(a)

A student hypothesizes that hmean h_{\text {mean }} is proportional to T2T^{2}.

[ 2 ]

Question 1(b)(ii)

(i)

Suggest why using two points cannot confirm that hmean h_{\text {mean }} is proportional to T2T^{2}.

[ 2 ]

Question 1

[Maximum number: 1]

A student attaches one end of a copper wire to an oscillator operating at a fixed frequency. The other end of the wire passes over a pulley to weights that hang vertically. The first harmonic standing wave is established by using the slider to change the length of the wire. The procedure is repeated for different weights.

Question image

The mass m of the weights and the wavelength λ\lambda of the wave are related by

m=μf2gλ2m=\frac{\mu f^{2}}{g} \lambda^{2}

where μ\mu is a constant, f is the frequency of the wave and g=9.8 ms2g=9.8 \mathrm{~ms}^{-2}.

Question 1(b)

(a)

The graph shows the data obtained by the student, plotted to show the variation of m with λ2\lambda^{2}.

Question image
[ 1 ]

Question 1(b)(iii)

(i)

Suggest a possible reason for the systematic error.

[ 1 ]

Question 1

[Maximum number: 1]

The density of a metal sphere is determined using a digital caliper and a mass balance.

The digital caliper is used to measure the diameter D of the sphere by placing the sphere in the jaws of the digital caliper. This reading is shown.

The sphere is then removed and another reading is taken immediately afterwards with the jaws closed.

Question image
Question image

Question 1(b)

(a)

State one way in which the procedure for the measurement of D can be improved using the same digital caliper.

[ 1 ]

Question 2

[Maximum number: 2]

The air in a kitchen has pressure 1.0×10⁵ Pa1.0 \times 10^{5} \mathrm{~Pa} and temperature 22C22^{\circ} \mathrm{C}. A refrigerator of internal volume 0.36 m30.36 \mathrm{~m}^{3} is installed in the kitchen.

Question 2(b)

(a)

The refrigerator door is closed. The air in the refrigerator is cooled to 5.0C5.0^{\circ} \mathrm{C} and the number of air molecules in the refrigerator stays the same.

[ 2 ]

Question 2(b)(iii)

(i)

Comment on the magnitude of the force in (b)(ii).

[ 2 ]

Question 2

[Maximum number: 2]

This question is about change of phase.

Question 2(c)

(a)

Explain why, other than measurement or calculation error, the accepted value of L is greater than that given in (b).

[ 2 ]

Question 2

[Maximum number: 2]

An experiment is conducted to measure the specific heat capacity of water. A mass of water is placed in a glass beaker and energy is transferred from an electric heater.

Question image

The data collected are:

Mass of water =(0.250±0.002)kg=(0.250 \pm 0.002) \mathrm{kg}
Change in temperature of the water =(14.0±0.5)C=(14.0 \pm 0.5)^{\circ} \mathrm{C}
Energy transferred from the electric heater =(16000±300)J=(16000 \pm 300) \mathrm{J}

Question 2(b)

(a)

Outline one source of systematic error in the experiment and its effect on the calculated value of the specific heat capacity of water. provided.

[ 2 ]

Question 2

[Maximum number: 1]

A student investigates whether the Stefan-Boltzmann law, L=4πσR2T4L=4 \pi \sigma R^{2} T^{4}, applies to stars.
L= luminosity of the star, in W
σ=\sigma= Stefan-Boltzmann constant
R= radius of the star, in m
T= surface temperature of the star, in K
To verify the law, they obtain values from databases and manipulate the data as shown.

Table

Question 2(d)

(a)

Outline a conclusion for the investigation.

[ 1 ]

Question 2

[Maximum number: 3]

The circuit shown may be used to measure the internal resistance of a cell.

Question image

Question 2(c)

(a)

The ammeter used in the experiment in (b) is an analogue meter. The student takes measurements without checking for a "zero error" on the ammeter.

[ 3 ]

Question 2(c)(i)

(i)

State what is meant by a zero error.

[ 1 ]

Question 2(c)(ii)

(ii)

After taking measurements the student observes that the ammeter has a positive zero error. Explain what effect, if any, this zero error will have on the calculated value of the internal resistance in (b). provided.

[ 2 ]
0 selected