EduNinja

IB Physics HLS2.2 Collecting and processing dataQuestion Bank

Question 1

[Maximum number: 2]

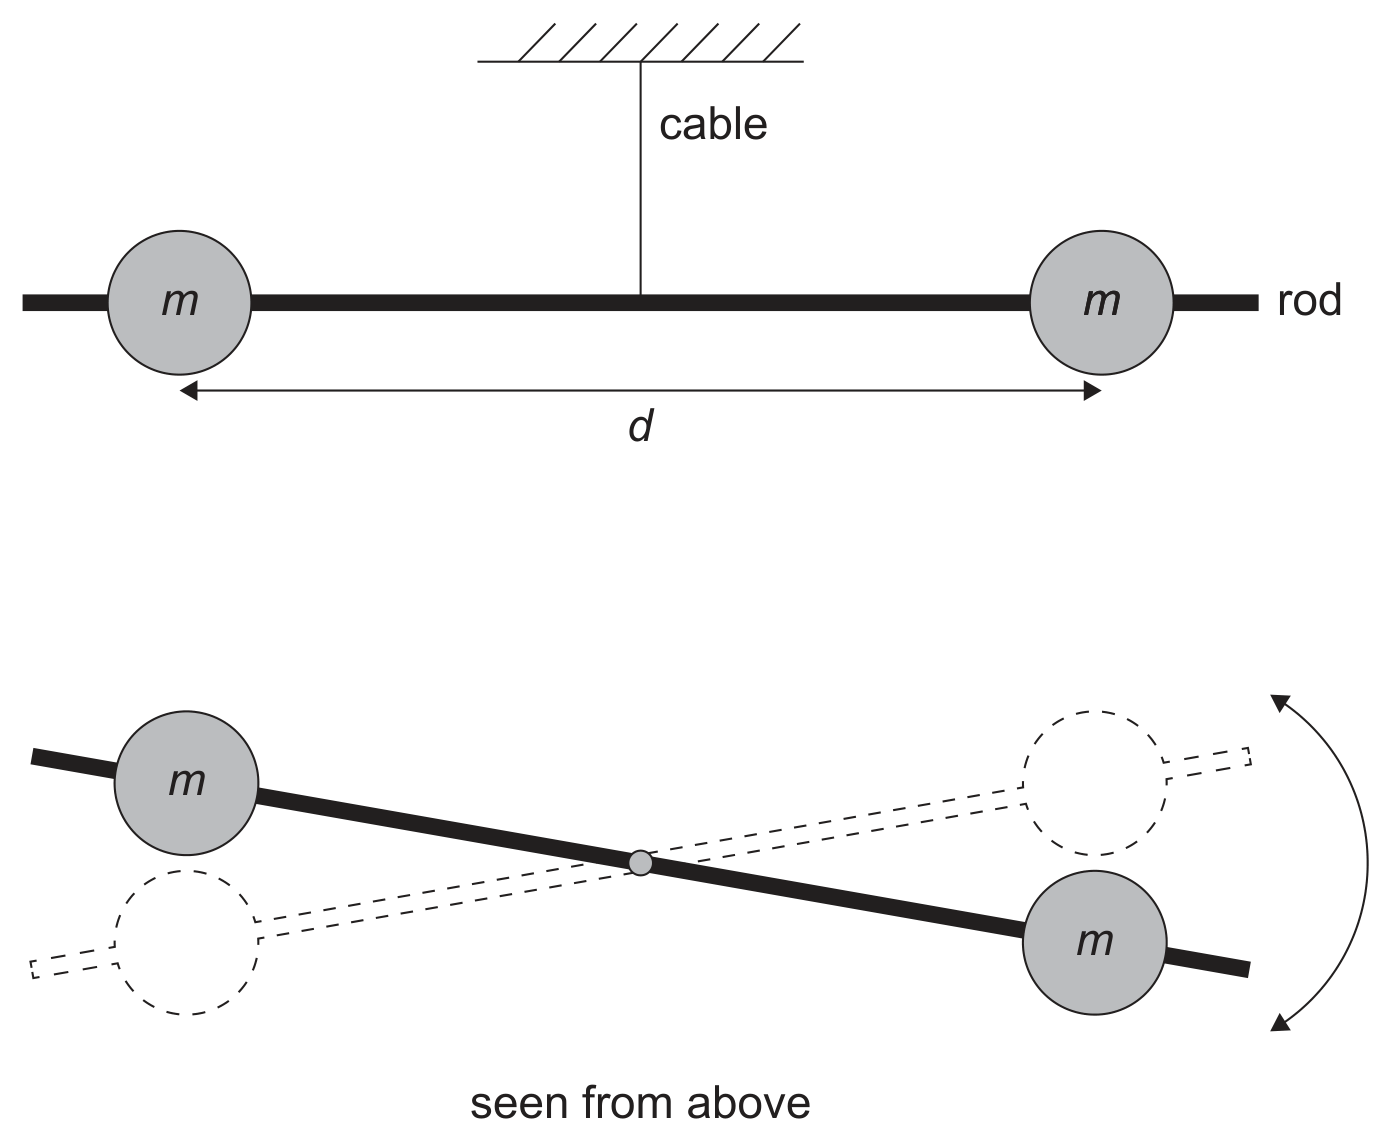
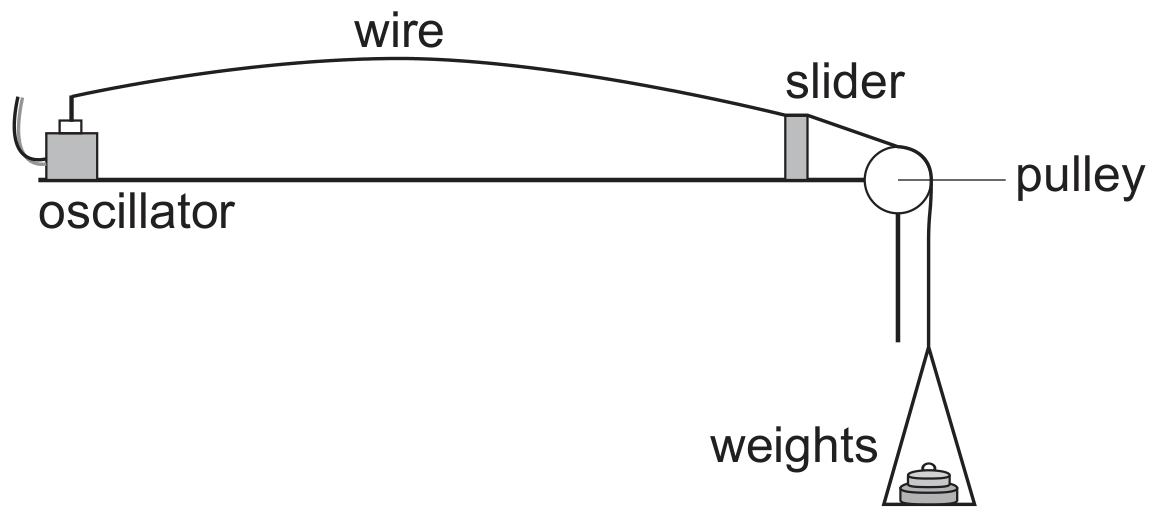
In an investigation to measure the acceleration of free fall a rod is suspended horizontally by two vertical strings of equal length. The strings are a distance d apart.

Question image

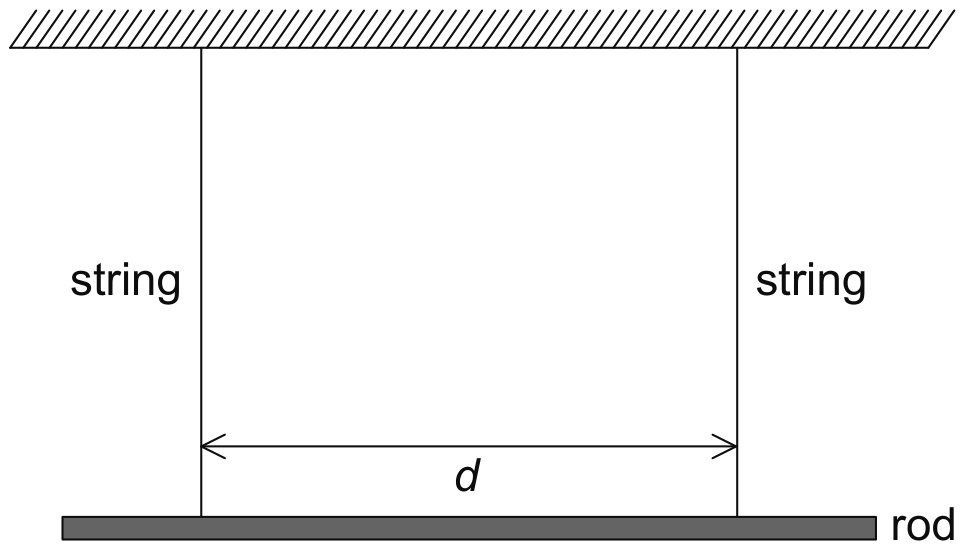
When the rod is displaced by a small angle and then released, simple harmonic oscillations take place in a horizontal plane.

The theoretical prediction for the period of oscillation T is given by the following equation

T=CdgT=\frac{C}{d \sqrt{g}}

where c is a known numerical constant.

Question 1(c)

(a)

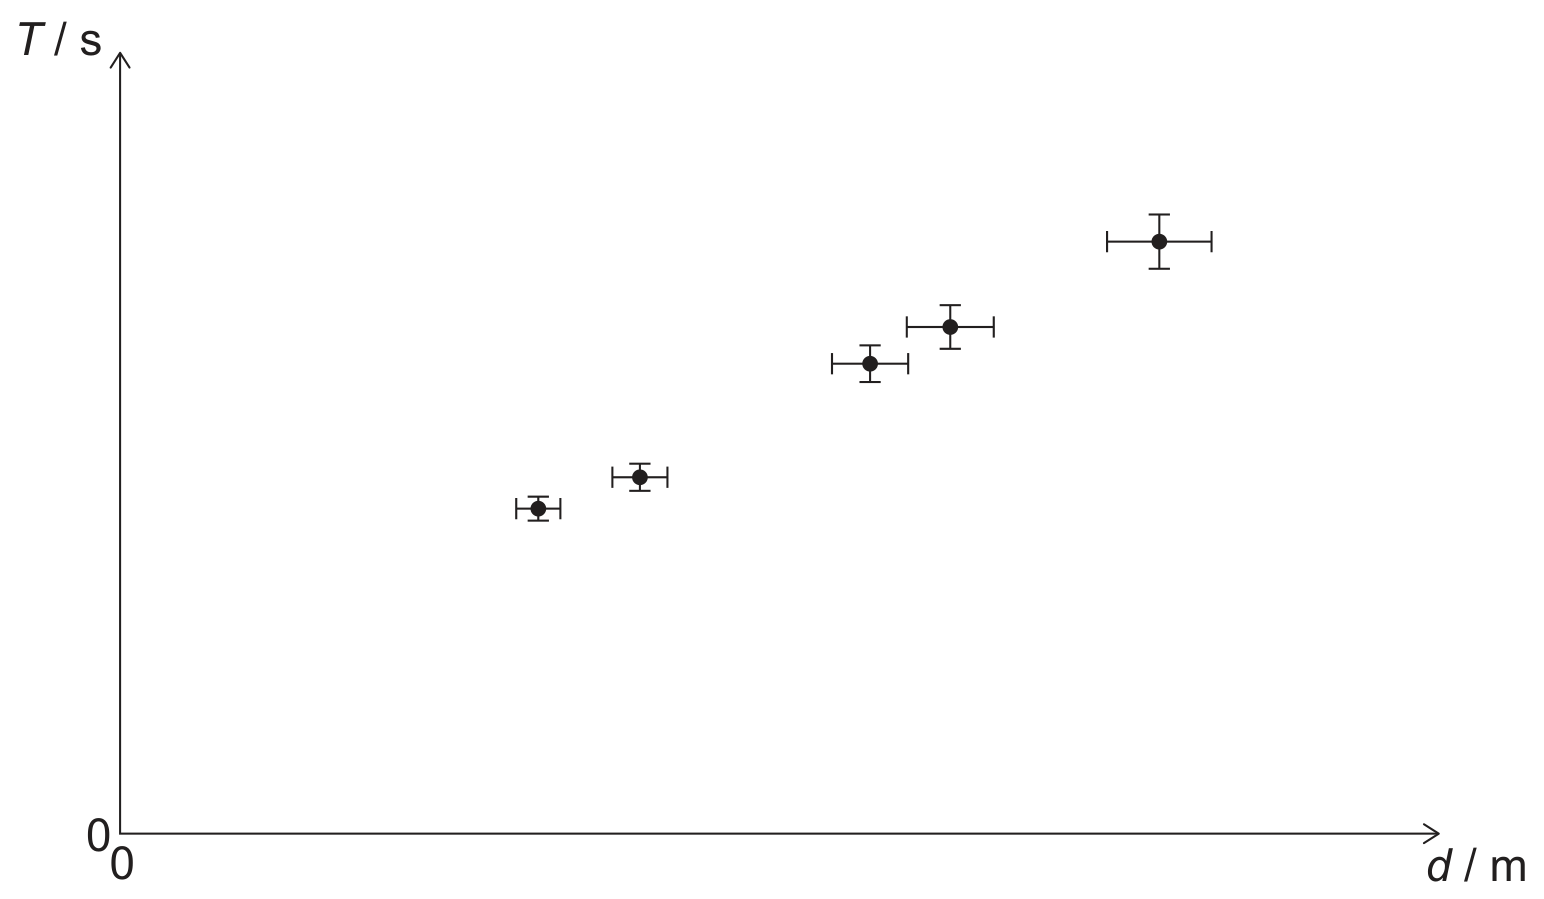
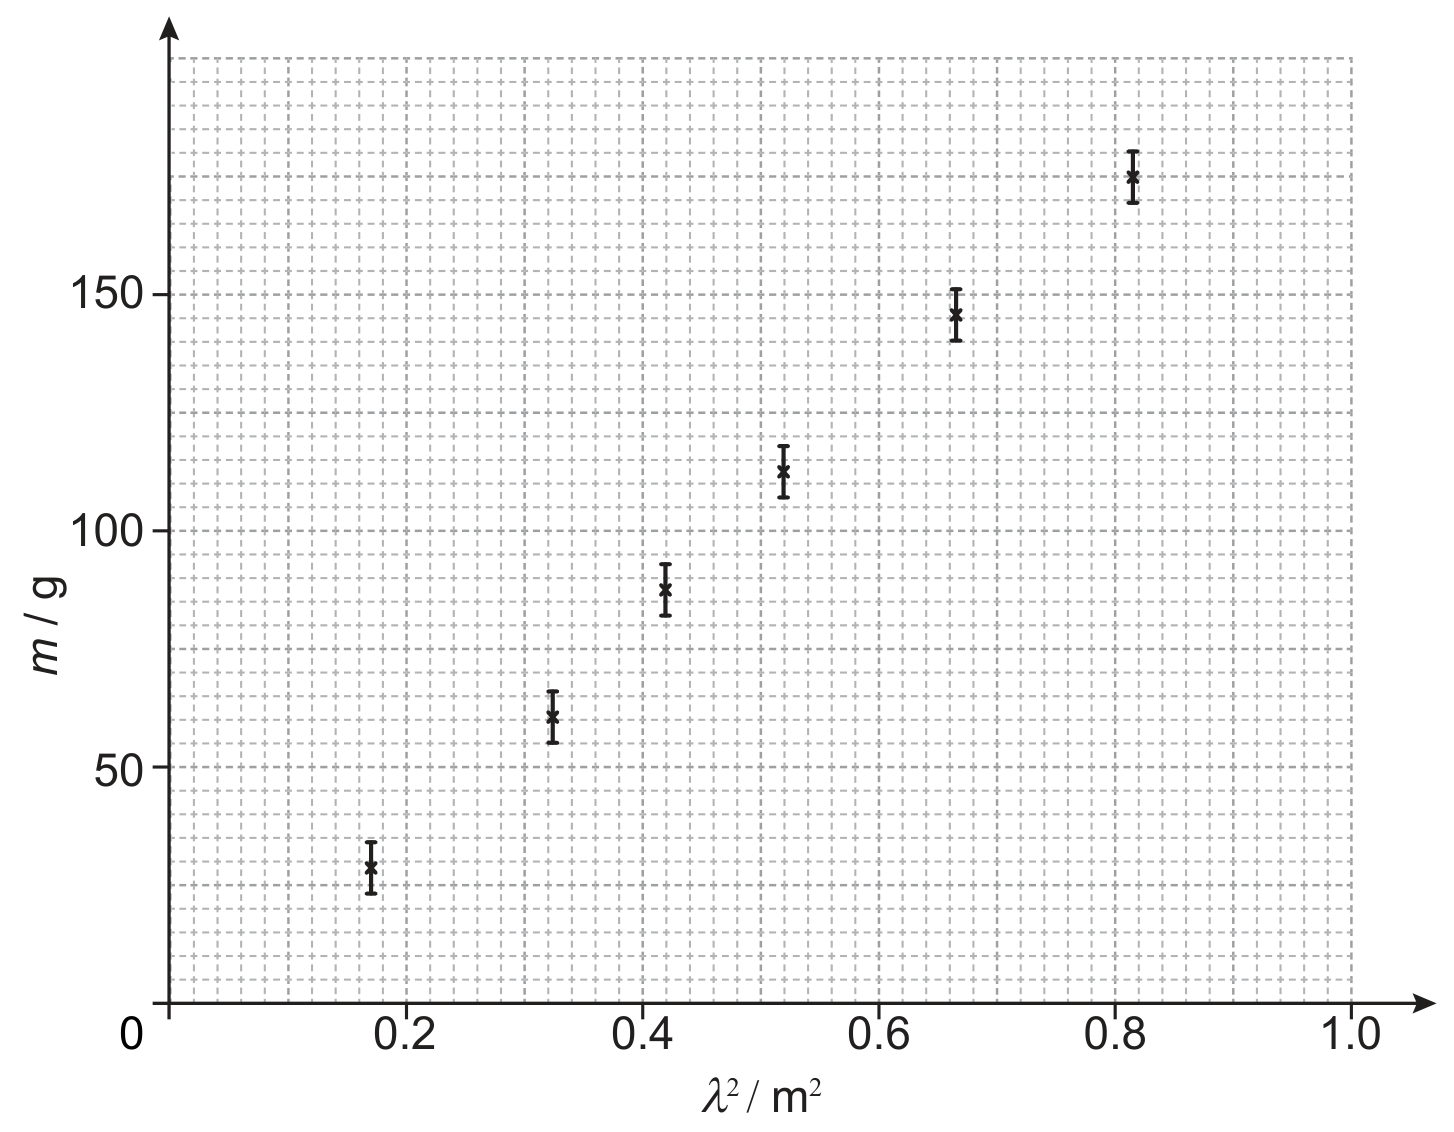
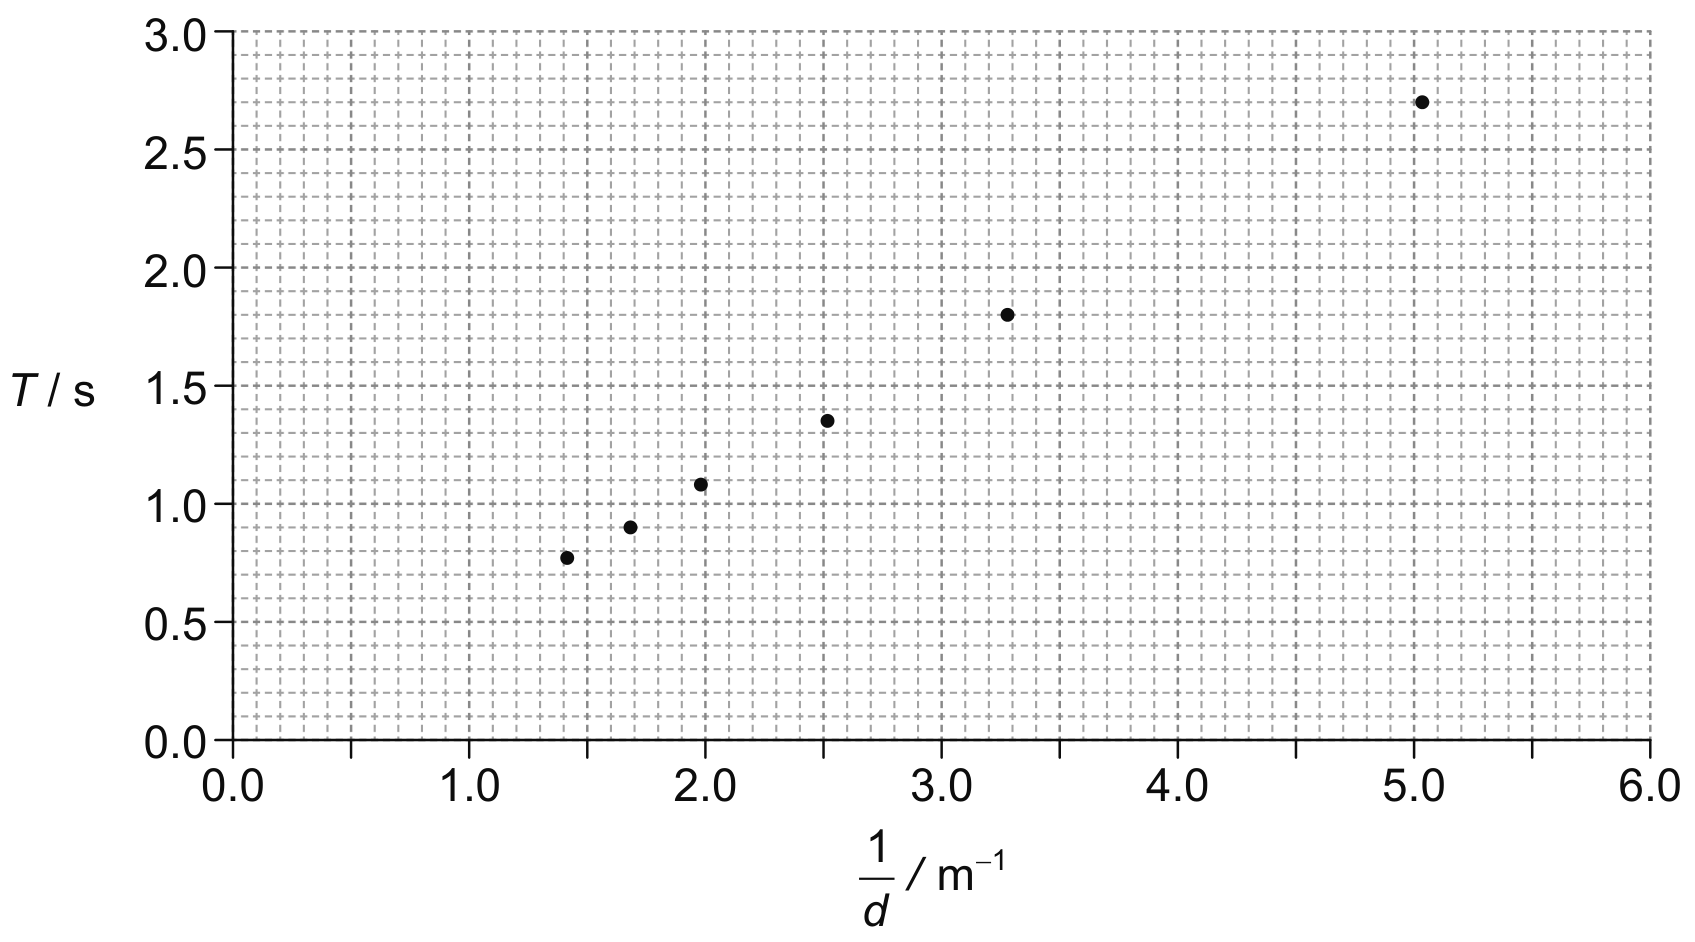
In one experiment d was varied. The graph shows the plotted values of T against 1d\frac{1}{d}. Error bars are negligibly small.

Question image
[ 2 ]

Question 1(c)(ii)

(i)

Suggest whether the data are consistent with the theoretical prediction.

[ 2 ]

Question 1

[Maximum number: 3]

A student investigates the relationship between the pressure in a ball and the maximum force that the ball produces when it rebounds.

A pressure gauge measures a difference Δp\Delta p between the atmospheric pressure and the pressure in the ball. A force sensor measures the maximum force Fmax F_{\text {max }} exerted on it by the ball during the rebound.

measuring gauge pressure

measuring gauge pressure

The student collects the following data.

Table

The student initially hypothesizes that Fmax F_{\text {max }} is proportional to Δp\Delta p.

Question 1(b)

(a)

Deduce, using two suitable data points from the table, that the student's initial hypothesis is not supported.

[ 3 ]

Question 1

[Maximum number: 1]

This question is about the flow of liquids.

A student carries out an experiment to investigate how the rate of flow R of water through a narrow tube varies with the pressure difference across the tube. The pressure difference is proportional to the height h shown in the diagram. The student measures h in cm with a metre ruler. R is obtained by measuring the volume of water collected in a measuring cylinder in a time of 100 s .

Question image

Question 1(b)

(a)

The student enters the data on a spreadsheet and produces the graph and trend line shown below.

Question image

The data point for h=57 cm,R=1.70h=57 \mathrm{~cm}, R=1.70 units has not been shown on the graph. The student estimates the uncertainties in all values of h to be ±1 cm\pm 1 \mathrm{~cm} and the uncertainties in the values of R to be ±5%\pm 5 \%.

[ 1 ]

Question 1(b)(iii)

(i)

Comment on why the trend line is not a perfect match for the data.

[ 1 ]

Question 1

[Maximum number: 2]

A student determines the resistivity ρ\rho of a metal that is in the form of a cylindrical wire. The student makes the following measurements:

 Length L of the wire =(462±2)mm\text { Length } L \text { of the wire }=(462 \pm 2) \mathrm{mm}
Readings for the diameter d of the wire:

Readings for the diameter d of the wire:

 Resistance R of the wire =13.7Ω±1.5%\text { Resistance } R \text { of the wire }=13.7 \Omega \pm 1.5 \%

Question 1(c)

Question 1(c)(i)

(a)
(i)

Show that the mean diameter of the wire is about 0.2 mm .

[ 2 ]

Question 1

[Maximum number: 1]

A student performs an experiment with a rod that is free to oscillate in a horizontal plane. Two identical small spheres, each of mass m, are placed at equal distances from the centre of the rod. The student records values of the period of oscillation of the rod T in seconds for different values of the distance of separation of the spheres d, in metres.

Question image

The student plots the variation with d of T, keeping m constant.

Question image

Question 1(a)

Question 1(a)(ii)

(a)
(i)

The student proposes the hypothesis that T is directly proportional to d. Outline whether the graph supports this model.

[ 1 ]

Question 1

[Maximum number: 2]

Student A conducts an experiment to determine the speed of sound in air using tubes of different lengths. Each tube is open at one end and closed at the other end.

A short pulse of sound is produced by a loudspeaker near the open end of each tube. A microphone is placed at the open end of each tube and detects the sound entering and leaving the tube.

Question image

The graph shows the variation with tube length L of the time t for the sound to travel along the tube and be reflected back.

Question image

The percentage uncertainty in each time measurement is 9 %. The uncertainty in L is negligible.

Question 1(d)

(a)

Student B conducts the same experiment and analysis but places the microphone 10 cm to the left of the open end of each tube.

Compare, with reference to the graphs drawn, the value for speed of sound obtained by student B to that of student A.

[ 2 ]

Question 1

[Maximum number: 1]

A student attaches one end of a copper wire to an oscillator operating at a fixed frequency. The other end of the wire passes over a pulley to weights that hang vertically. The first harmonic standing wave is established by using the slider to change the length of the wire. The procedure is repeated for different weights.

Question image

The mass m of the weights and the wavelength λ\lambda of the wave are related by

m=μf2gλ2m=\frac{\mu f^{2}}{g} \lambda^{2}

where μ\mu is a constant, f is the frequency of the wave and g=9.8 ms2g=9.8 \mathrm{~ms}^{-2}.

Question 1(b)

(a)

The graph shows the data obtained by the student, plotted to show the variation of m with λ2\lambda^{2}.

Question image
[ 1 ]

Question 1(b)(ii)

(i)

Identify the evidence for a systematic error in the data.

[ 1 ]

Question 2

[Maximum number: 1]

In a series of trials to determine the specific latent heat of fusion of water Lwater L_{\text {water }}, crushed ice is added to an insulated container of negligible mass that contains water. The equilibrium temperature of the water is determined when all the ice has melted.

The following data are available:
Mass of water mwater =0.095 kgm_{\text {water }}=0.095 \mathrm{~kg}
Mass of ice mice =0.025 kgm_{\text {ice }}=0.025 \mathrm{~kg}
Specific heat capacity of water cwater =4200 J kg1 K1c_{\text {water }}=4200 \mathrm{~J} \mathrm{~kg}^{-1} \mathrm{~K}^{-1}
Initial temperature of ice =0.0C=0.0^{\circ} \mathrm{C}
Initial temperature of water =45.0C=45.0^{\circ} \mathrm{C}
Average final equilibrium temperature of water =20±1C=20 \pm 1^{\circ} \mathrm{C}

Question 2(a)

(a)

Suggest why some values of the experiment are stated without uncertainties in their measurements.

[ 1 ]

Question 2

[Maximum number: 2]

A student investigates whether the Stefan-Boltzmann law, L=4πσR2T4L=4 \pi \sigma R^{2} T^{4}, applies to stars.
L= luminosity of the star, in W
σ=\sigma= Stefan-Boltzmann constant
R= radius of the star, in m
T= surface temperature of the star, in K
To verify the law, they obtain values from databases and manipulate the data as shown.

Table

Question 2(a)

(a)

Complete the table with the missing values for Polaris B.

The student plots the variation with logT\log T of log(LR2)\log \left(\frac{L}{R^{2}}\right) and draws the line of best fit.

Question image

The student uses a GDC (graphical display calculator) to determine the equation of the line of best fit as y=3.99 x-6.15.

[ 2 ]

Question 3

[Maximum number: 1]

This question is about a thermistor circuit.

The circuit shows a negative temperature coefficient (NTC) thermistor X and a 100kΩ100 \mathrm{k} \Omega fixed resistor R connected across a battery.

Question image

The battery has an electromotive force (emf) of 12.0 V and negligible internal resistance.

Question 3(b)

(a)

The graph below shows the variation with temperature T of the resistance RxR_{\mathrm{x}} of the thermistor.

Question image
[ 1 ]

Question 3(b)(ii)

(i)

State the range of temperatures for which the change in the resistance of the thermistor is most sensitive to changes in temperature.

[ 1 ]
0 selected