EduNinja

IB Physics HLS1.3 MathematicsQuestion Bank

Question 1

[Maximum number: 4]

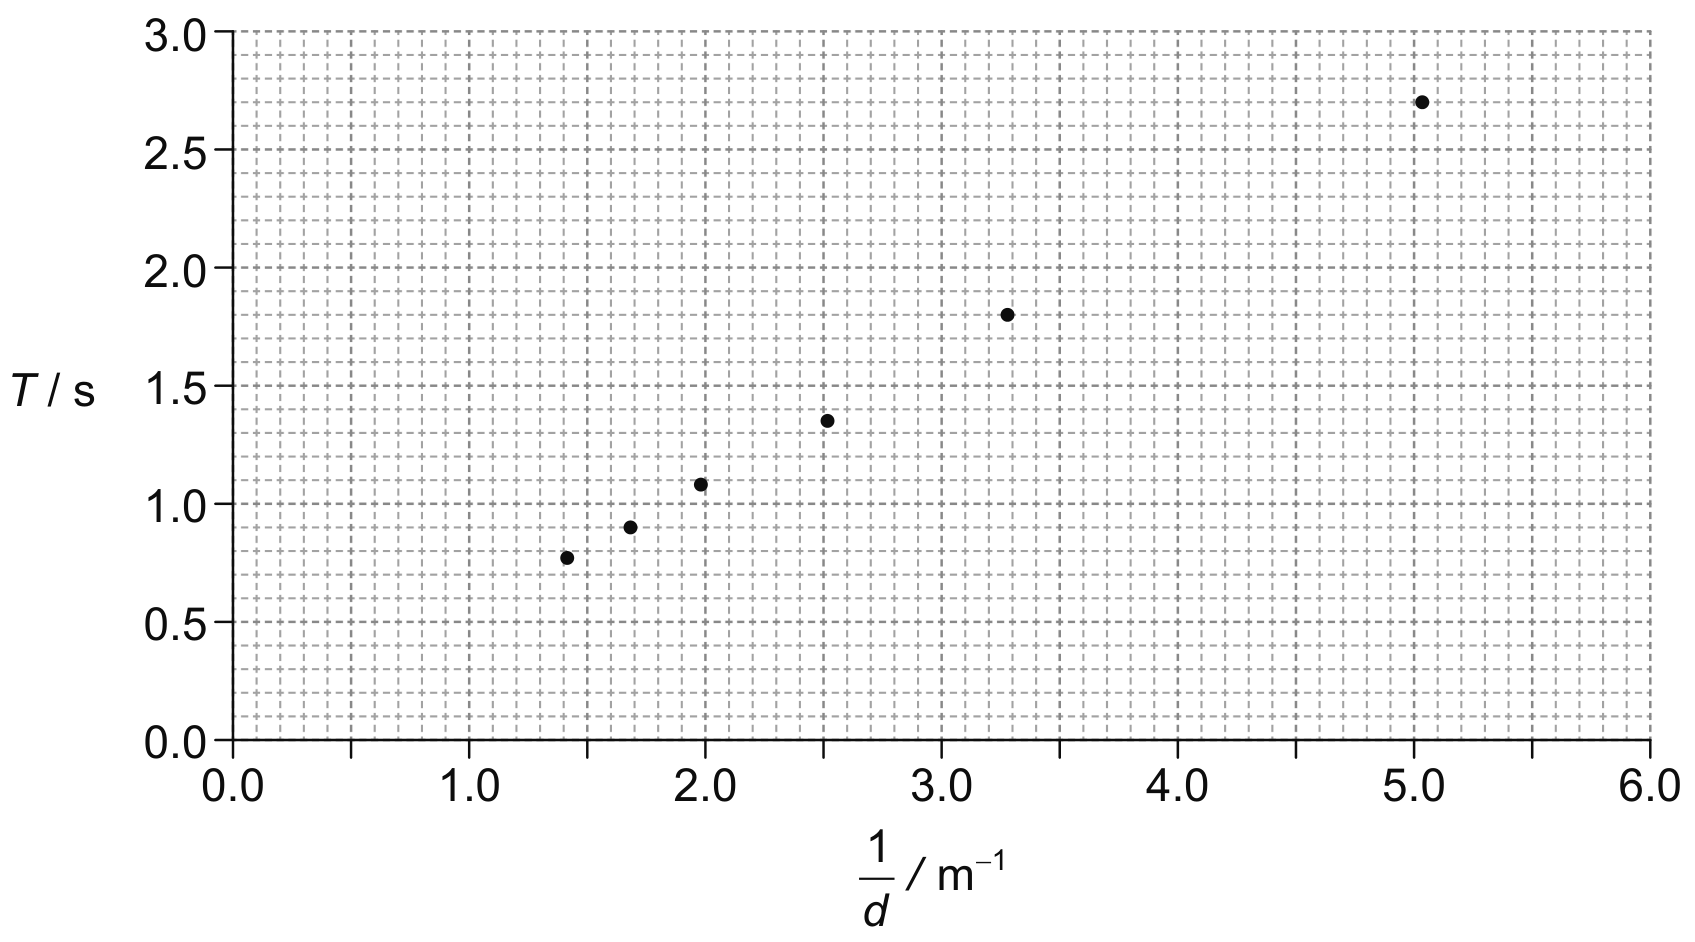
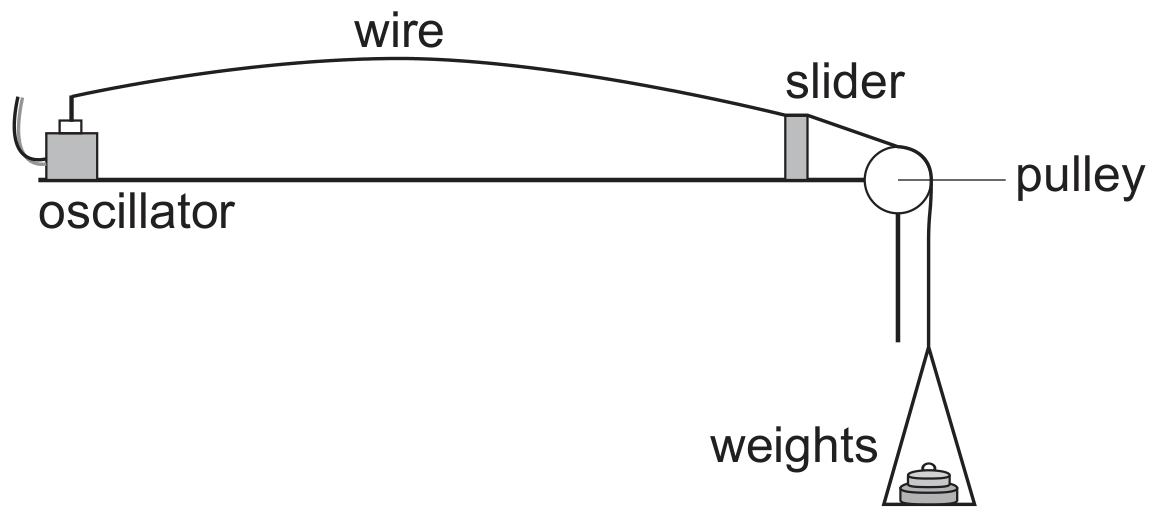
A student attaches one end of a copper wire to an oscillator operating at a fixed frequency. The other end of the wire passes over a pulley to weights that hang vertically. The first harmonic standing wave is established by using the slider to change the length of the wire. The procedure is repeated for different weights.

Question image

The mass m of the weights and the wavelength λ\lambda of the wave are related by

m=μf2gλ2m=\frac{\mu f^{2}}{g} \lambda^{2}

where μ\mu is a constant, f is the frequency of the wave and g=9.8 ms2g=9.8 \mathrm{~ms}^{-2}.

Question 1(a)

(a)

Deduce the unit of μ\mu in terms of fundamental SI units.

[ 1 ]

Question 1(b)

(b)

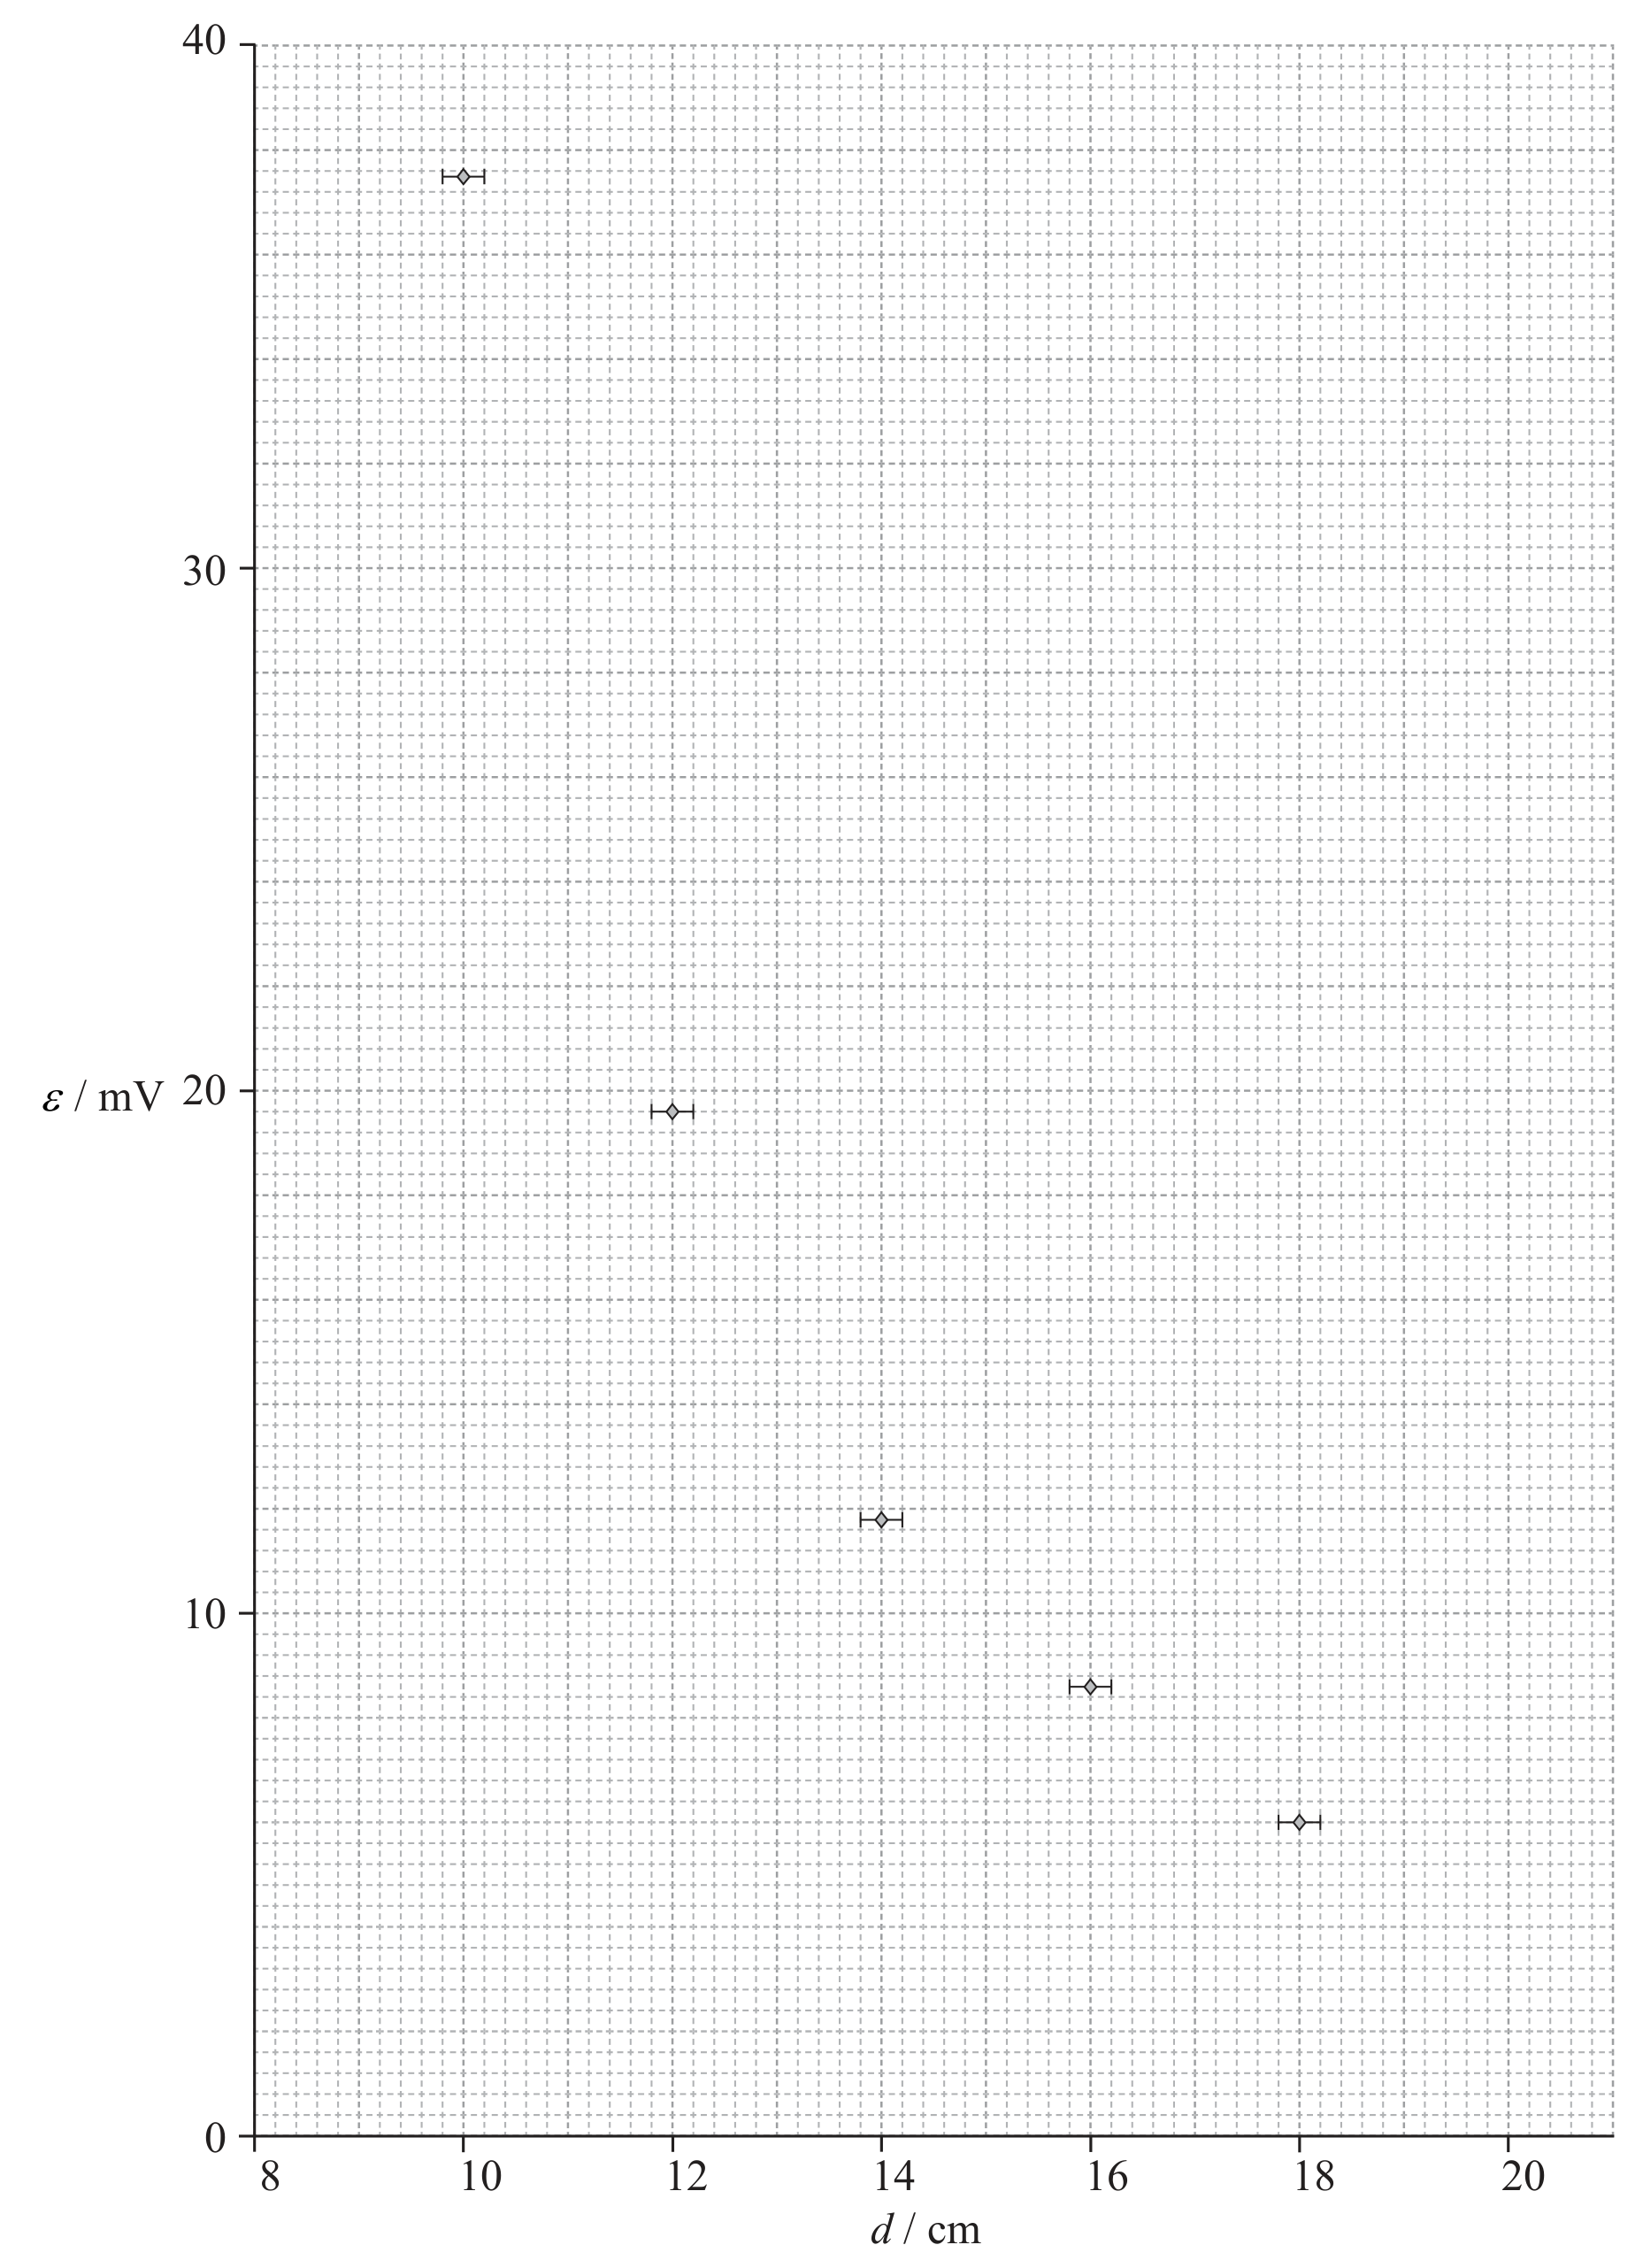
The graph shows the data obtained by the student, plotted to show the variation of m with λ2\lambda^{2}.

Question image
[ 3 ]

Question 1(b)(i)

(i)

Draw the line of best fit for these data.

[ 1 ]

Question 1(b)(iv)

(ii)

Calculate the gradient of the graph.

[ 2 ]

Question 1

[Maximum number: 4]

The density of a metal sphere is determined using a digital caliper and a mass balance.

The digital caliper is used to measure the diameter D of the sphere by placing the sphere in the jaws of the digital caliper. This reading is shown.

The sphere is then removed and another reading is taken immediately afterwards with the jaws closed.

Question image
Question image

Question 1(a)

Question 1(a)(ii)

(a)
(i)

The manufacturer of the digital caliper states that the uncertainty in the device reading is ±0.1 mm\pm 0.1 \mathrm{~mm}.

Calculate the percentage uncertainty in D.

[ 1 ]

Question 1(c)

(b)

The mass M of the sphere is (54.0±0.2)g(54.0 \pm 0.2) \mathrm{g}.

The density of the sphere ρ\rho is calculated to be 11.3×10³ kg m311.3 \times 10^{3} \mathrm{~kg} \mathrm{~m}^{-3}, using ρ=6MπD3\rho=\frac{6 M}{\pi D^{3}}.

[ 3 ]

Question 1(c)(i)

(i)

Calculate the percentage uncertainty in ρ\rho.

[ 2 ]

Question 1(c)(ii)

(ii)

State the value of ρ\rho, including the absolute uncertainty of ρ\rho.

[ 1 ]

Question 1

[Maximum number: 11]

This question is about the flow of liquids.

A student carries out an experiment to investigate how the rate of flow R of water through a narrow tube varies with the pressure difference across the tube. The pressure difference is proportional to the height h shown in the diagram. The student measures h in cm with a metre ruler. R is obtained by measuring the volume of water collected in a measuring cylinder in a time of 100 s .

Question image

Question 1(a)

(a)

State a suitable unit for R.

[ 1 ]

Question 1(b)

(b)

The student enters the data on a spreadsheet and produces the graph and trend line shown below.

Question image

The data point for h=57 cm,R=1.70h=57 \mathrm{~cm}, R=1.70 units has not been shown on the graph. The student estimates the uncertainties in all values of h to be ±1 cm\pm 1 \mathrm{~cm} and the uncertainties in the values of R to be ±5%\pm 5 \%.

[ 5 ]

Question 1(b)(i)

(i)

On the graph, draw the missing data point.

[ 1 ]

Question 1(b)(ii)

(ii)

On the graph, draw the error bars for this data point.

[ 2 ]

Question 1(b)(iv)

(iii)

Explain why the student's estimate of a 5 % uncertainty in all values for R is unlikely to be correct.

[ 2 ]

Question 1(c)

(c)

The equation of the trend line shown in (b) is given by

R=0.0005h2+0.0843h1.5632.R=-0.0005 h^{2}+0.0843 h-1.5632 .
[ 1 ]

Question 1(c)(i)

(i)

Calculate the value of R for h=0.

[ 1 ]

Question 1(d)

(d)

The student estimates that the uncertainty in timing 100 s is ±1 s\pm 1 \mathrm{~s}. Using the data on the graph, deduce the absolute uncertainty in the volume of water collected when R=2.1 units.

[ 4 ]

Question 1

[Maximum number: 6]

A student investigates the relationship between the pressure in a ball and the maximum force that the ball produces when it rebounds.

A pressure gauge measures a difference Δp\Delta p between the atmospheric pressure and the pressure in the ball. A force sensor measures the maximum force Fmax F_{\text {max }} exerted on it by the ball during the rebound.

measuring gauge pressure

measuring gauge pressure

The student collects the following data.

Table

The student initially hypothesizes that Fmax F_{\text {max }} is proportional to Δp\Delta p.

Question 1(c)

(a)

The student now proposes that Fmax 3=kΔpF_{\text {max }}^{3}=k \Delta p.
The student plots a graph of the variation of Fmax 3F_{\text {max }}^{3} with Δp\Delta p.

Question image
[ 2 ]

Question 1(c)(i)

(i)

State the unit for k.

[ 1 ]

Question 1(c)(ii)

(ii)

Plot on the graph the position of the missing point for the Δp\Delta p value of 40 kPa .

The percentage uncertainty in Fmax F_{\text {max }} is ±5%\pm 5 \%. The error bars for Fmax 3F_{\text {max }}^{3} at Δp=10kPa\Delta p=10 \mathrm{kPa} and Δp=80kPa\Delta p=80 \mathrm{kPa} are shown.

[ 1 ]

Question 1(d)

Question 1(d)(i)

(b)
(i)

Calculate the absolute uncertainty in Fmax 3F_{\text {max }}^{3} for Δp=30kPa\Delta p=30 \mathrm{kPa}. State an appropriate number of significant figures for your answer.

[ 3 ]

Question 1(d)(iii)

(ii)

Explain why the new hypothesis is supported.

[ 1 ]

Question 1

[Maximum number: 1]

What is a correct value for the charge on an electron?

A

1.60×10¹²μC1.60 \times 10^{-12} \mu \mathrm{C}

B

1.60×10¹⁵mC1.60 \times 10^{-15} \mathrm{mC}

C

1.60×10²²kC1.60 \times 10^{-22} \mathrm{kC}

D

1.60×1024MC1.60 \times 10^{-24} \mathrm{MC}

Question 1

[Maximum number: 5]

In an experiment, data were collected on the variation of specific heat capacity of water with temperature. The graph of the plotted data is shown.

Question image

Question 1(a)

(a)

Draw the line of best-fit for the data.

[ 1 ]

Question 1(b)

Question 1(b)(i)

(b)
(i)

Determine the gradient of the line at a temperature of 80C80^{\circ} \mathrm{C}.

[ 3 ]

Question 1(b)(ii)

(ii)

State the unit for the quantity represented by the gradient in your answer to (b)(i).

[ 1 ]

Question 1

[Maximum number: 1]

A rocket travels a distance of 3 km in 10 s .

What is the order of magnitude of  the speed of the rocket  the speed of light in a vacuum \frac{\text { the speed of the rocket }}{\text { the speed of light in a vacuum }} ?

A

-5

B

-6

C

-7

D

-8

Question 1

[Maximum number: 1]

The intensity of a wave can be defined as the energy per unit area per unit time. What is the unit of intensity expressed in fundamental SI units?

A

kgm2 s1\mathrm{kg} \mathrm{m}^{-2} \mathrm{~s}^{-1}

B

kgm2 s3\mathrm{kg} \mathrm{m}^{2} \mathrm{~s}^{-3}

C

kgs2\mathrm{kgs}^{-2}

D

kgs3\mathrm{kgs}^{-3}

Question 1

[Maximum number: 8]

In an investigation to measure the acceleration of free fall a rod is suspended horizontally by two vertical strings of equal length. The strings are a distance d apart.

Question image

When the rod is displaced by a small angle and then released, simple harmonic oscillations take place in a horizontal plane.

The theoretical prediction for the period of oscillation T is given by the following equation

T=CdgT=\frac{C}{d \sqrt{g}}

where c is a known numerical constant.

Question 1(a)

(a)

State the unit of C.

[ 1 ]

Question 1(b)

(b)

A student records the time for 20 oscillations of the rod. Explain how this procedure leads to a more accurate measurement of the time for one oscillation T.

[ 2 ]

Question 1(c)

(c)

In one experiment d was varied. The graph shows the plotted values of T against 1d\frac{1}{d}. Error bars are negligibly small.

Question image
[ 1 ]

Question 1(c)(i)

(i)

Draw the line of best fit for these data.

[ 1 ]

Question 1(d)

(d)

The numerical value of the constant c in SI units is 1.67. Determine g, using the graph.

[ 4 ]

Question A1

Question A1(a)

(a)

Outline why the student has recorded the ε\varepsilon values to different numbers of significant digits but the same number of decimal places.

[ 2 ]

Question A1(b)

(b)

The graph shows some of the data points with the uncertainty in the d values.

On the graph

[ 3 ]

Question A1(b)(i)

(i)

draw the data point corresponding to the value of d=19.1 cmd=19.1 \mathrm{~cm}.

[ 1 ]

Question A1(b)(ii)

(ii)

assuming that there is a constant absolute uncertainty in measuring all values of d, draw the error bar for the data point in (b)(i).

[ 1 ]

Question A1(b)(iii)

(iii)

sketch the line of best-fit for all the plotted points.

Question image
[ 1 ]

Question A1(c)

(c)

All values of ε\varepsilon have a percentage uncertainty of ±3%\pm 3 \%. Calculate the percentage uncertainty in the product dεd \varepsilon for the value of d=18.0 cmd=18.0 \mathrm{~cm}.

[ 2 ]

Question A1(d)

(d)

The student hypothesises that there may be an exponential relationship between ε\varepsilon and d of the form shown below, where a and k are constants.

ε=aekd\varepsilon=a \mathrm{e}^{-k d}
[ 3 ]

Question A1(d)(i)

(i)

Deduce a suitable unit for k.

[ 1 ]

Question A1(d)(ii)

(ii)

Suggest the graph that the student should plot in order to get a straight-line graph if the hypothesis is valid.

[ 2 ]
0 selected