

EduNinja

IB Maths AI SL 4.2 Data presentation

IB Maths AI SL 4.2 Data presentation
IB Mathematics: applications and interpretation guide, first assessment 2021

Students practise extracting and computing summary measures—median, quartiles, IQR, outliers—from grouped or raw data presented in tables, histograms, or box plots.

How this is tested

  • read median and quartiles directly from a box-and-whisker diagram or ordered list of raw data
  • calculate IQR as Q₃ − Q₁, then apply 1.5 × IQR rule to identify outliers in a data set
  • estimate a percentage above a threshold using a histogram or cumulative data

Question 1

[Maximum number: 5]

Dr Petrillo wrote a short scientific essay. He analysed the readability of his essay by counting the number of letters in each word.
Dr Petrillo constructs a box and whisker diagram for his data.
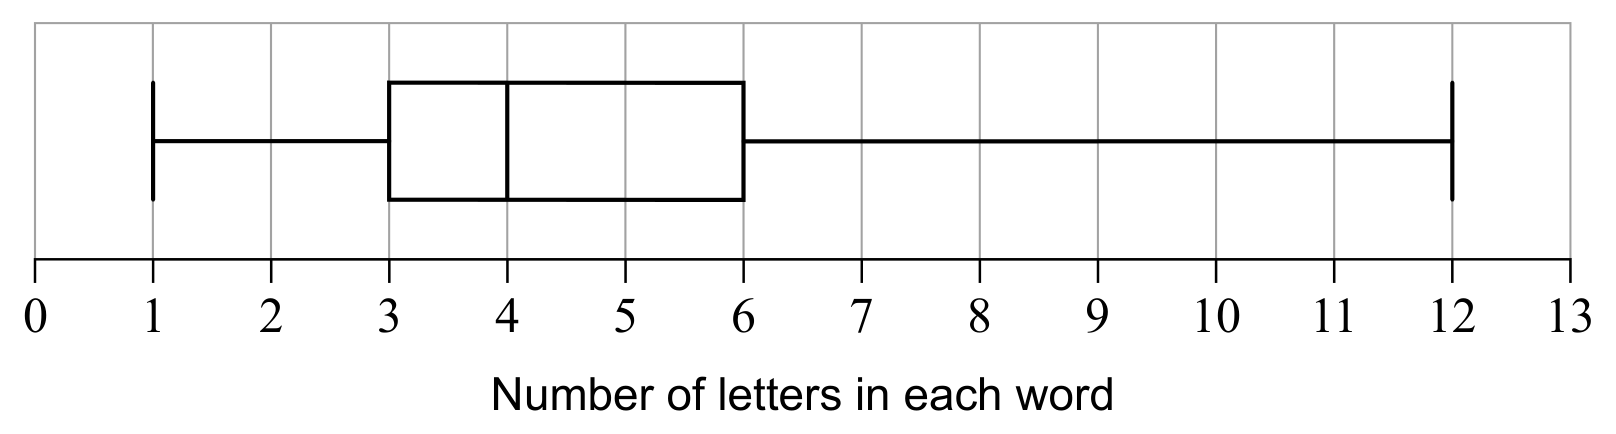
Figure for Question 1 — IB Maths AI SL

Question 1(a)

(a)

Write down

[ 3 ]

Question 1(a)(i)

(i)

the median;

Question 1(a)(ii)

(ii)

the upper quartile, Q3\mathrm{Q}_{3};

Question 1(a)(iii)

(iii)

the interquartile range, IQR.

Dr Petrillo now wants to modify his diagram to show any outliers. He considers the longer words in his data and uses the following formula:

 outliers >(1.5×IQR)+Q3\text { outliers }>(1.5 \times \mathrm{IQR})+\mathrm{Q}_{3}

Words with at least k letters are considered outliers.

[ 3 ]

Question 1(b)

(b)

Find the value of k.

[ 2 ]