Question 1
[Maximum number: 11]
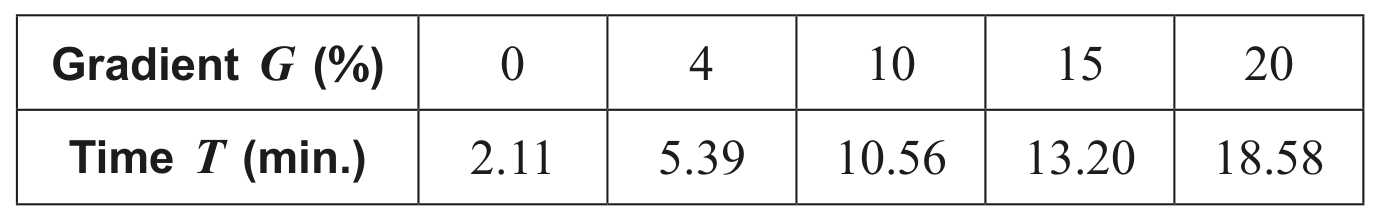
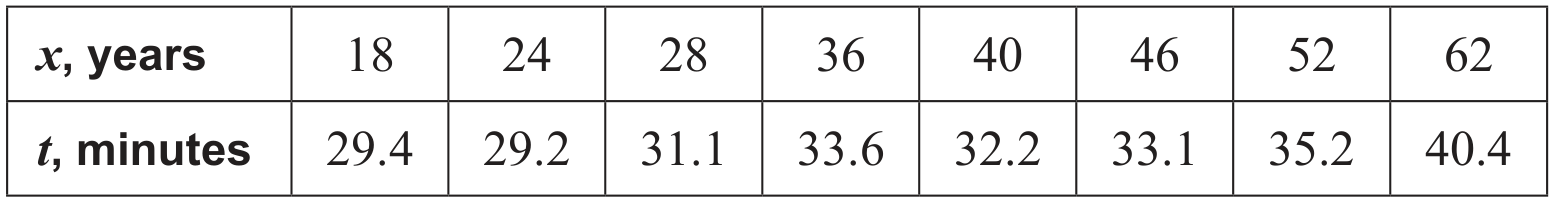
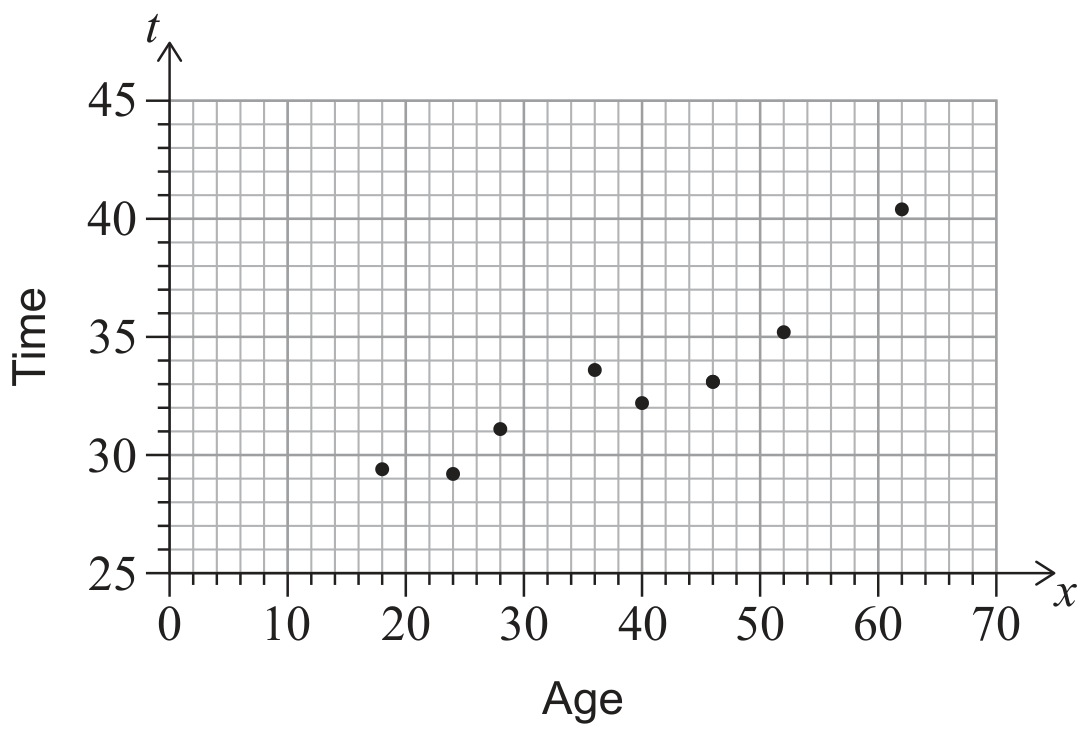
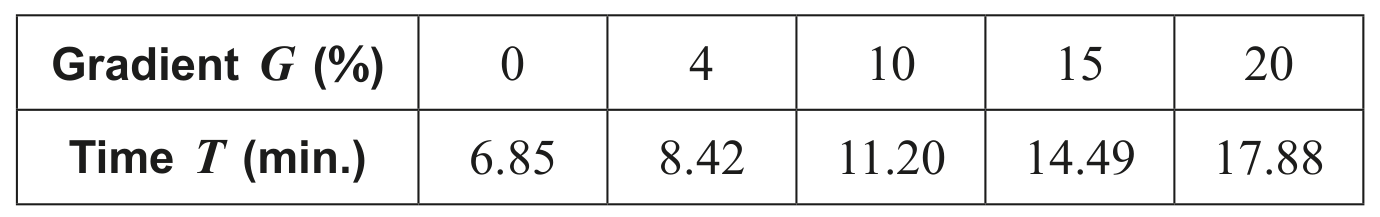
Billy is a keen walker who keeps a record of his performance. The following table shows the time, in minutes, it takes him to walk one kilometre up hills with different gradients. The gradient of each hill is constant.
Question 1(a)
Question 1(a)(i)
(a)
(i)
Find the equation of the regression line of T on G.
[ 4 ]
Question 1(a)(ii)
(ii)
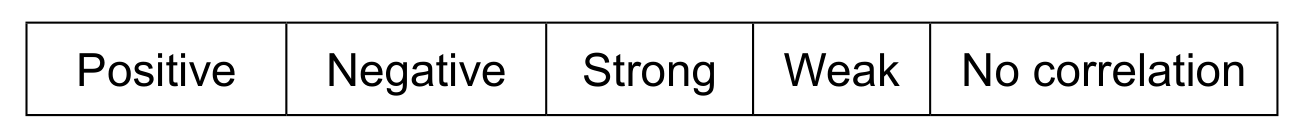
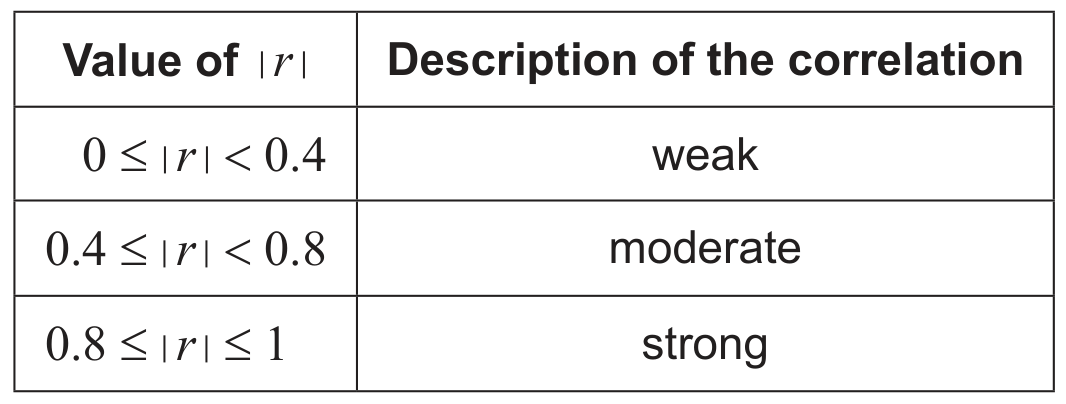
Describe the correlation between T and G with reference to the value of r, the Pearson's product-moment correlation coefficient.
On Sunday, Billy intends to walk up a hill with a gradient of 13 %.
[ 4 ]
Question 1(b)
(b)
Estimate the time it will take Billy to walk one kilometre up the hill.
This morning, Billy walked one kilometre up a hill, and it took 22 minutes.
[ 2 ]
Question 1(c)
(c)
Explain why it would be inappropriate to use the equation found in part (a) to estimate the gradient of this hill.
[ 1 ]