EduNinja

IB Maths AA HL4.1 Statistics and probability - SL contentQuestion Bank

Question 1

[Maximum number: 20]

This question considers two possible models for the occurrence of random events in a computer game.
In a new computer game, each time a player performs an action, there is a random chance that the action will be boosted, meaning that it provides a benefit to the player.
The designer of this computer game is considering two possible models for when to boost an action.
In the first model, the probability that an action will be boosted is constant.

Question 1(a)

(a)

Suppose the probability that an action will be boosted is 0.1 .

[ 5 ]

Question 1(a)(i)

(i)

Find the probability that the first boost occurs on the third action.

[ 2 ]

Question 1(a)(ii)

(ii)

Find the probability that at least one boost occurs in the first six actions.

[ 3 ]

Question 1(b)

(b)

Suppose the probability that an action will be boosted is p, where 0<p<1.

[ 1 ]

Question 1(b)(i)

(i)

Explain why the probability that the first boost occurs on the xth x^{\text {th }} action is p(1p)x1p(1-p)^{x-1}.

Let X be the number of actions until the first boost occurs.

[ 1 ]

Question 1(d)

(c)

Find E(X) and Var(X)\operatorname{Var}(X) when p=0.1.

In the designer's second model, the initial probability that an action is boosted is 0.2 , and each time an action occurs that is not boosted, the probability that the next action is boosted increases by 0.2 . After an action has been boosted, the probability resets to 0.2 for the next action.

[ 2 ]

Question 1(e)

(d)

Show that the probability that the first boost occurs on the third action is 0.288 .

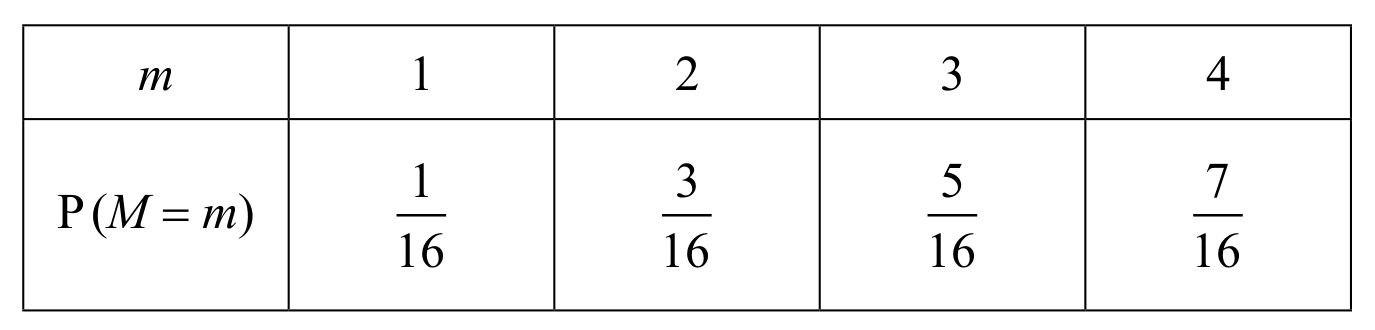
Let Y be the number of actions until the first boost occurs.

[ 2 ]

Question 1(f)

(e)

Explain why Y5Y \leq 5.

The following table shows the probability distribution of Y.
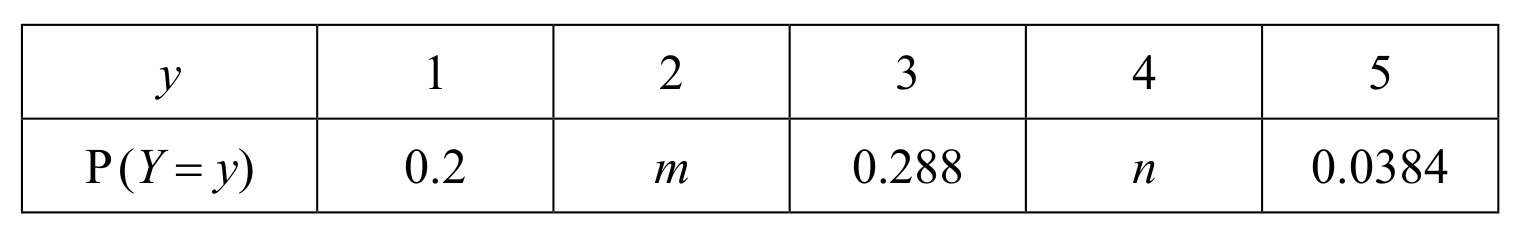
Table
[ 1 ]

Question 1(g)

Question 1(g)(i)

(f)
(i)

Find the value of m and the value of n.

[ 2 ]

Question 1(g)(ii)

(ii)

Show that E(Y)=2.5104.

[ 2 ]

Question 1(g)(iii)

(iii)

Find Var(Y)\operatorname{Var}(Y).

[ 2 ]

Question 1(h)

Question 1(h)(i)

(g)
(i)

Use the expression given in (c)(ii) to find the value of p for which E(X)=E(Y).

[ 1 ]

Question 1(h)(ii)

(ii)

Find Var(X)\operatorname{Var}(X) for this value of p.

[ 1 ]

Question 1(h)(iii)

(iii)

Hence determine, with a reason, which model provides a more consistent experience for the player with respect to boosted actions.

[ 1 ]

Question 1

[Maximum number: 7]

In Lucy's music academy, eight students took their piano diploma examination and achieved scores out of 150. For her records, Lucy decided to record the average number of hours per week each student reported practising in the weeks prior to their examination. These results are summarized in the table below.

Table

Question 1(a)

(a)

Find Pearson's product-moment correlation coefficient, r, for these data.

[ 2 ]

Question 1(b)

(b)

The relationship between the variables can be modelled by the regression equation D=a h+b. Write down the value of a and the value of b.

[ 1 ]

Question 1(c)

(c)

One of these eight students was disappointed with her result and wished she had practised more. Based on the given data, determine how her score could have been expected to alter had she practised an extra five hours per week.

[ 2 ]

Question 1(d)

(d)

Lucy asserts that the number of hours a student practises has a direct effect on their final diploma result. Comment on the validity of Lucy's assertion.

Lucy suspected that each student had not been practising as much as they reported. In order to compensate for this, Lucy deducted a fixed number of hours per week from each of the students' recorded hours.

[ 1 ]

Question 1(e)

(e)

State how, if at all, the value of r would be affected.

[ 1 ]

Question 1

[Maximum number: 5]

The following table shows the Mathematics test scores ( x ) and the Science test scores ( y ) for a group of eight students.

Table

The regression line of y on x for this data can be written in the form y=a x+b.

Question 1(a)

(a)

Find the value of a and the value of b.

[ 2 ]

Question 1(b)

(b)

Write down the value of the Pearson's product-moment correlation coefficient, r.

[ 1 ]

Question 1(c)

(c)

Use the equation of your regression line to predict the Science test score for a student who has a score of 78 on the Mathematics test. Express your answer to the nearest integer.

[ 2 ]

Question 1

[Maximum number: 4]

A botanist is conducting an experiment which studies the growth of plants.
The heights of the plants are measured on seven different days.
The following table shows the number of days, d, that the experiment has been running and the average height, h cmh \mathrm{~cm}, of the plants on each of those days.

Table

The value of Pearson's product-moment correlation coefficient, r, for this data is 0.991 , correct to three significant figures.

Question 1(a)

(a)

The regression line of h on d for this data can be written in the form h=a d+b.

Find the value of a and the value of b.

[ 2 ]

Question 1(b)

(b)

Use your regression line to estimate the average height of the plants when the experiment has been running for 20 days.

[ 2 ]

Question 1

[Maximum number: 6]

Claire rolls a six-sided die 16 times.
The scores obtained are shown in the following frequency table.

Table

It is given that the mean score is 3 .

Question 1(a)

(a)

Find the value of p and the value of q.

Each of Claire's scores is multiplied by 10 in order to determine the final score for a game she is playing.

[ 5 ]

Question 1(b)

(b)

Write down the mean final score.

[ 1 ]

Question 1

[Maximum number: 21]

This question asks you to use polynomial functions to model some situations in probability.
Two unbiased tetrahedral (four-sided) dice with faces labelled 1,2,3 and 4 are thrown and the scores recorded.
The random variable M denotes the maximum of these two scores.
The probability distribution of M is given in the following table.

Table

Question 1(a)

(a)

Find E(M).

An alternative way to represent the probability distribution of M is to use a polynomial function, G, where G(t)=m=14P(M=m)tmG(t)=\sum_{m=1}^{4} \mathrm{P}(M=m) t^{m}.
Hence, for the distribution of M,G(t)=116t+316t2+516t3+716t4M, G(t)=\frac{1}{16} t+\frac{3}{16} t^{2}+\frac{5}{16} t^{3}+\frac{7}{16} t^{4}.

[ 2 ]

Question 1(b)

(b)

Find G(1).

[ 1 ]

Question 1(c)

Question 1(c)(ii)

(c)
(i)

Hence, show that G(1)=E(M)G^{\prime}(1)=\mathrm{E}(M).

A bag contains two red balls and three yellow balls.
Two balls are selected at random without replacement from the bag.
The random variable X denotes the total number of red balls selected.
The probability distribution of X can be represented by the polynomial function, GXG_{X}, where

GX(t)=x=02P(X=x)txG_{X}(t)=\sum_{x=0}^{2} \mathrm{P}(X=x) t^{x}
[ 3 ]

Question 1(d)

(d)

Show that GX(t)=310+35t+110t2G_{X}(t)=\frac{3}{10}+\frac{3}{5} t+\frac{1}{10} t^{2}, making it clear how the coefficients of GX(t)G_{X}(t) have been determined.

An unbiased coin and a biased coin are tossed.
The probability of obtaining a tail on the biased coin is p.
The random variable Y denotes the total number of tails obtained from tossing both coins.
The probability distribution of Y can be represented by the polynomial function, GYG_{Y}, where

GY(t)=y=02P(Y=y)tyG_{Y}(t)=\sum_{y=0}^{2} \mathrm{P}(Y=y) t^{y}
[ 5 ]

Question 1(e)

(e)

Given that the coefficient of t2t^{2} in GY(t)G_{Y}(t) is 13\frac{1}{3}, find

[ 6 ]

Question 1(e)(i)

(i)

the value of p;

[ 2 ]

Question 1(e)(ii)

(ii)

an expression for GY(t)G_{Y}(t).

The random variable Z denotes the sum of the total number of red balls selected, X, and the total number of tails obtained from tossing both coins, Y.

The probability distribution of Z can be represented by the function, GZG_{Z}, where

GZ(t)=GX(t)GY(t)G_{Z}(t)=G_{X}(t) G_{Y}(t)
[ 4 ]

Question 1(f)

(f)

For random variable Z, it can be shown that GZ(1)=E(Z)G_{Z}^{\prime}(1)=\mathrm{E}(Z).

Use this result to find E(Z).

[ 4 ]

Question 1

[Maximum number: 11]

The weights of the oranges produced by a farm may be assumed to be normally distributed with mean 205 grams and standard deviation 10 grams.

Question 1(a)

(a)

Find the probability that a randomly chosen orange weighs more than 200 grams.

[ 2 ]

Question 1(b)

(b)

Five of these oranges are selected at random to be put into a bag. Find the probability that the combined weight of the five oranges is less than 1 kilogram.

[ 4 ]

Question 1(c)

(c)

The farm also produces lemons whose weights may be assumed to be normally distributed with mean 75 grams and standard deviation 3 grams. Find the probability that the weight of a randomly chosen orange is more than three times the weight of a randomly chosen lemon.

[ 5 ]

Question 1

[Maximum number: 8]

A traffic radar records the speed, v kilometres per hour (kmh1)\left(\mathrm{km} \mathrm{h}^{-1}\right), of cars on a section of a road. The following table shows a summary of the results for a random sample of 1000 cars whose speeds were recorded on a given day.

Table

Question 1(a)

(a)

Using the data in the table,

[ 4 ]

Question 1(a)(i)

(i)

show that an estimate of the mean speed of the sample is 113.21 km h1113.21 \mathrm{~km} \mathrm{~h}^{-1};

Question 1(a)(ii)

(ii)

find an estimate of the variance of the speed of the cars on this section of the road.

[ 4 ]

Question 1(b)

(b)

Find the 95 % confidence interval, I, for the mean speed.

[ 2 ]

Question 1(c)

(c)

Let J be the 90 % confidence interval for the mean speed.

Without calculating J, explain why JIJ \subset I.

[ 2 ]

Question 1

[Maximum number: 4]

1.
The marks obtained by a group of students in a class test are shown below.

Table

Given the mean of the marks is 6.5 , find the value of k.

Question 1

[Maximum number: 14]

A baker produces loaves of bread that he claims weigh on average 800 g each. Many customers believe the average weight of his loaves is less than this. A food inspector visits the bakery and weighs a random sample of 10 loaves, with the following results, in grams:

783,802,804,785,810,805,789,781,800,791.

Assume that these results are taken from a normal distribution.

Question 1(a)

(a)

Determine unbiased estimates for the mean and variance of the distribution.

In spite of these results the baker insists that his claim is correct.

[ 3 ]

Question 1(b)

(b)

Stating appropriate hypotheses, test the baker's claim at the 10 % level of significance.

The inspector informs the baker that he must improve his quality control and reject any loaf that weighs less than 790 g . The baker changes his production methods and asserts that he has reduced the number of low weight loaves. On a subsequent visit to the bakery the inspector tests a random sample of loaves for sale. Of the 40 loaves tested, 5 should have been rejected.

[ 7 ]

Question 1(c)

(c)

Calculate a 95 % confidence interval for the proportion of loaves for sale that should be rejected.

[ 4 ]
0 selected