
Question 6(a)
[Maximum number: 2]
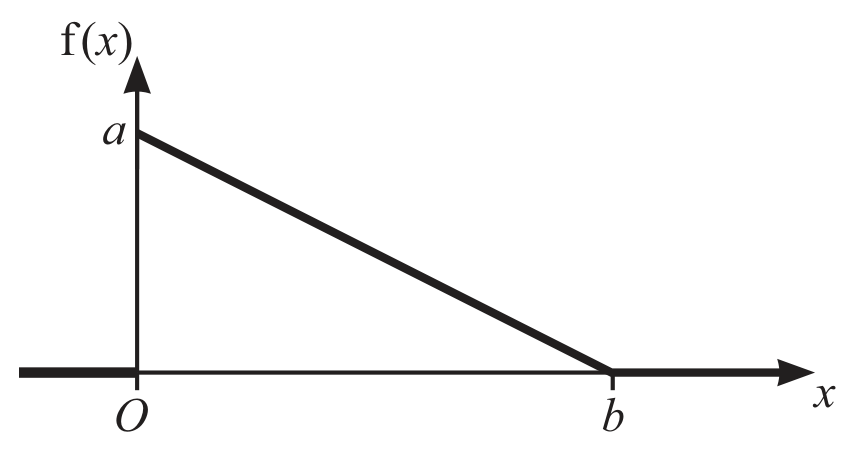
The diagram shows the graph of the probability density function, f, of a random variable X. The graph is a straight line from ( 0, a ) to ( b, 0 ) where a and b are constants. Elsewhere f(x)=0.
Find an expression for b in terms of a.