[Maximum number: 5]
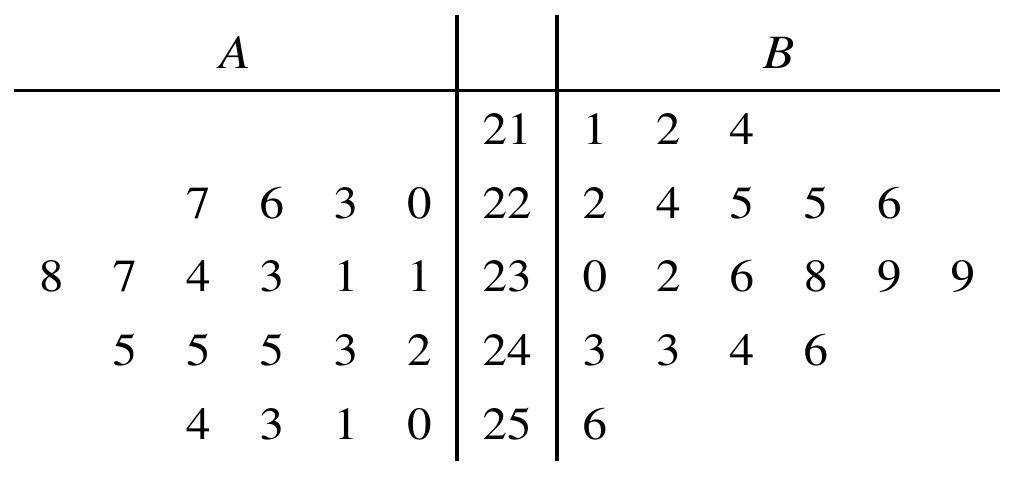
The following back-to-back stem-and-leaf diagram shows the annual salaries of a group of 39 females and 39 males.
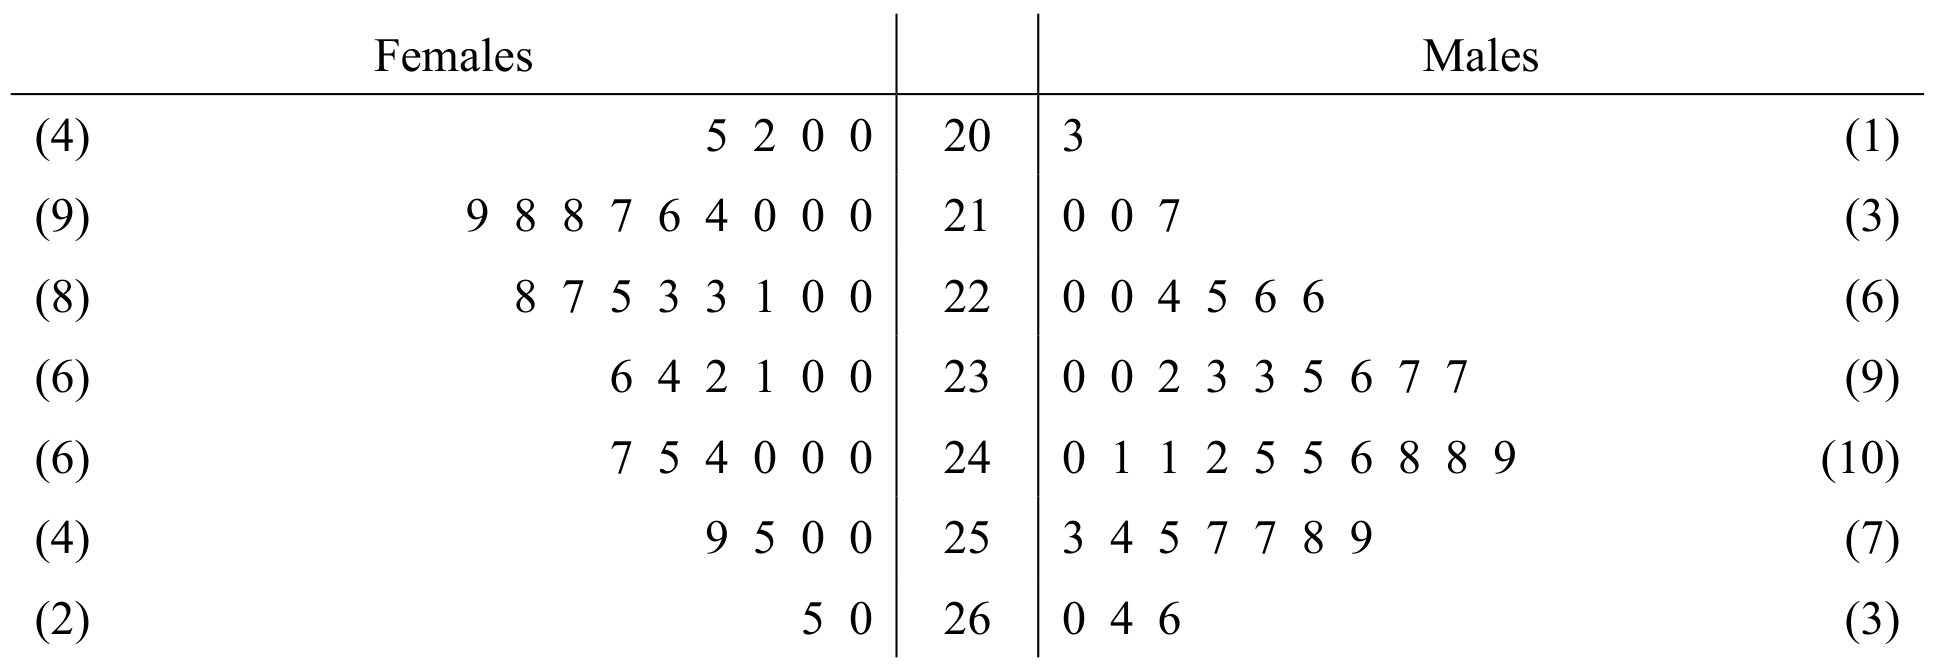
Key: 2 | 20 | 3 means $20200for females and $20300 for males.
(a)
Find the median and the quartiles of the females' salaries.
You are given that the median salary of the males is $ 24000, the lower quartile is $ 22600 and the upper quartile is $ 25300.
[ 2 ]
(b)
Draw a pair of box-and-whisker plots in a single diagram on the grid below to represent the data.

[ 3 ]