CAIE IGCSE Chemistry Heating and Cooling Curves
Practise reading and sketching heating or cooling curves, locating melting, boiling and freezing points and explaining plateaux using particle attractions.
- Syllabus
- 2026–2028
- Objective
- 1.1.5
- Level
- —
Practise reading and sketching heating or cooling curves, locating melting, boiling and freezing points and explaining plateaux using particle attractions.
2 Z is a covalent substance. In an experiment, a sample of pure solid Z was continually heated for 11 minutes.
The graph shows how the temperature of the sample of pure Z changed during the first 9 minutes.
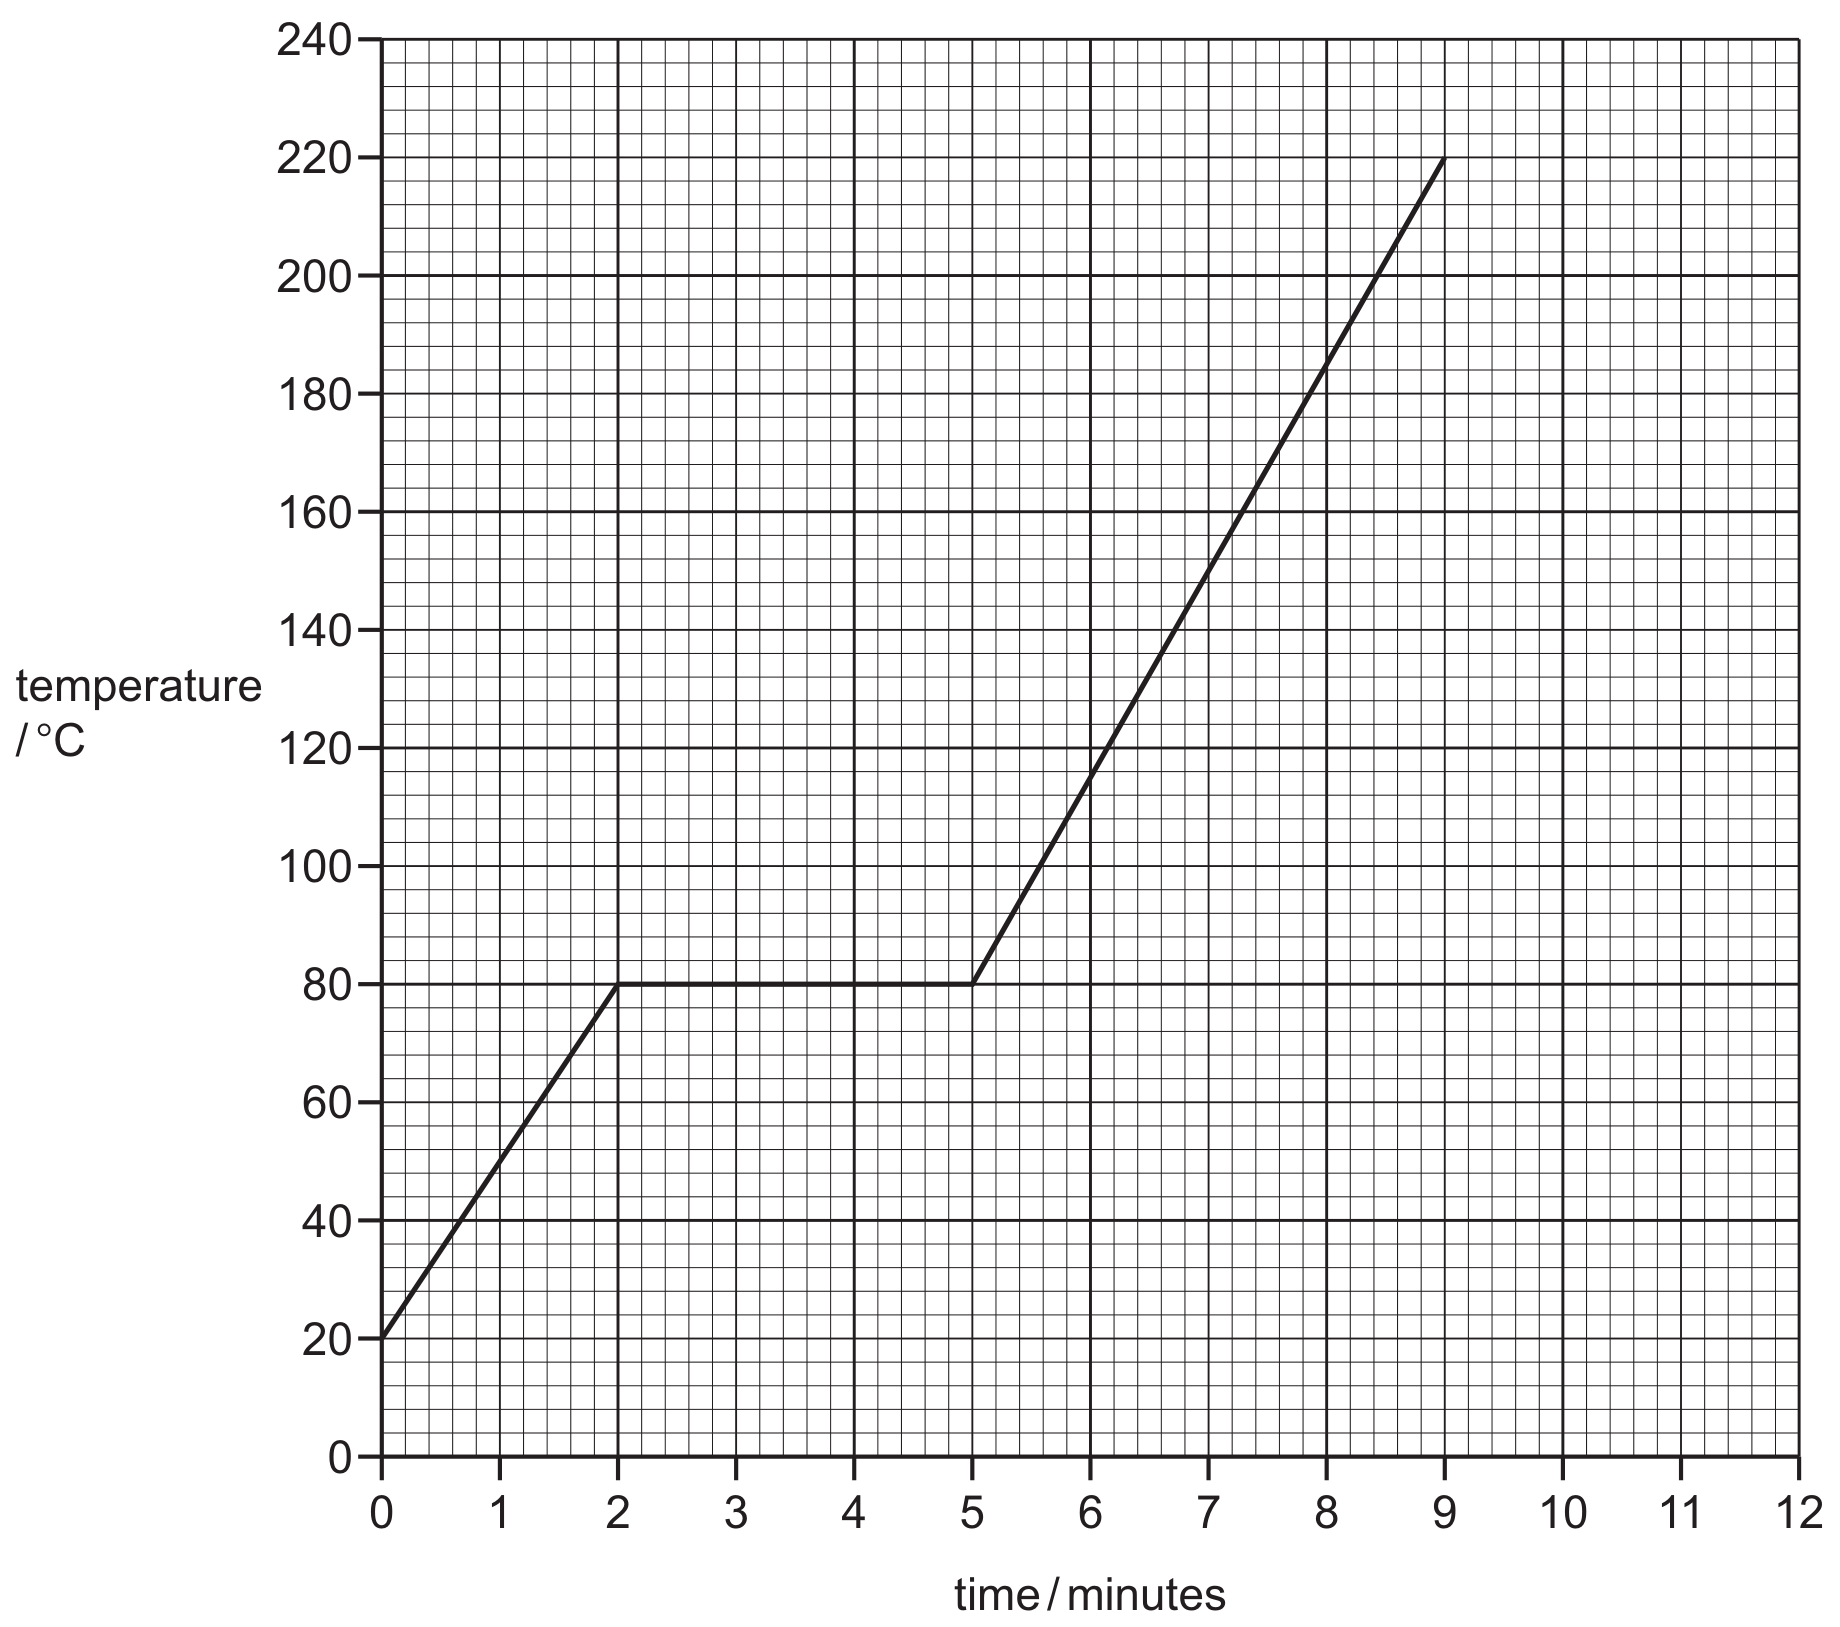
What is the melting point of pure Z ?
The sample of pure Z began to boil at 9 minutes. It was boiled for 2 minutes.
Use this information to sketch on the grid how the temperature of the sample of pure Z changed between 9 minutes and 11 minutes.
The sample of pure Z was continually heated between 2 minutes and 5 minutes.
Explain, in terms of attractive forces, why there was no increase in the temperature of the sample of pure Z between 2 minutes and 5 minutes.
A sample of pure Z was allowed to cool from to . The total time taken was 8 minutes.
Starting from point x, sketch on the grid how the temperature of the sample of pure Z changed between 0 minutes and 8 minutes.
![[Total: 10]](https://cheese-dev-public.oss-accelerate.aliyuncs.com/question-bank/22073/images/question_page5_fig4.png)
[Total: 10]