EduNinja

IGCSE Additional Math14.15. Use kinematics graphsTopic Practice

14.15. Use kinematics graphs

CAIE IGCSE Additional Math 14.15. Use kinematics graphs question practice helps you revise this syllabus point with the course map in view. Use this page to focus on one topic, check the style of questions available, and connect each attempt back to the knowledge area it is testing.

EduNinja keeps Additional Math practice aligned to CAIE, so you can move from topic review into exam-style question bank work without losing the syllabus structure. Start with a small set, mark the weak steps, then return to nearby topic links when a definition, graph, calculation, or explanation needs repair.

Question 4

[Maximum number: 6]
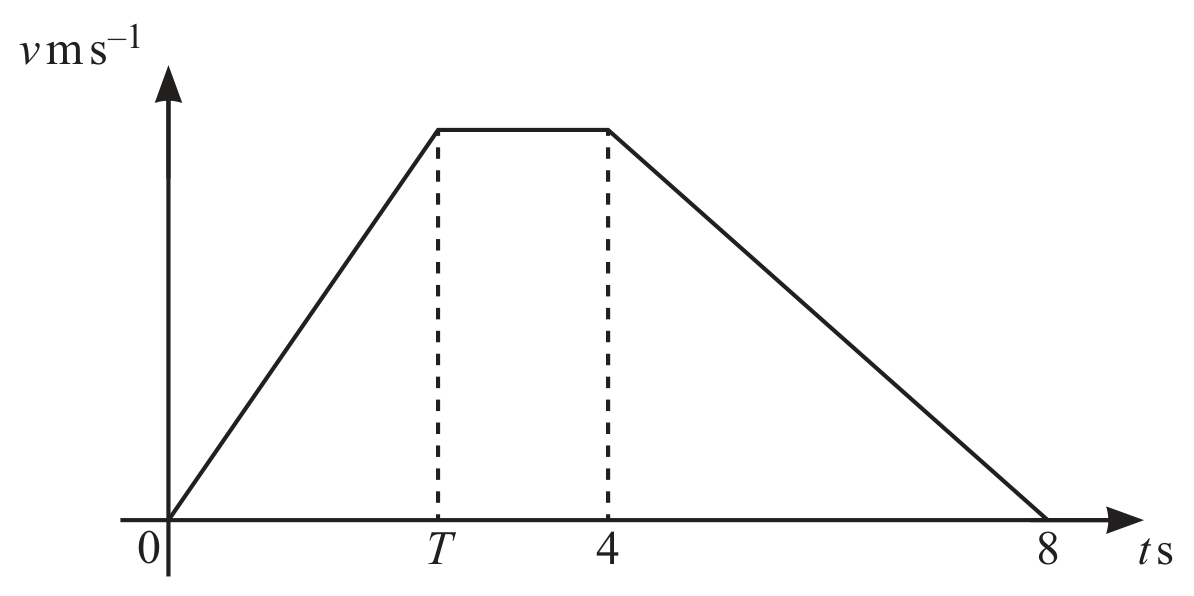
Question image

The velocity-time graph represents the motion of a particle moving in a straight line. The acceleration during the first T seconds of the motion is 2 ms22 \mathrm{~ms}^{-2}.
The total distance travelled is 27 m.

Question 4(a)

(a)

Calculate T.

[ 4 ]

Question 4(b)

(b)

Calculate the acceleration during the last 4 seconds of the motion.

[ 2 ]
Question 4

[Maximum number: 4]

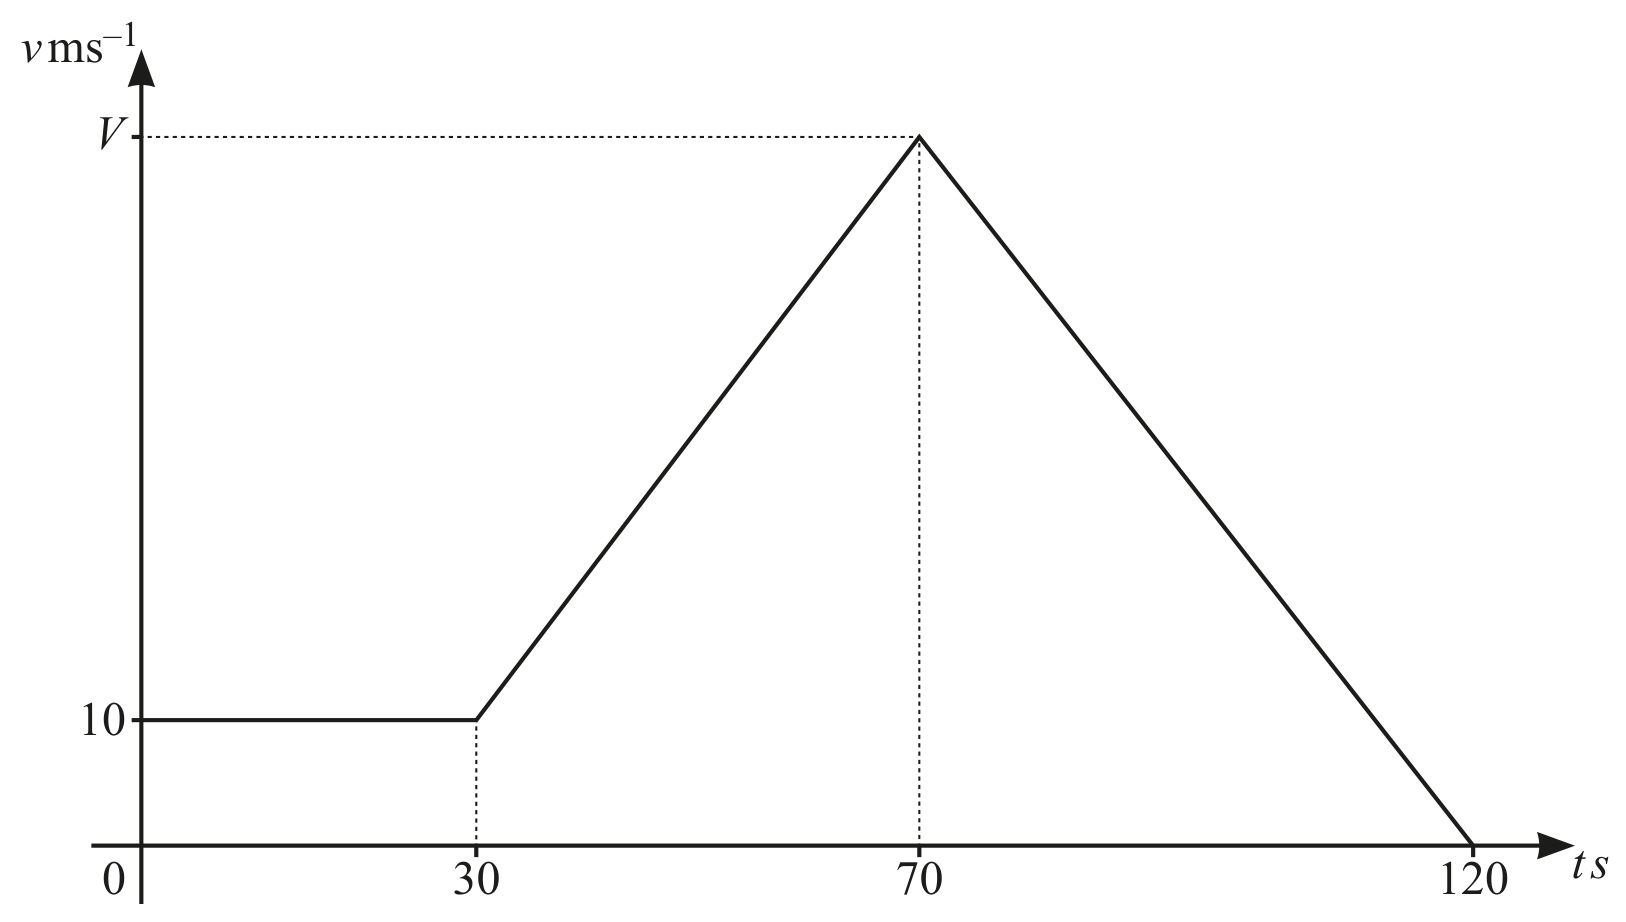
The diagram shows the velocity-time graph for a particle travelling in a straight line with velocity, Vms1\mathrm{Vms}^{-1}, at time t seconds. When t=30 the velocity of the particle is Vms1\mathrm{Vms}^{-1}. The particle travels 800 metres in 45 seconds.

Question 4(a)

(a)

Find the value of V.

[ 2 ]

Question 4(b)

(b)

Find the acceleration of the particle when t=35.

[ 2 ]

Question 6

[Maximum number: 4]

In this question all distances are in metres and all times are in seconds.

Question 6(a)

(a)
Question image
[ 4 ]

Question 6(a)(i)

(i)

The diagram shows the velocity-time ( v-t ) graph of a particle travelling in a straight line. The particle travels a distance of 2750 m in 120 s. Find the velocity, V, of the particle when t=70.

[ 2 ]

Question 6(a)(ii)

(ii)

Find the acceleration of the particle for 70<t<120.

[ 2 ]

Question 9(b)

[Maximum number: 5]

In this question, all lengths are in metres, and time, t, is in seconds.
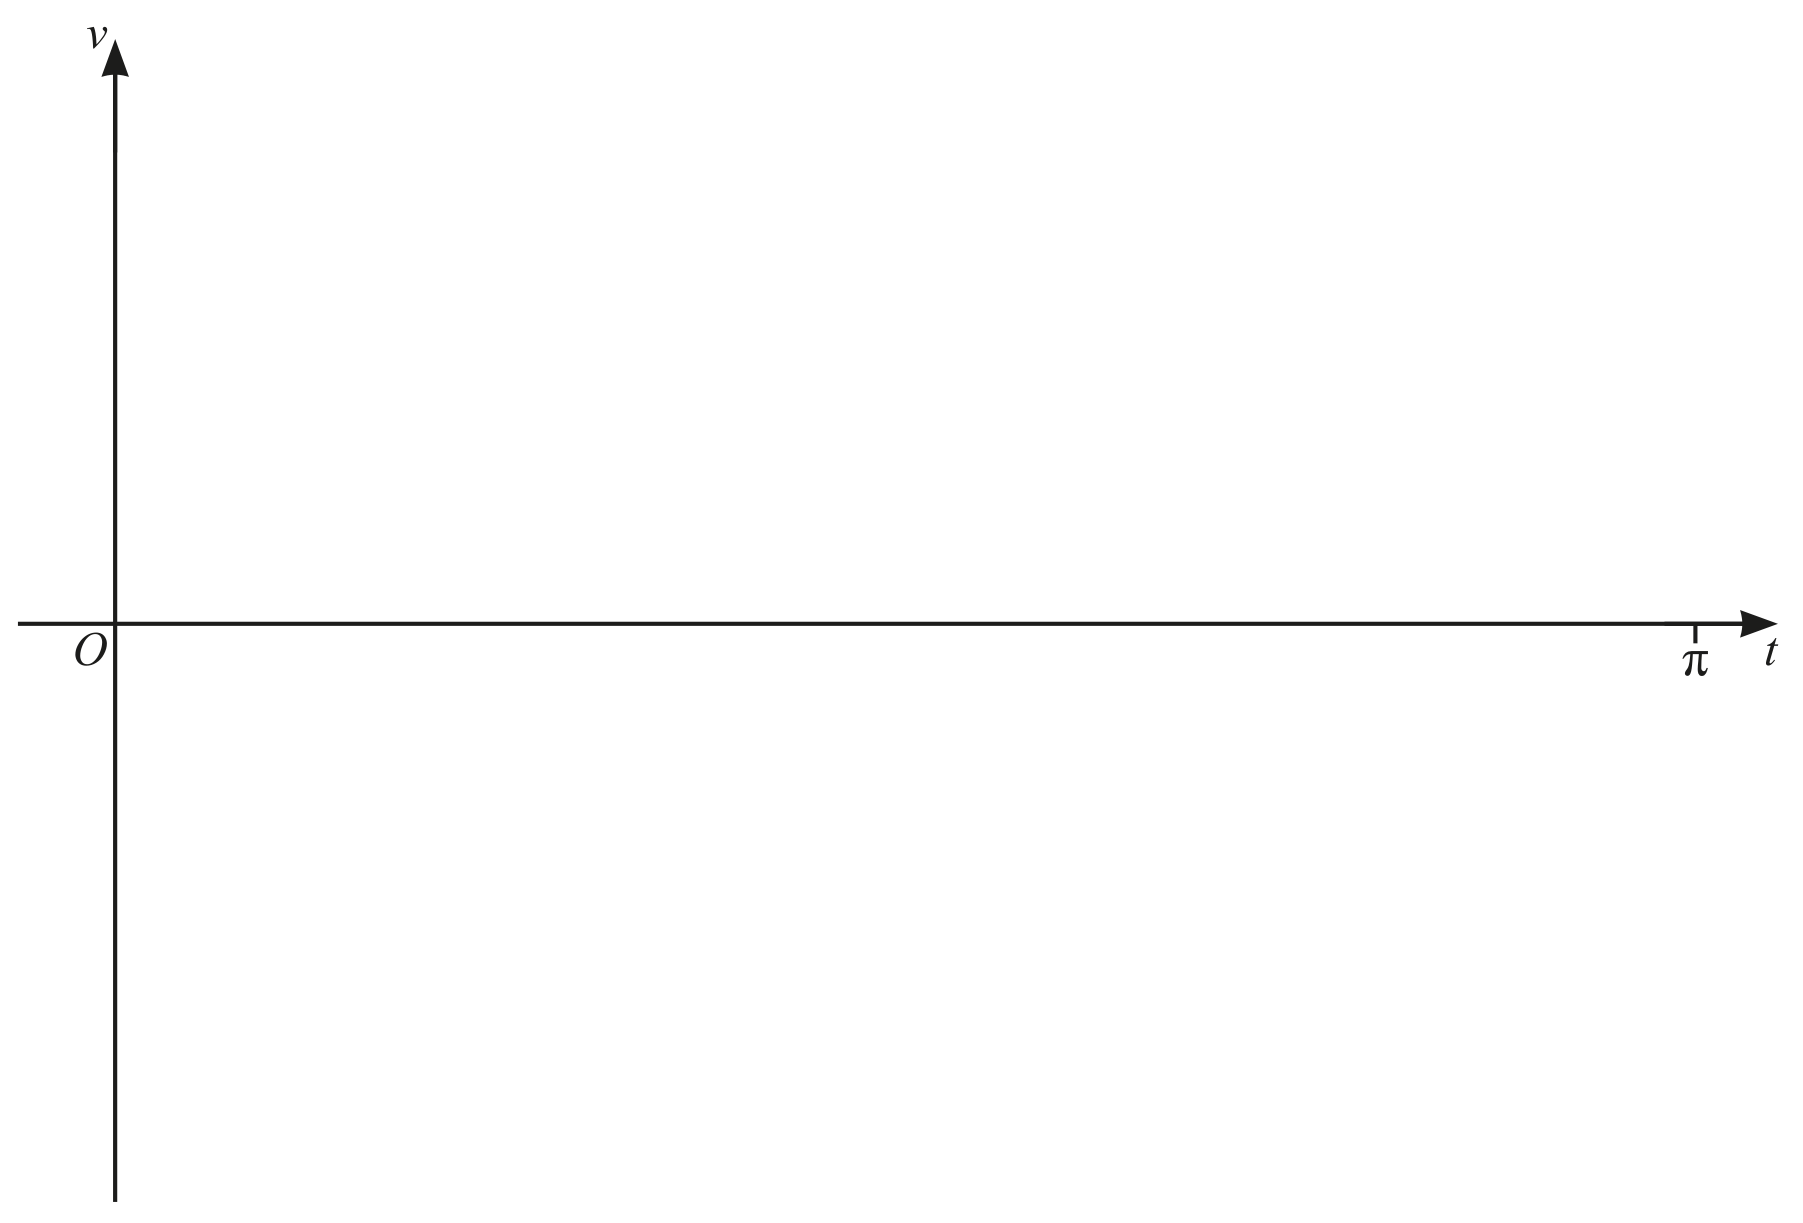
A particle P moves in a straight line such that, t seconds after leaving a fixed point O, its displacement, s, is given by s=4t4cos2t+4s=4 t-4 \cos 2 t+4.

On the axes, sketch the velocity-time graph for P for 0tπ0 \leqslant t \leqslant \pi, stating the intercepts with the axes in exact form.

Question image

Question 7

Question 7(a)

(a)

In this question, all lengths are in metres and time, t , is in seconds.

Question image

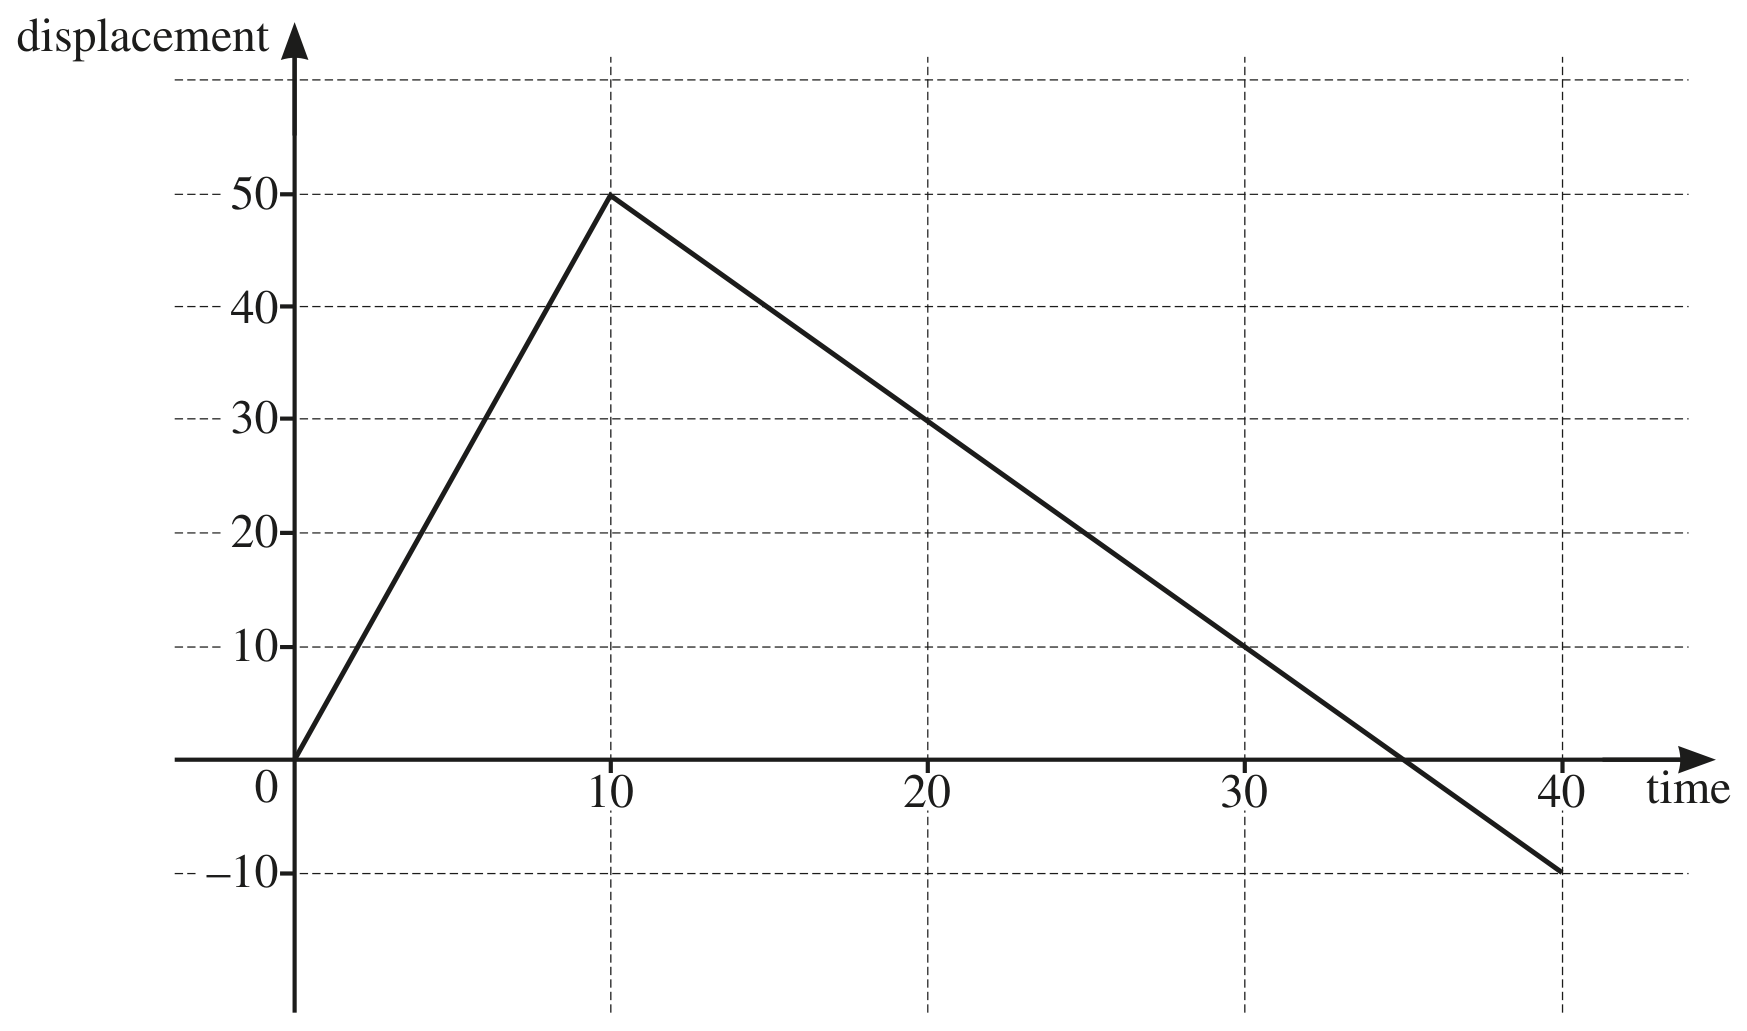
The diagram shows the displacement-time graph for a runner, for 0t400 \leqslant t \leqslant 40.

[ 3 ]

Question 7(a)(i)

(i)

Find the distance the runner has travelled when t=40.

[ 1 ]

Question 7(a)(ii)

(ii)

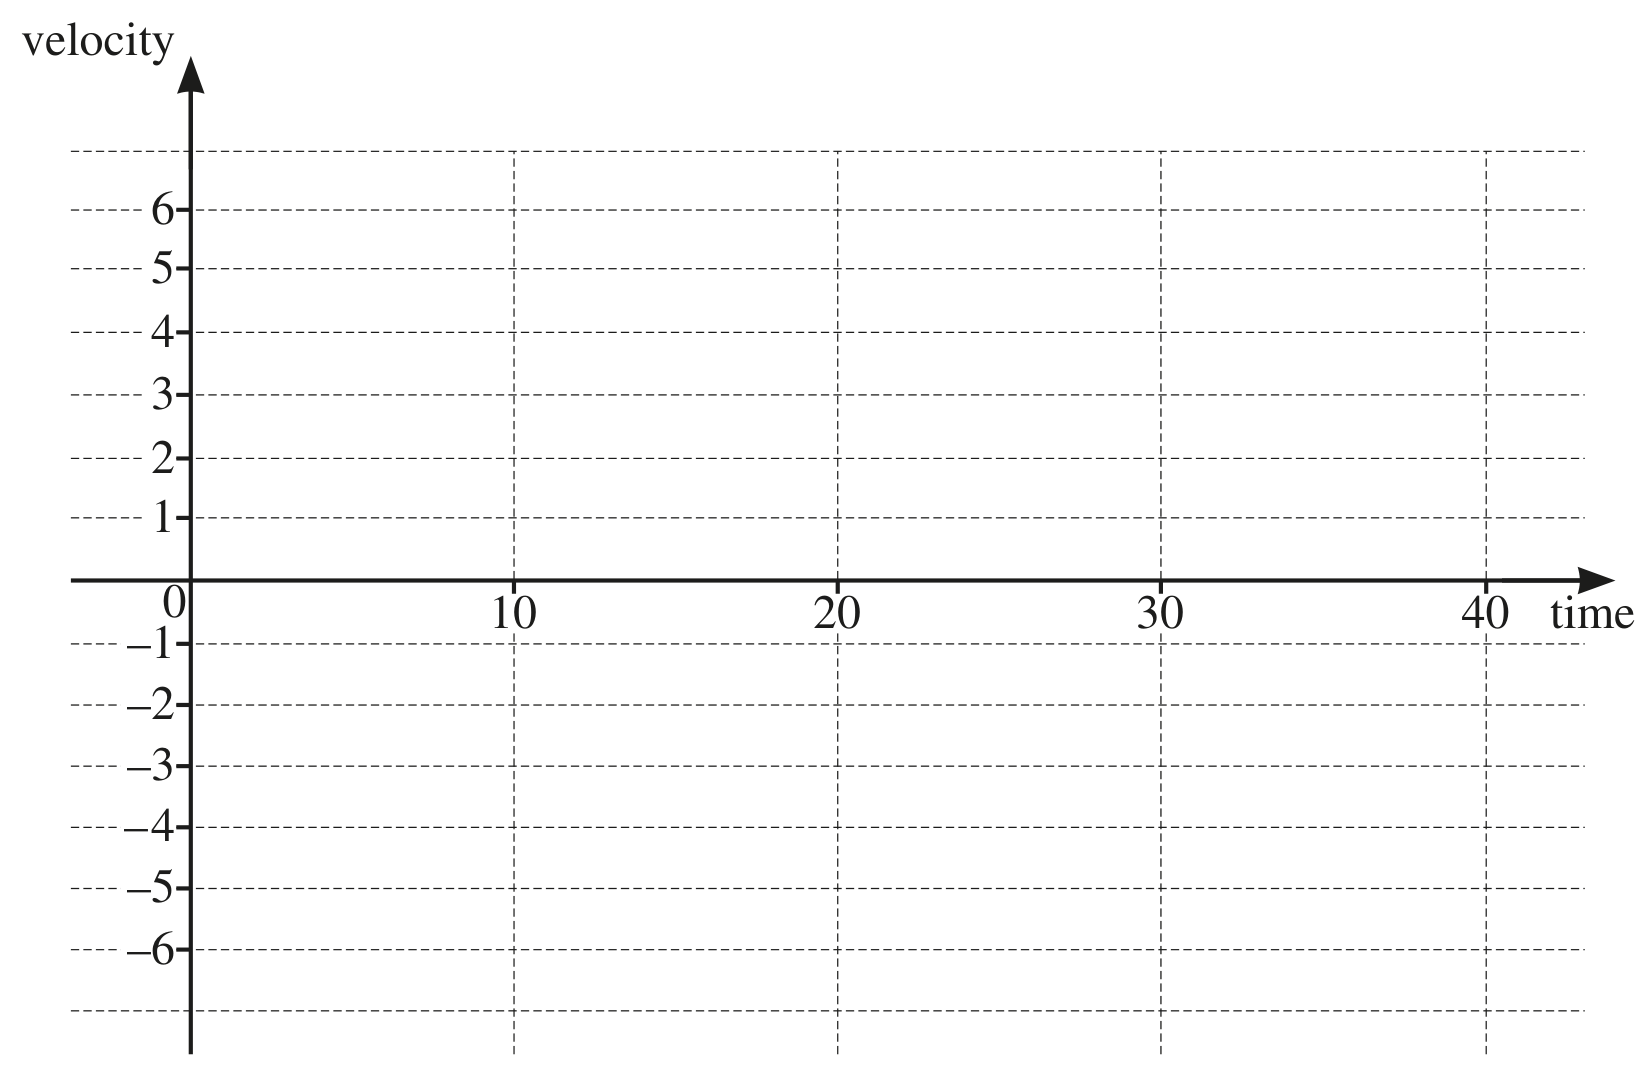
On the axes, draw the corresponding velocity-time graph for the runner, for 0t400 \leqslant t \leqslant 40.

Question image
[ 2 ]

Question 9

[Maximum number: 6]

In this question time is measured in seconds.

Question 9(a)

(a)

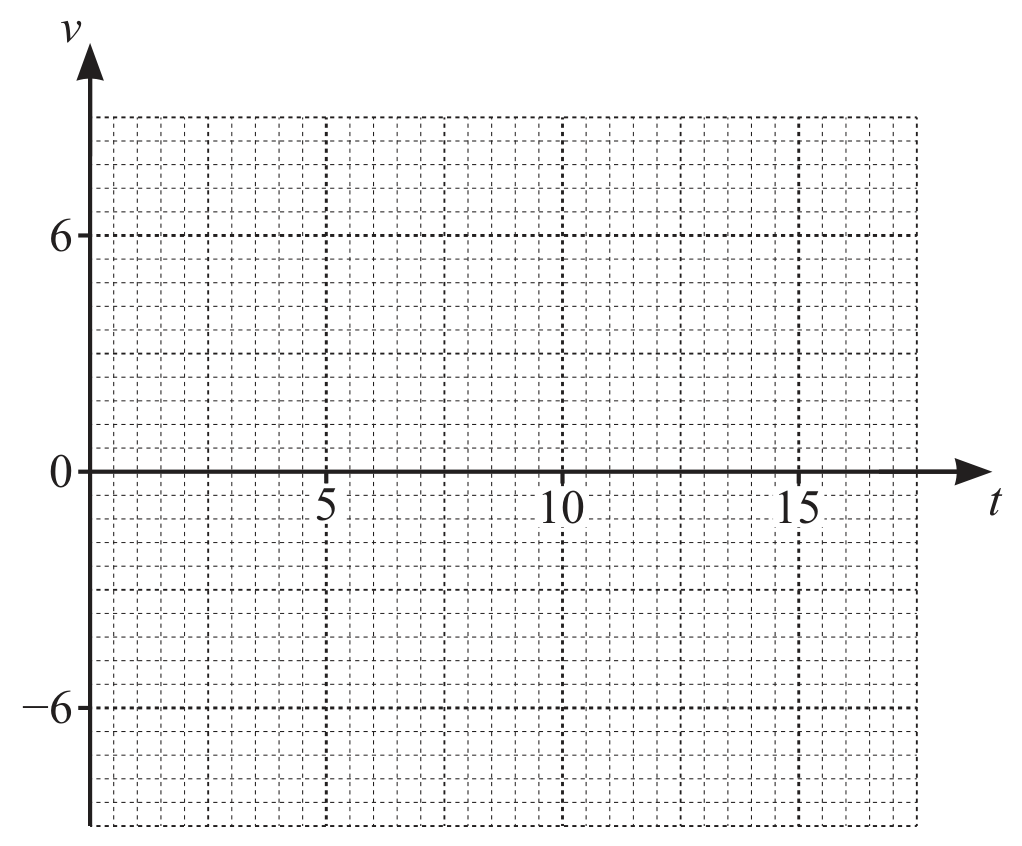
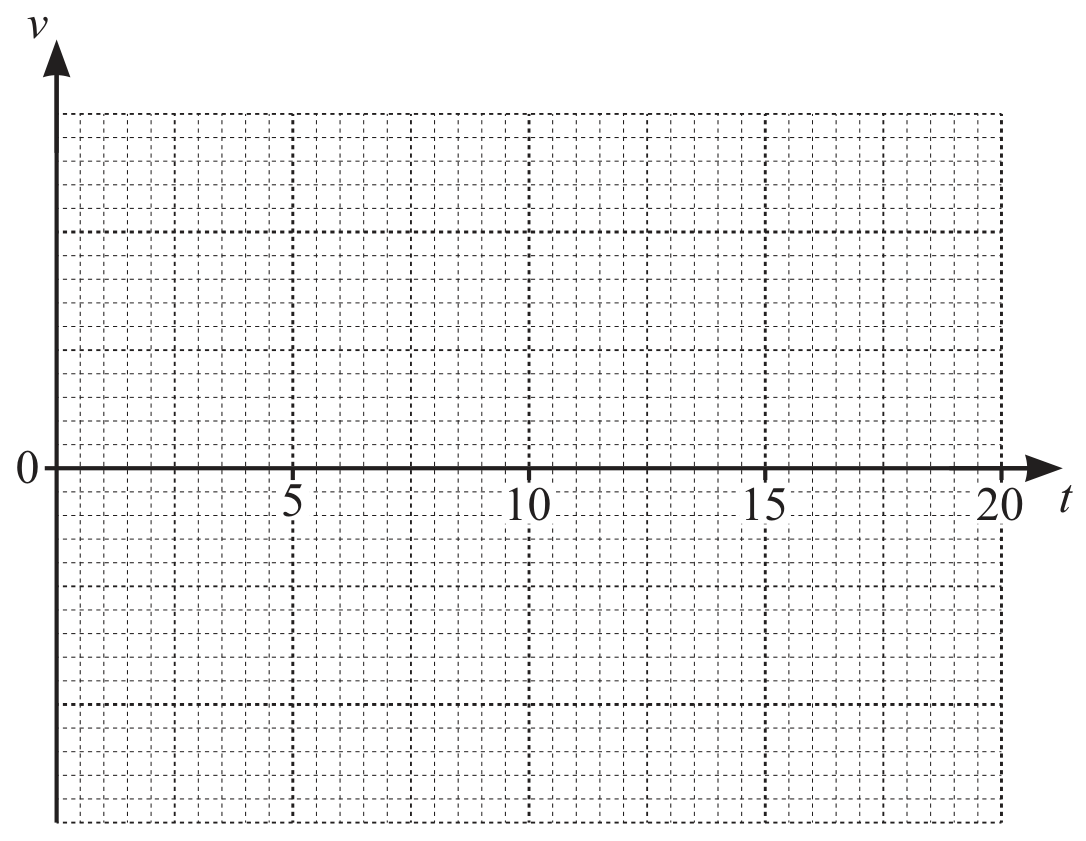
A particle is moving in a straight line with constant velocity of 6 ms16 \mathrm{~ms}^{-1}. At time t=0, it passes a fixed point A. At time t=5 it suddenly changes direction and moves with a different constant velocity along the same straight line. It passes the point A again at time t=15. Sketch the velocity-time graph for the motion.

Question image
[ 3 ]

Question 9(b)

(b)

Another particle is moving in a straight line with constant acceleration. At time t=0 it passes a fixed point B with velocity 8 ms1-8 \mathrm{~ms}^{-1}. It passes the point B again at time t=20. Sketch the velocity-time graph for the motion.

Question image
[ 3 ]

Question 9

[Maximum number: 3]

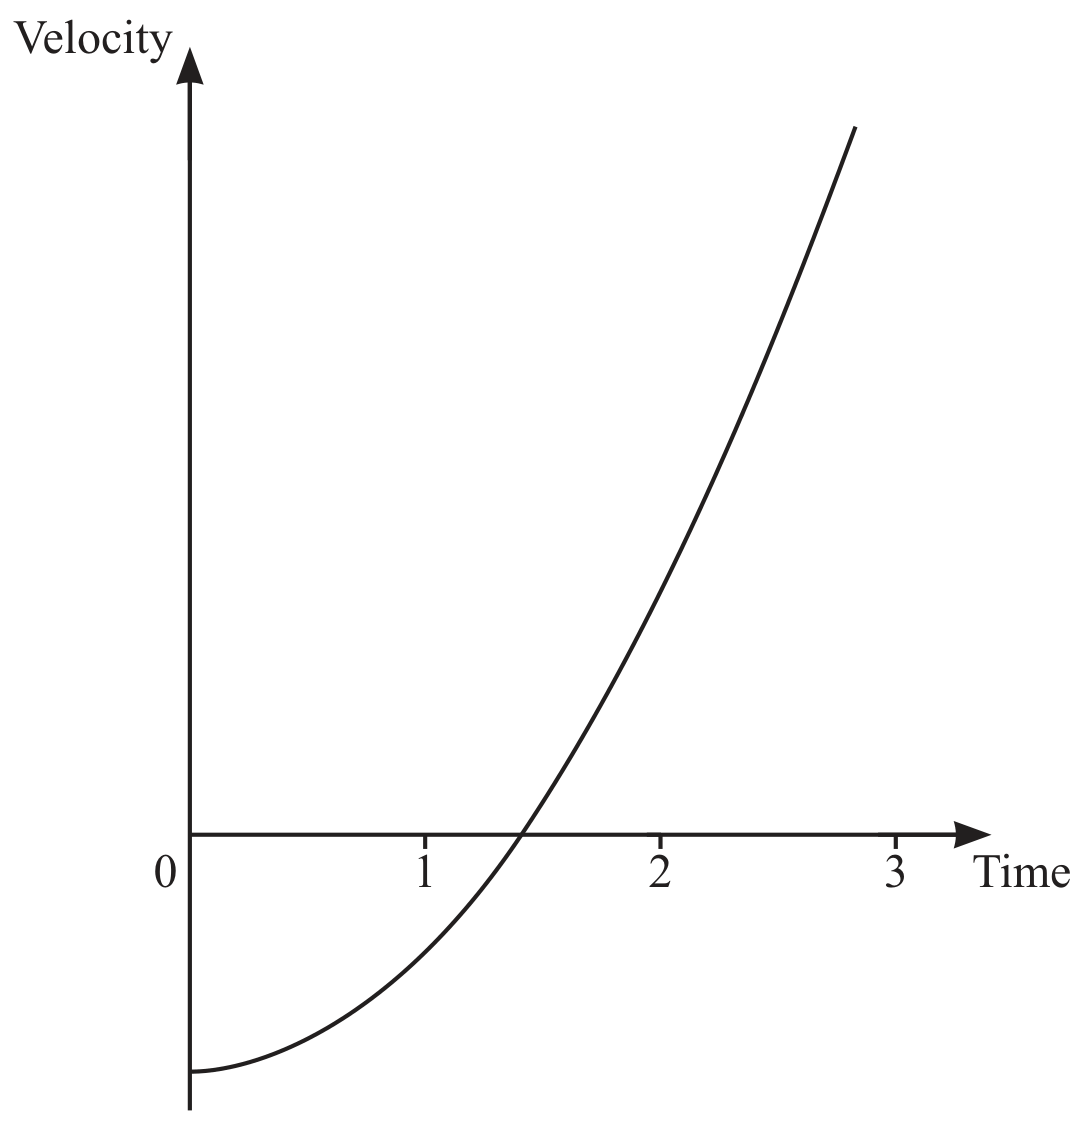
The diagram shows the velocity-time graph for a particle moving in a straight line.

Question image

Question 9(a)

(a)

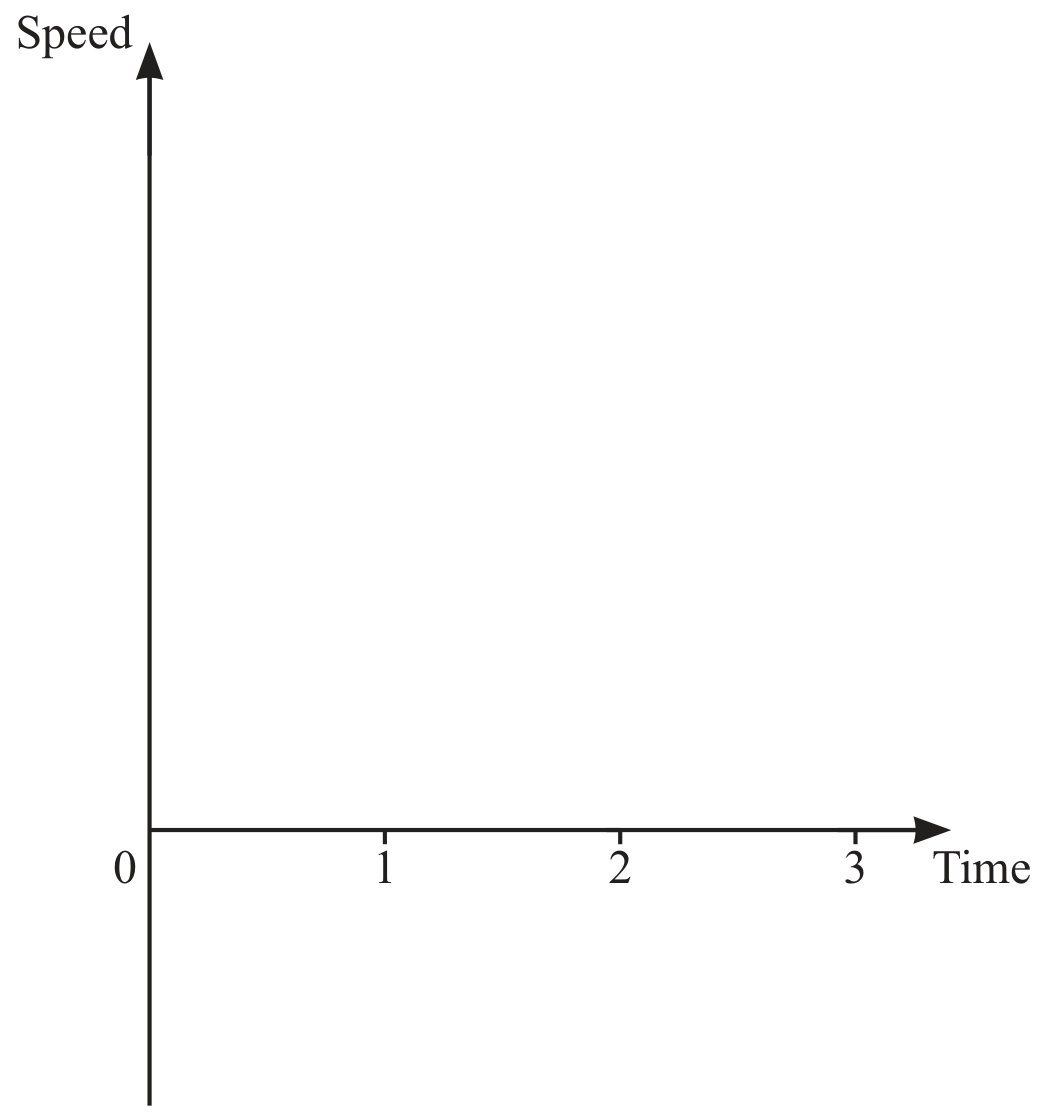
On the diagram below, sketch the speed-time graph for the motion of this particle.

Question image

It is given that the velocity-time graph is part of a quadratic curve.
The curve has gradient 0 when time is 0 .

[ 1 ]

Question 9(b)

(b)

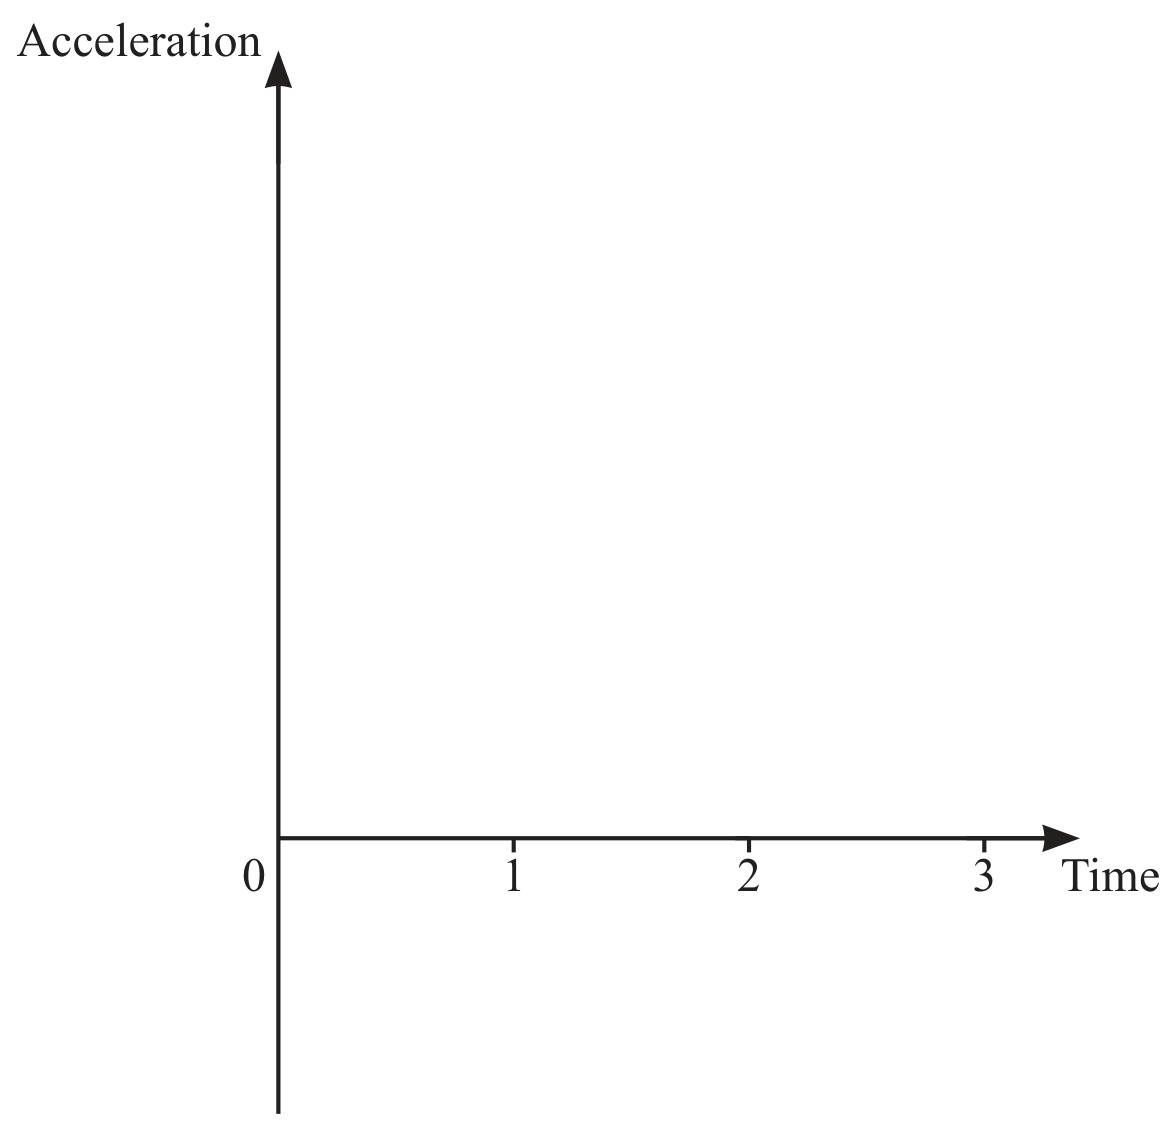
On the diagram below sketch a possible acceleration-time graph for the motion of the particle. [2]

Question image
[ 2 ]

Question 11(a)

[Maximum number: 4]

A particle P moves in a straight line and passes through a fixed point O.
At time t seconds, its displacement from O, s metres, is given by

s=t+6t2t3 for 0t3s=12t13t23 for 3tk where k is a constant. \begin{array}{ll} s=t+6 t^{2}-t^{3} & \text { for } 0 \leqslant t \leqslant 3 \\ s=12 t-\frac{1}{3} t^{2}-3 & \text { for } 3 \leqslant t \leqslant k \quad \text { where } k \text { is a constant. } \end{array}

It is given that, for 3tk3 \leqslant t \leqslant k, the velocity of P is positive and its acceleration is negative.

The maximum velocity of P occurs when t=2.

On the axes below, sketch a velocity-time graph for the first k seconds of the motion of P.

Question image

Question 9

[Maximum number: 7]

In this question lengths are in centimetres and time is in seconds.
A particle P moves in a straight line such that its displacement S , from a fixed point at a time t is given by s=3(t+2)(t4)2s=3(t+2)(t-4)^{2} for 0t50 \leqslant \mathrm{t} \leqslant 5.

Question 9(b)

(a)

On the axes below, sketch the displacement-time graph of P , stating the intercepts with the axes.

Question image
[ 3 ]

Question 9(c)

(b)

On the axes below, sketch the velocity-time graph of P , stating the intercepts with the axes.

Question image
[ 2 ]

Question 9(d)(ii)

(c)

Hence, on the axes below, sketch the acceleration-time graph of P , stating the intercepts with the axes.

Question image
[ 2 ]

Question 11

[Maximum number: 6]

In this question all lengths are in kilometres and time is in hours.
A particle P moves in a straight line such that its displacement, s , from a fixed point at time tis given by s=(t+2)(t5)2s=(t+2)(t-5)^{2}, for t0t \geqslant 0.

Question 11(b)

(a)

On the axes, draw the displacement-time graph for P for 0t60 \leqslant \mathrm{t} \leqslant 6, stating the coordinates of the points where the graph meets the coordinate axes.

Question image
[ 2 ]

Question 11(c)

(b)

On the axes below, draw the velocity-time graph for P for 0t60 \leqslant \mathrm{t} \leqslant 6, stating the coordinates of the points where the graph meets the coordinate axes.

Question image
[ 2 ]

Question 11(d)(ii)

(c)

Hence, on the axes below, draw the acceleration-time graph for P for 0t60 \leqslant \mathrm{t} \leqslant 6, stating the coordinates of the points where the graph meets the coordinate axes.

[ 2 ]
0 selected