Question 1
[Maximum number: 5]
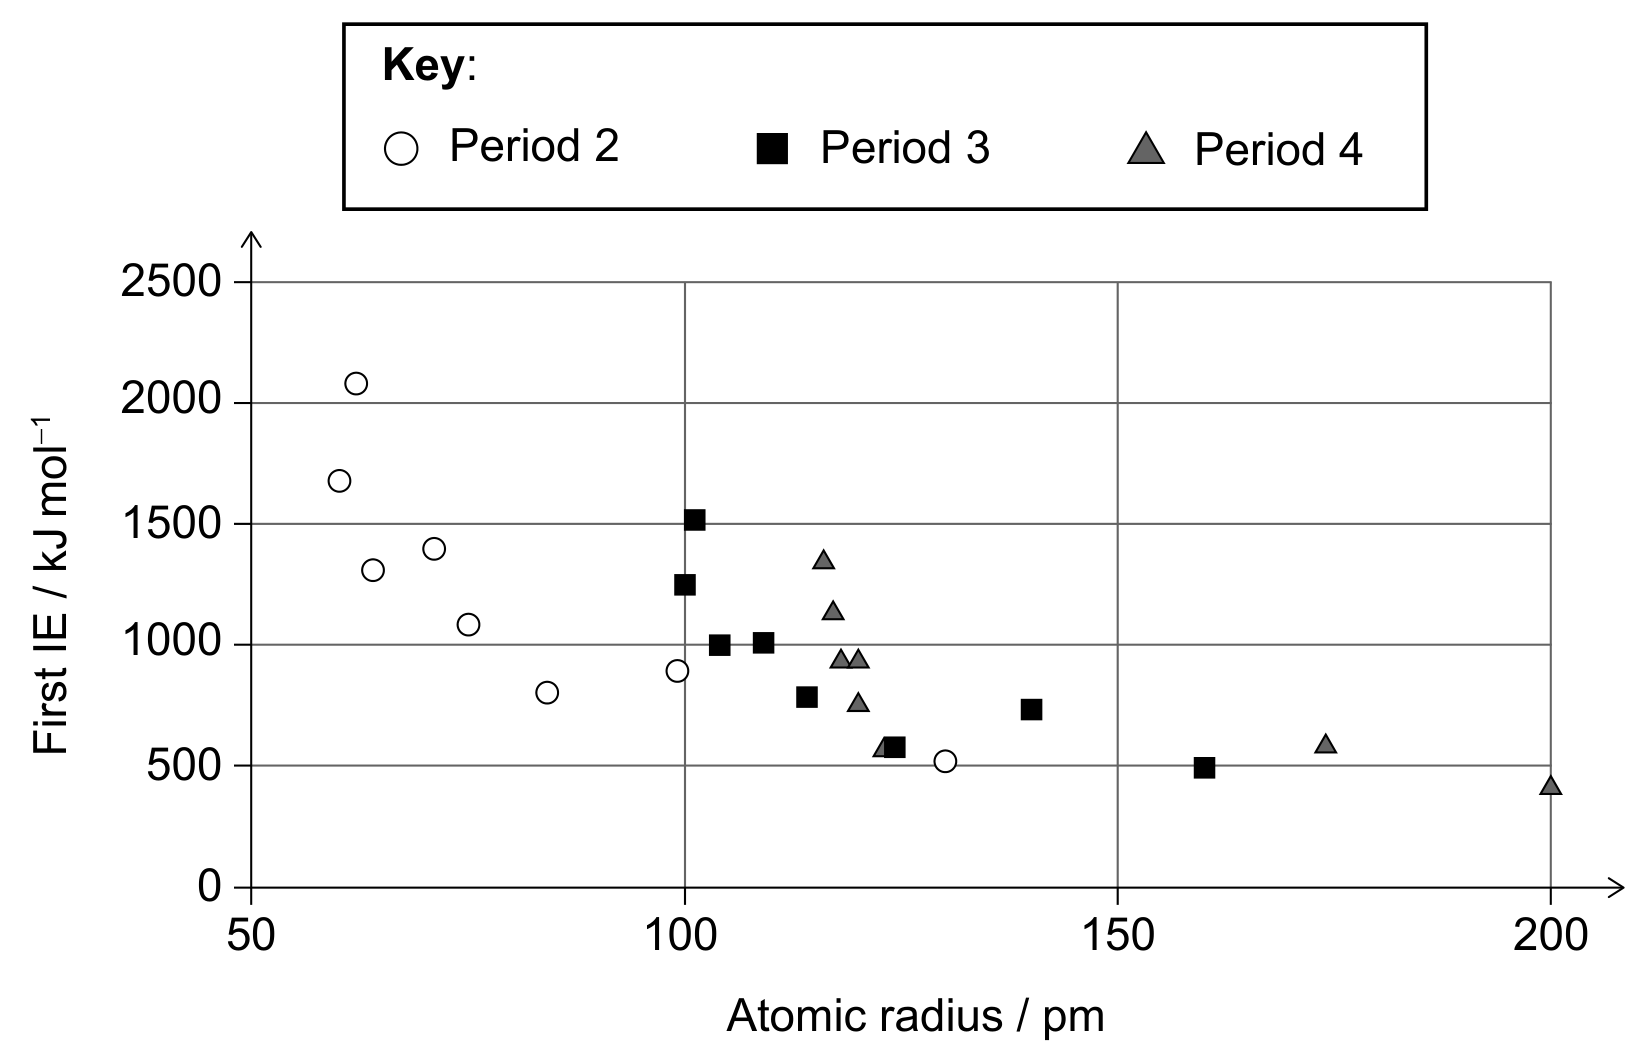
The graph shows the variation of the first ionization energy with atomic radius for periods 2, 3 and 4 of the periodic table, with the d-block elements omitted.
Question 1(a)
(a)
Annotate the graph with an additional data point, marked with a cross ( X ), for scandium. Use sections 9 and 10 of the data booklet.
[ 1 ]
Question 1(b)
(b)
Suggest why there might be a link between the two variables in the graph.
[ 1 ]
Question 1(c)
(c)
The graph shows a relationship between first ionization energy and atomic radius.
[ 3 ]
Question 1(c)(i)
(i)
State the type of relationship between the variables.
[ 1 ]
Question 1(c)(ii)
(ii)
Compare and contrast the trends shown by the different periods.
[ 2 ]