[Maximum number: 7]
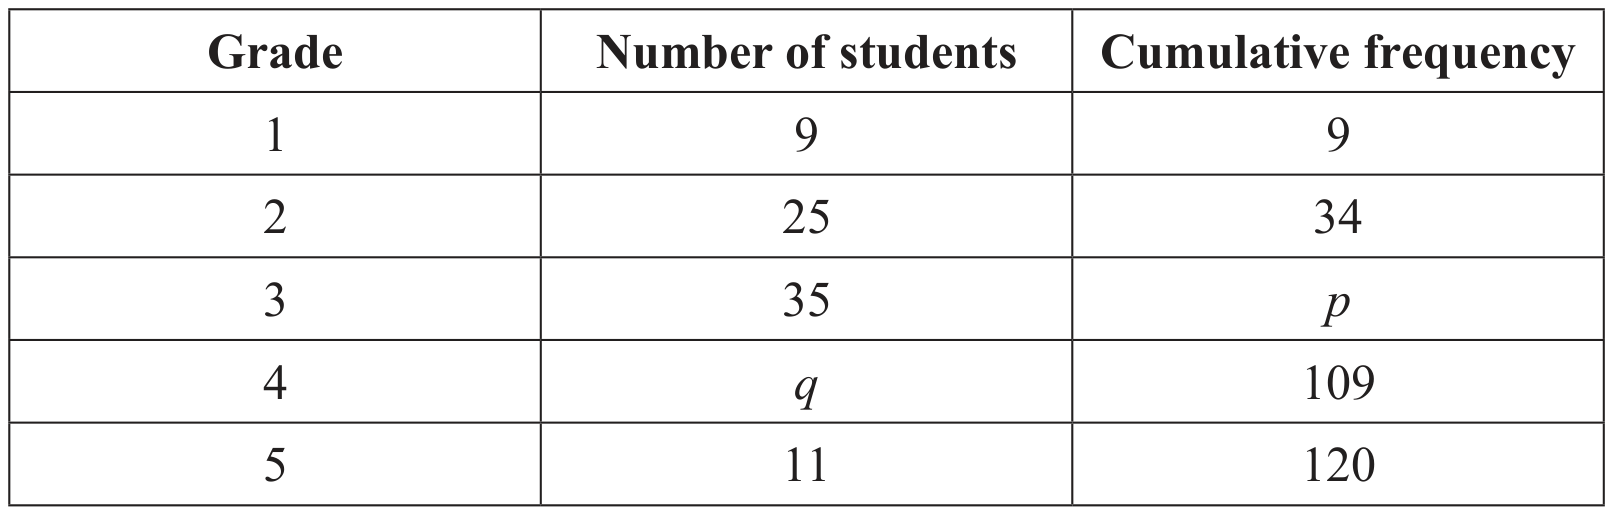
The following table gives the examination grades for 120 students.
(a)
Find the value of
[ 4 ]
(i)
p;
(ii)
q.
[ 4 ]
(b)
Find the mean grade.
[ 2 ]
(c)
Write down the standard deviation.
[ 1 ]
 EduNinja
The following table gives the examination grades for 120 students.
Find the value of
p;
q.
Find the mean grade.
Write down the standard deviation.
1.
A standard die is rolled 36 times. The results are shown in the following table.
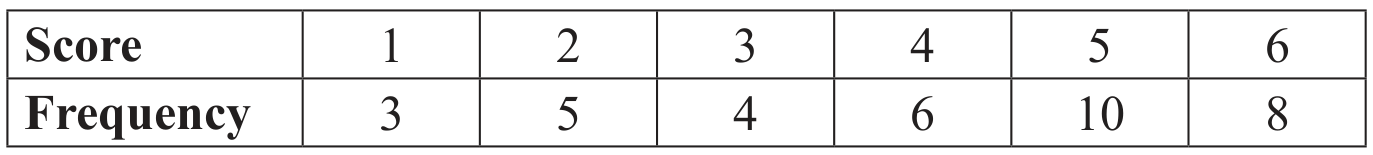
Write down the standard deviation.
Write down the median score.
Find the interquartile range.
The cumulative frequency curve below represents the marks obtained by 100 students.
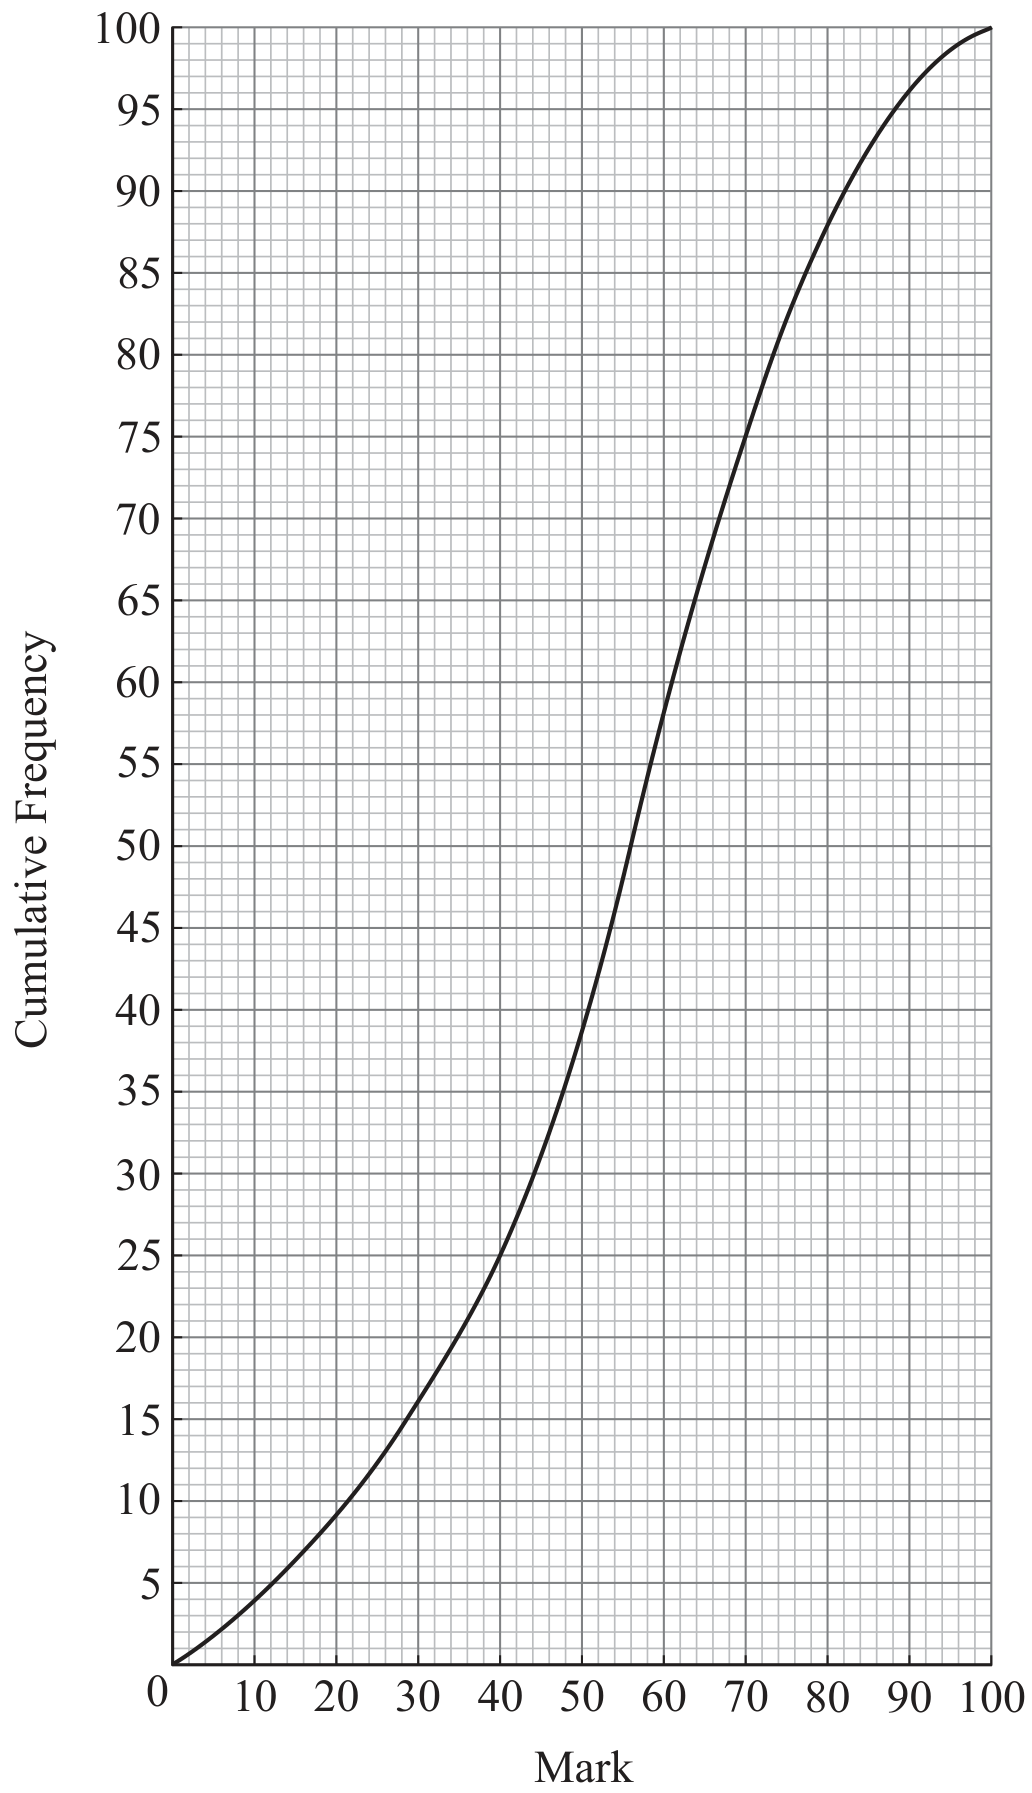
Find the median mark.
Find the interquartile range.
The ages of people attending a music concert are given in the table below.
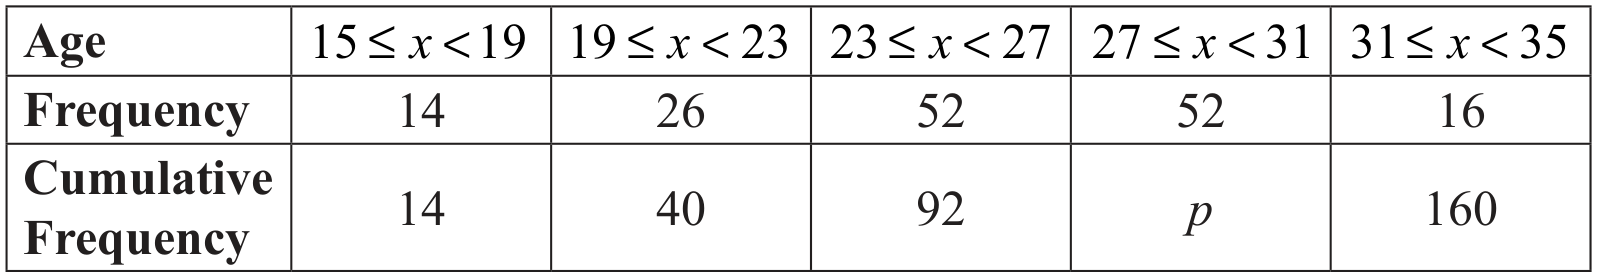
Find p.
The cumulative frequency diagram is given below.
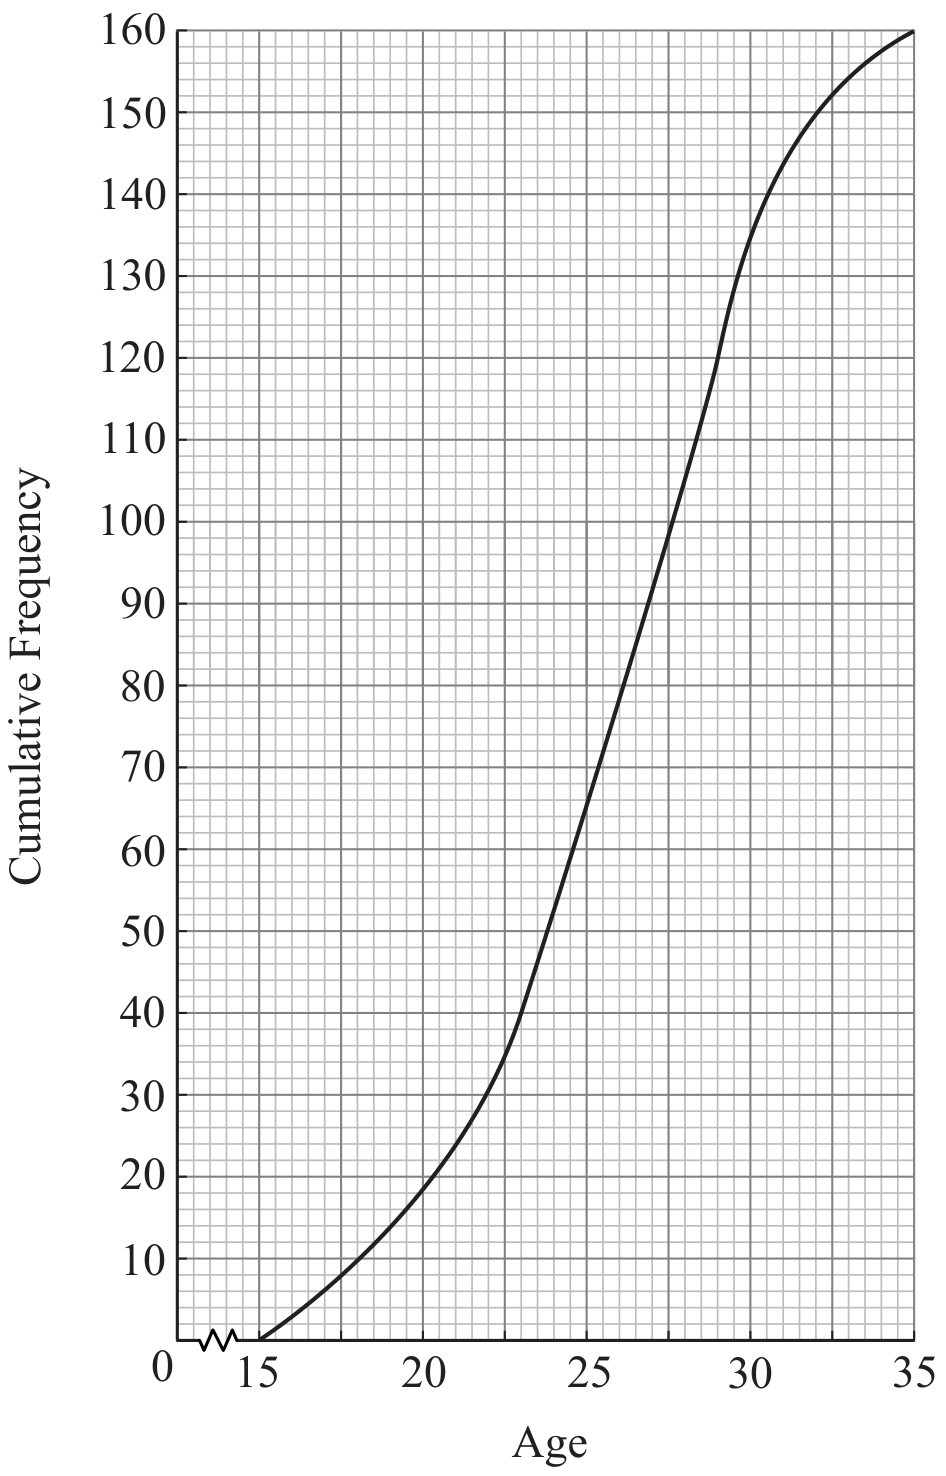
Use the diagram to estimate
the percentile;
the interquartile range.
The following box-and-whisker plot represents the examination scores of a group of students.
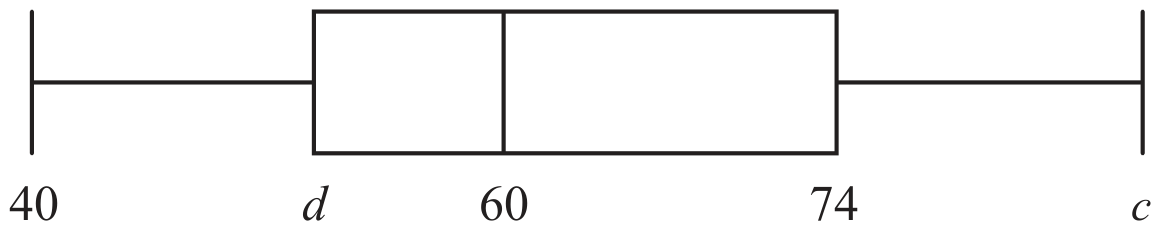
Examination scores
Write down the median score.
The range of the scores is 47 marks, and the interquartile range is 22 marks.
The following table shows the average number of hours per day spent watching television by seven mothers and each mother's youngest child.
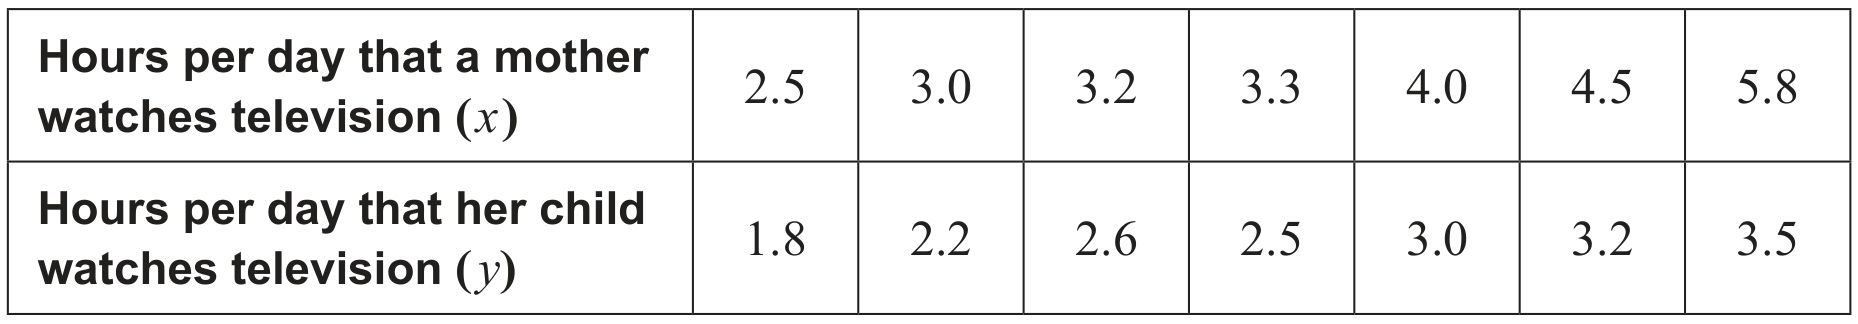
The relationship can be modelled by the regression line with equation y=a x+b.
Find the correlation coefficient.
Write down the value of a and of b.
Elizabeth watches television for an average of 3.7 hours per day.
Use your regression line to predict the average number of hours of television watched per day by Elizabeth's youngest child. Give your answer correct to one decimal place.
A bag contains eight marbles. Three marbles are red and five are blue. Two marbles are drawn from the bag without replacement.
Write down the probability that the first marble drawn is red.
Complete the following tree diagram.
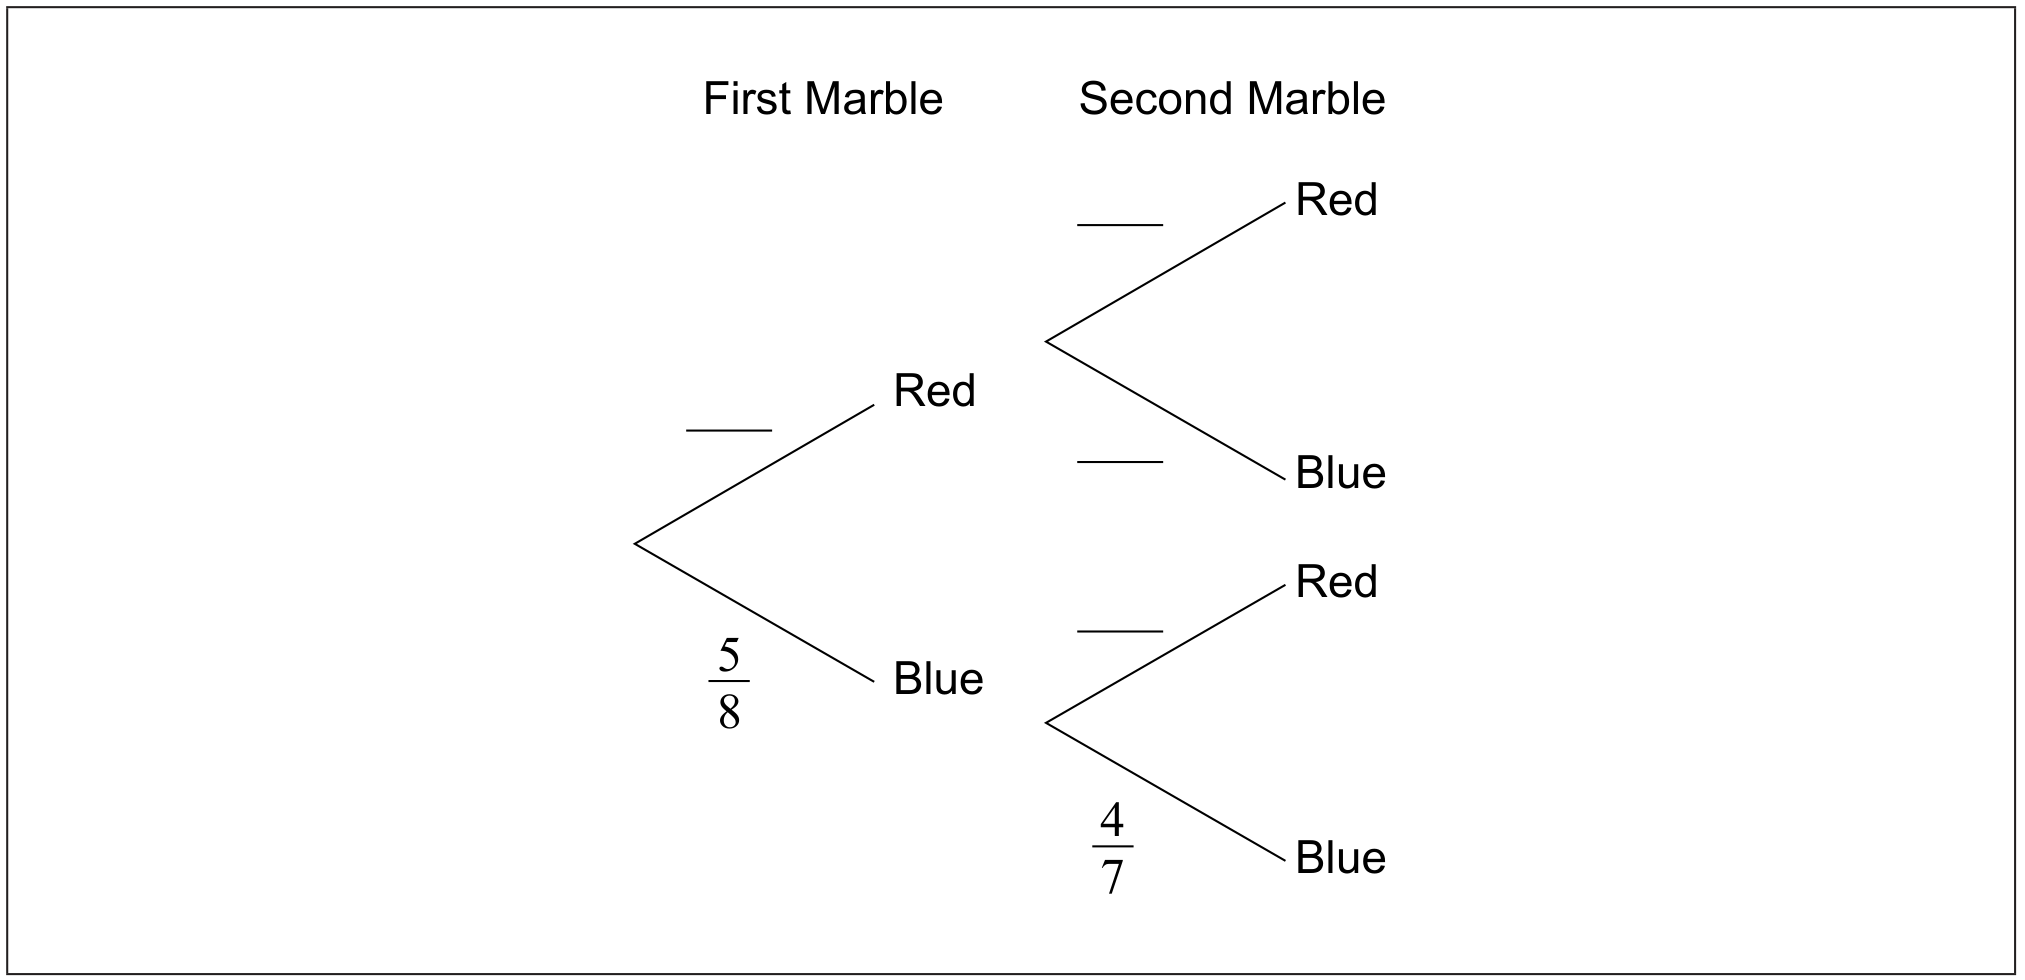
Find the probability that both marbles are blue.
A discrete random variable X has the following probability distribution.
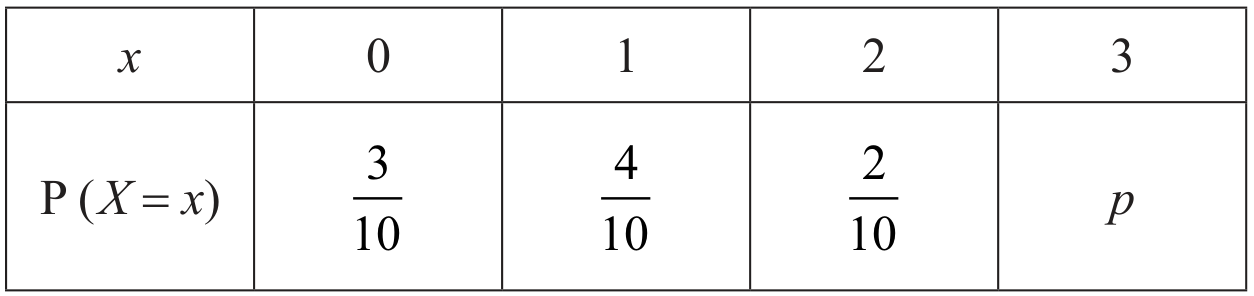
Find p.
Find E(X).
A random variable X is distributed normally with a mean of 20 and standard deviation of 4 .
On the following diagram, shade the region representing .
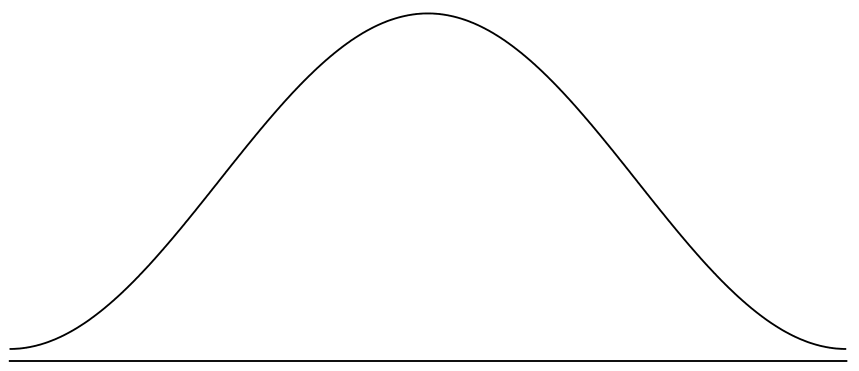
Write down , correct to two decimal places.
Let . Write down the value of c.
A bag contains 5 green balls and 3 white balls. Two balls are selected at random without replacement.
Complete the following tree diagram.
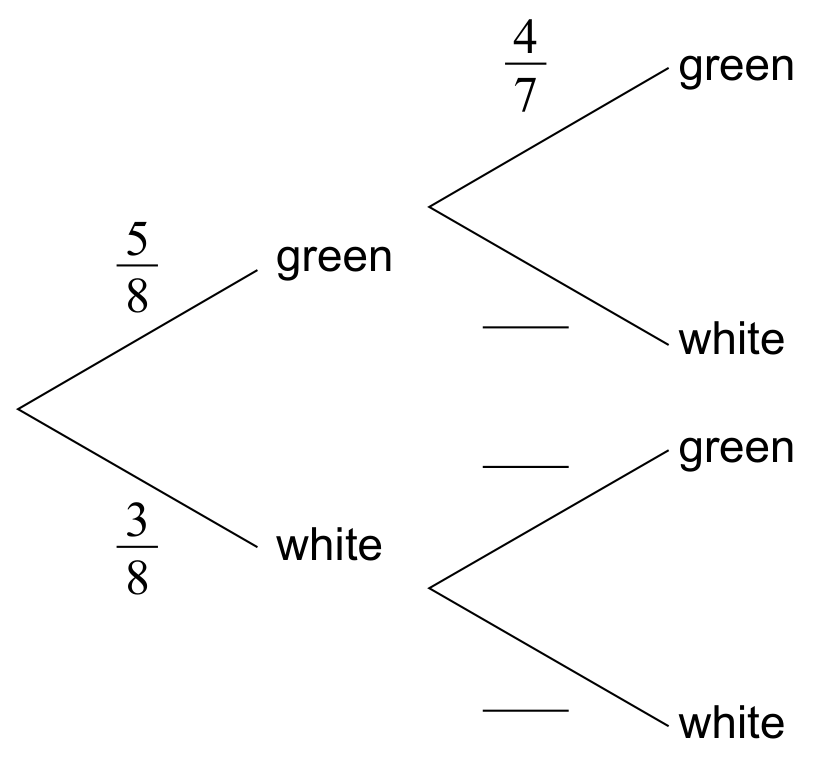
Find the probability that exactly one of the selected balls is green.