Question 1
[Maximum number: 1]
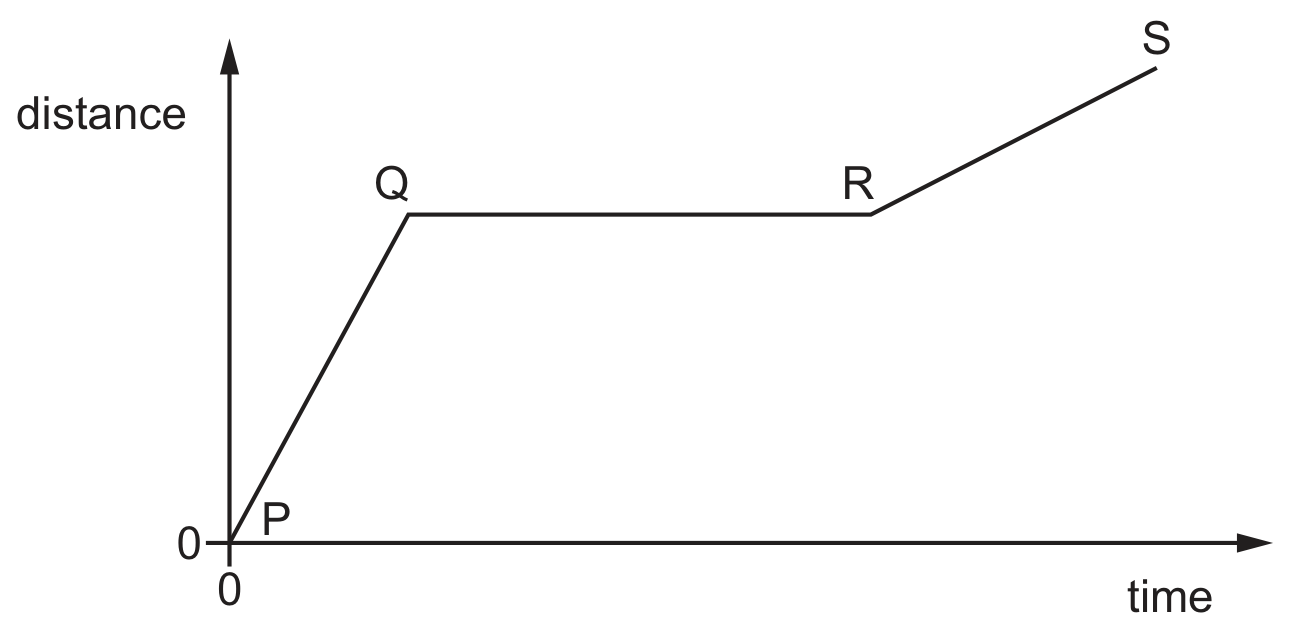
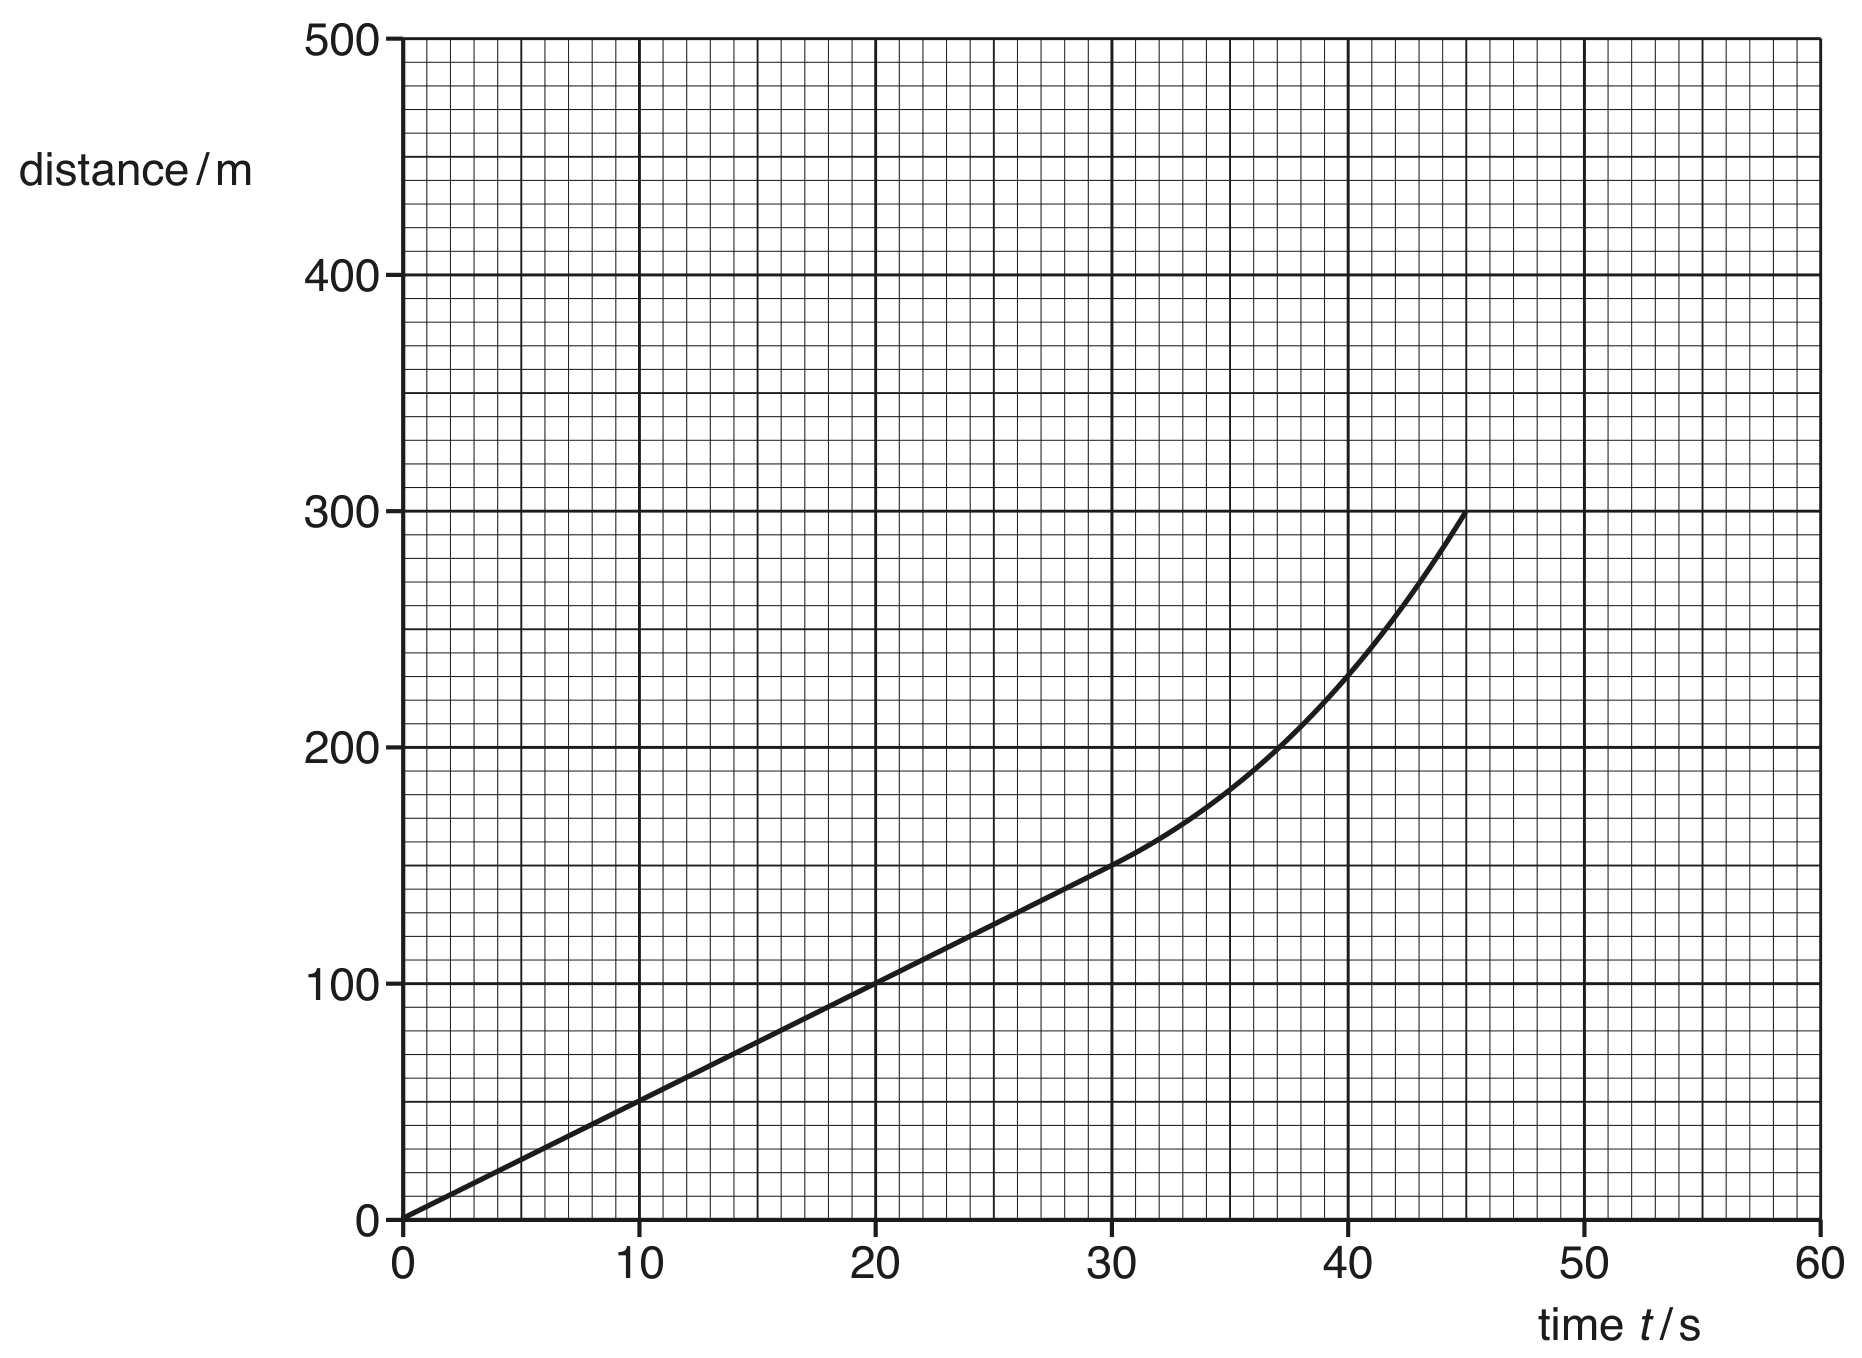
The graph shows how the distance travelled by a vehicle changes with time.

Which row describes the speed of the vehicle in each section of the graph?
P to Q
Q to R
R to S
constant
zero
constant
constant
zero
decreasing
increasing
constant
decreasing
increasing
zero
constant