CAIE IGCSE Mathematics Core sets and Venn diagrams
Practise interpreting two-set Venn diagrams and notation so each element, count or shaded region matches the set description.
- Syllabus
- 2028–2030
- Objective
- C1.2.1
- Level
- Core
Practise interpreting two-set Venn diagrams and notation so each element, count or shaded region matches the set description.
The Venn diagram shows information about the number of students in a class who like apples ( A ) and bananas ( B ).
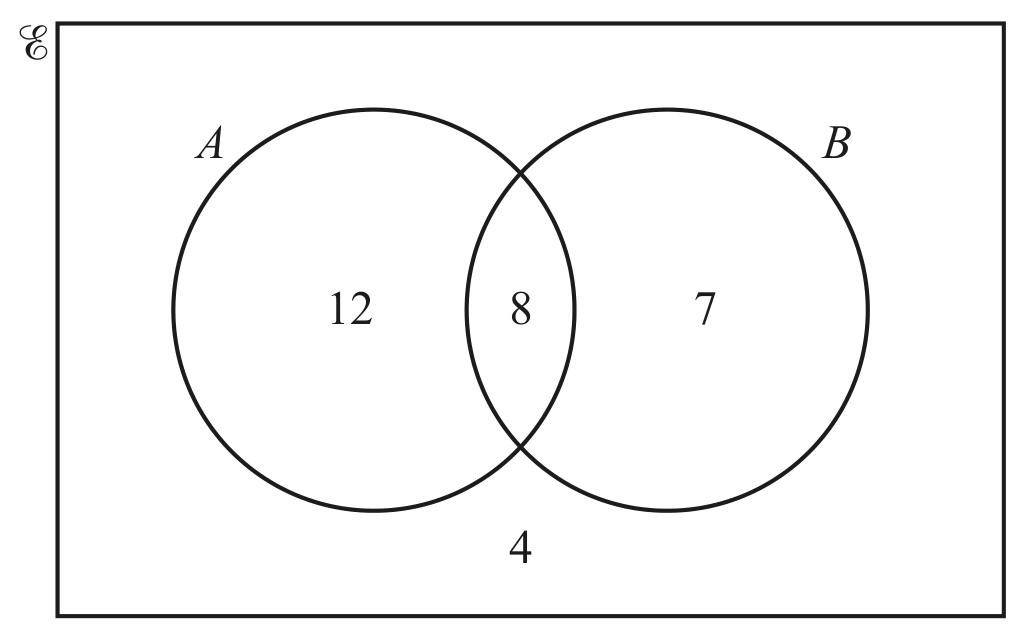
Work out the number of students who like bananas.