EduNinja

IGCSE Biology3.2 OsmosisQuestion Bank

Question 1

[Maximum number: 5]

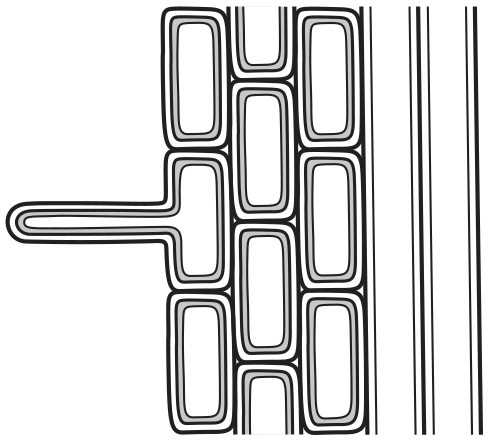
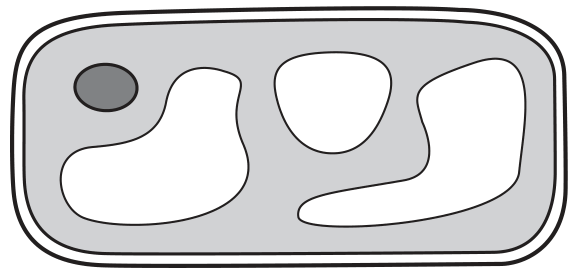
Fig. 1.1 is a diagram of an animal cell.
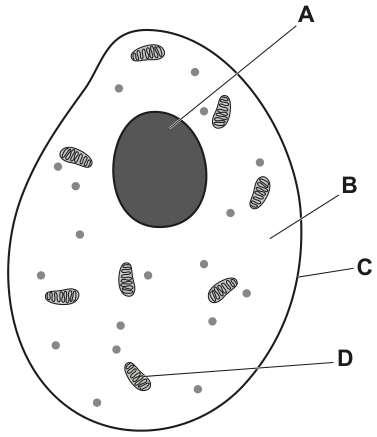
Fig. 1.1

Fig. 1.1

Question 1(b)

Question 1(b)(i)

(a)
(i)

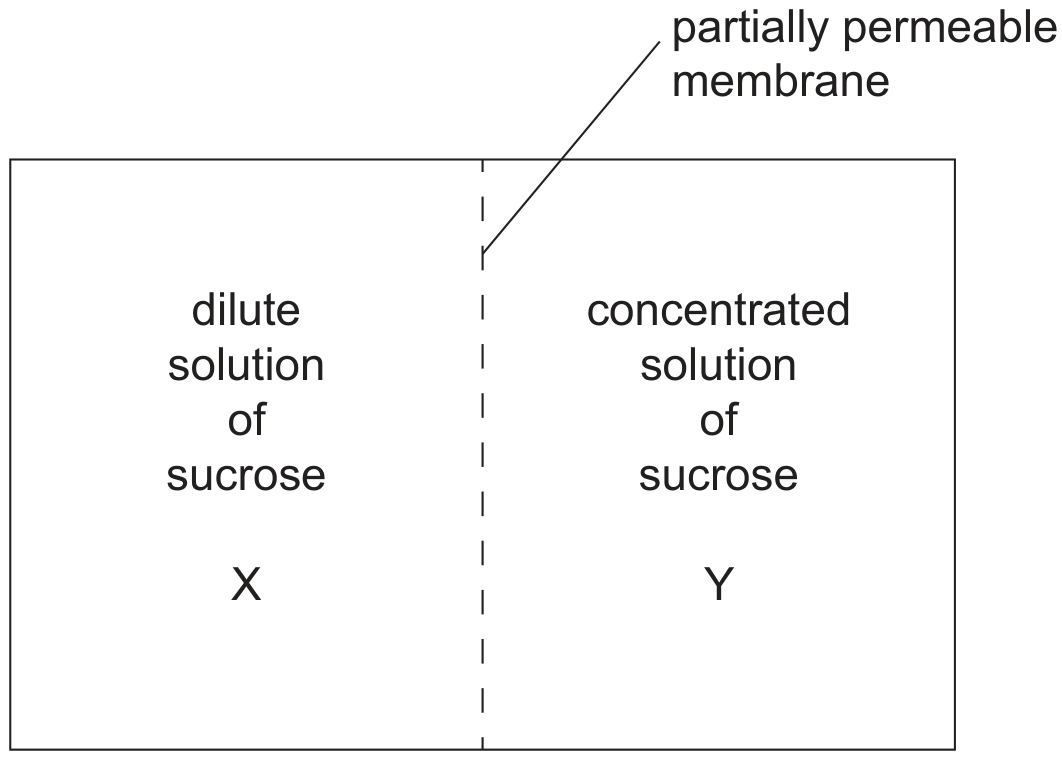
Explain how water moves into and out of animal cells.

[ 3 ]

Question 1(b)(ii)

(ii)

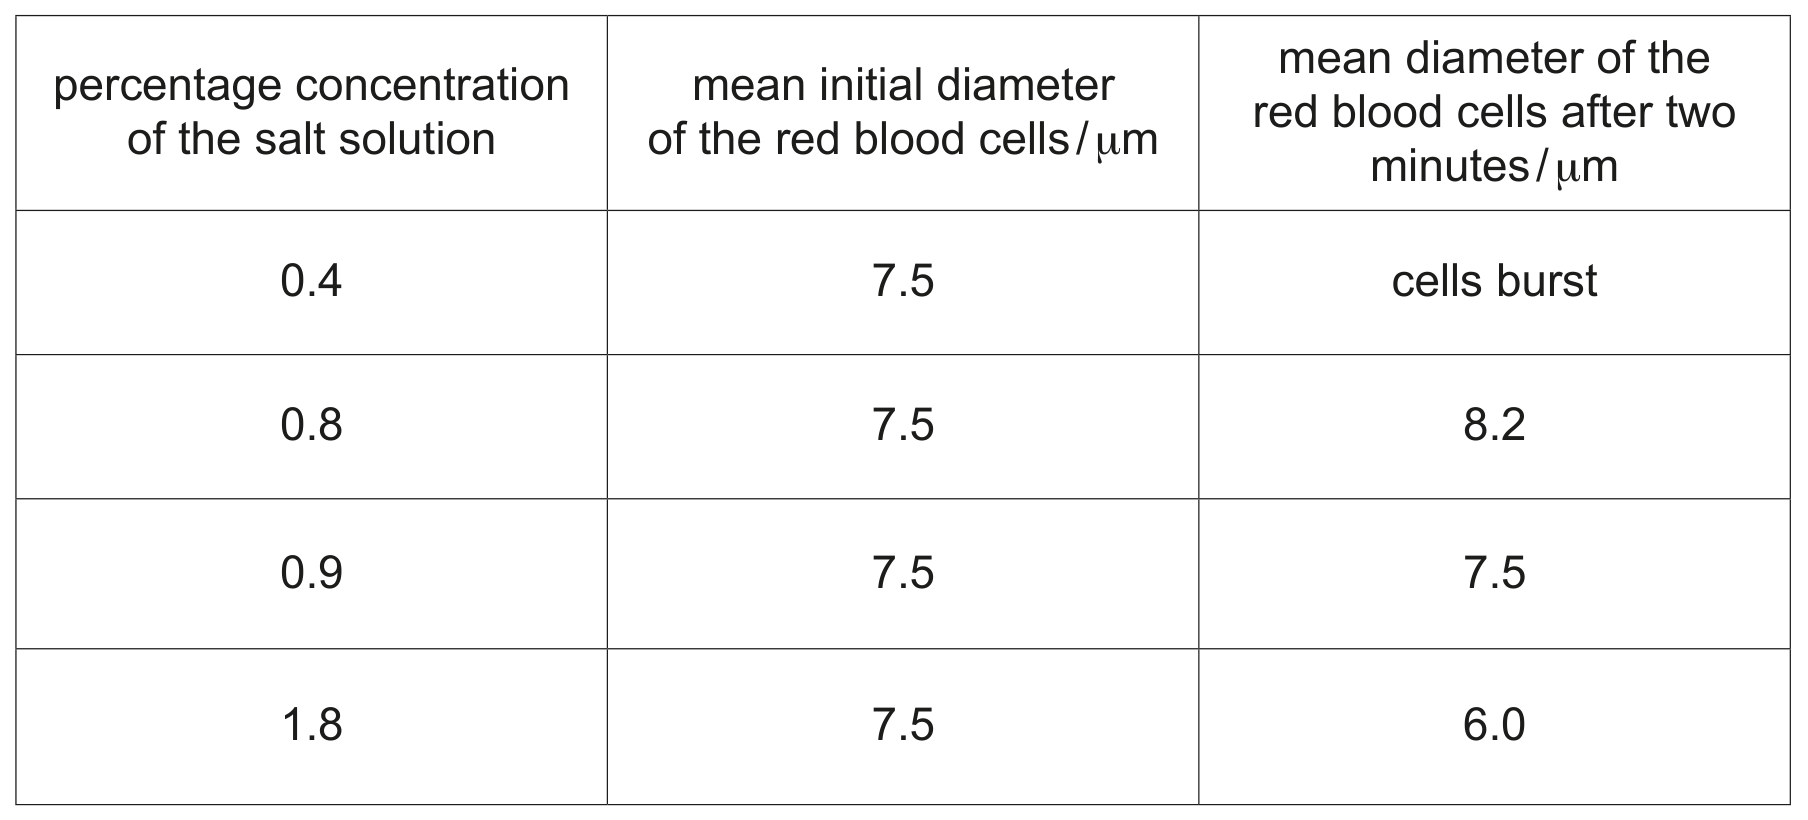
A sample of red blood cells was taken from a person. The red blood cells were put into three test-tubes. Each test-tube contained a different liquid:
- blood plasma
- pure water
- a very concentrated salt solution.

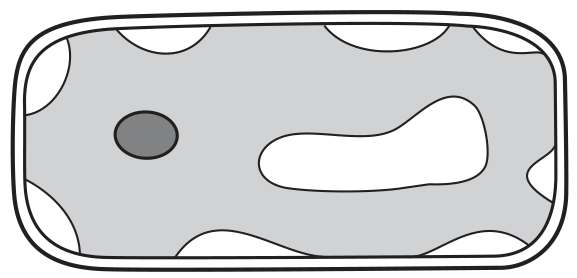
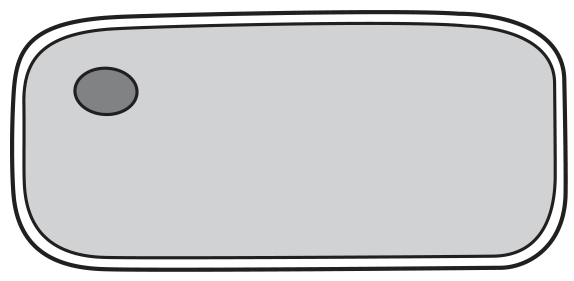
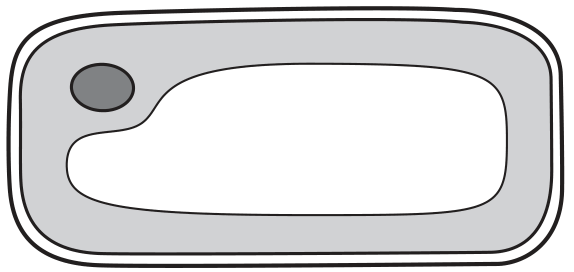
Fig. 1.2 shows the appearance of the red blood cells when examined using a microscope. Identify the liquids the red blood cells were immersed in.

Write your answers in the spaces provided in Fig. 1.2.
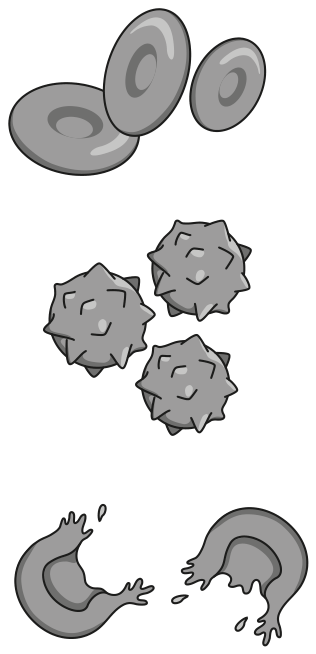
Fig. 1.2

Fig. 1.2

[ 2 ]

Question 1

Question 1(c)

Question 1(c)(iii)

(a)
(i)

Explain how oxygen in the capillaries reaches the cells in the eye.

[ 2 ]

Question 1

[Maximum number: 1]

Water is a very important molecule for all living organisms.

Question 1(a)

Question 1(a)(iii)

(a)
(i)

State one property of water that makes it useful to animals and plants.

[ 1 ]

Question 1

Question 1(c)

(a)

Some students investigated the effect of immersing red blood cells in different concentrations of salt solution.

They measured the diameters of samples of red blood cells and calculated the mean.
They then immersed each red blood cell sample in a different concentration of salt solution.
After two minutes they measured and calculated the mean of the samples again.
Table 1.1 shows the results.

Table 1.1

Table 1.1

[ 7 ]

Question 1(c)(i)

(i)

Calculate the percentage increase in the mean diameter of red blood cells that were immersed in the 0.8\% salt solution.
Give your answer to two significant figures.
.

[ 3 ]

Question 1(c)(ii)

(ii)

Explain the results for the red blood cells that were immersed in the 1.8 % salt solution.

[ 3 ]

Question 1(c)(iii)

(iii)

State why there was no change in the mean diameter of the red blood cells immersed in the 0.9\% salt solution.

[ 1 ]

Question 1(d)

(b)

State why red blood cells burst when immersed in pure water but plant cells do not.

[ 1 ]

Question 1(e)

(c)

State two uses of water in a plant.

1

2

[ 2 ]

Question 1

[Maximum number: 1]

Fungal cells and plant cells contain mitochondria.

Question 1(c)

(a)

A scientist investigated the effect of sugar on respiration in yeast cells.

One flask contained 100 cm3100 \mathrm{~cm}^{3} of a sugar solution and another flask contained 100 cm3100 \mathrm{~cm}^{3} of water. Both flasks contained the same mass of yeast. The temperature was maintained at 25C25^{\circ} \mathrm{C}.

The scientist used the apparatus shown in Fig. 1.1.

Fig. 1.1

Fig. 1.1

ig. 1.2 is a graph of the results of the investigation.

ig. 1.2 is a graph of the results of the investigation.

[ 1 ]

Question 1(c)(ii)

(i)

Suggest the reason for the oil layer in the apparatus shown in Fig. 1.1.

[ 1 ]

Question 4

[Maximum number: 1]

The diagram shows part of a plant root in the soil. The root is absorbing water.
At which labelled point is the water potential highest?

Question image

Question 4

[Maximum number: 1]

The diagrams show different levels of organisation in a plant. (Not drawn to scale.)

1

1

2

2

3

3

4

4

Which sequence shows the levels of organisation in order from smallest to largest?

A

42314 \rightarrow 2 \rightarrow 3 \rightarrow 1

B

43124 \rightarrow 3 \rightarrow 1 \rightarrow 2

C

34213 \rightarrow 4 \rightarrow 2 \rightarrow 1

D

32143 \rightarrow 2 \rightarrow 1 \rightarrow 4

Question 5

[Maximum number: 1]

The diagram shows two solutions that are separated by a partially permeable membrane.

Question image

In which direction will most water molecules move in relation to their concentration gradient?

A

from X to Y against their concentration gradient

B

from X to Y down their concentration gradient

C

from Y to X against their concentration gradient

D

from Y to X down their concentration gradient

Question 5

[Maximum number: 1]

Three equally sized pieces of potato were put into different concentrations of sucrose solution. One piece of potato was put into distilled water.

The concentrations of sucrose solution were 0.2gdm3,0.4gdm30.2 \mathrm{gdm}^{-3}, 0.4 \mathrm{gdm}^{-3} and 0.6gdm30.6 \mathrm{gdm}^{-3}.
The graph shows the change in mass of the potato pieces over a period of 60 minutes.
Which piece of potato was put into distilled water?

Question image

Question 5

[Maximum number: 1]

Which diagram shows the appearance of a plant cell several minutes after it has been placed in a concentrated solution of sugar?

A
Question image
B
Question image
C
Question image
D
Question image
0 selected