EduNinja

IGCSE Biology2.2 Size of specimensQuestion Bank

Question 1

Question 1(b)

(a)

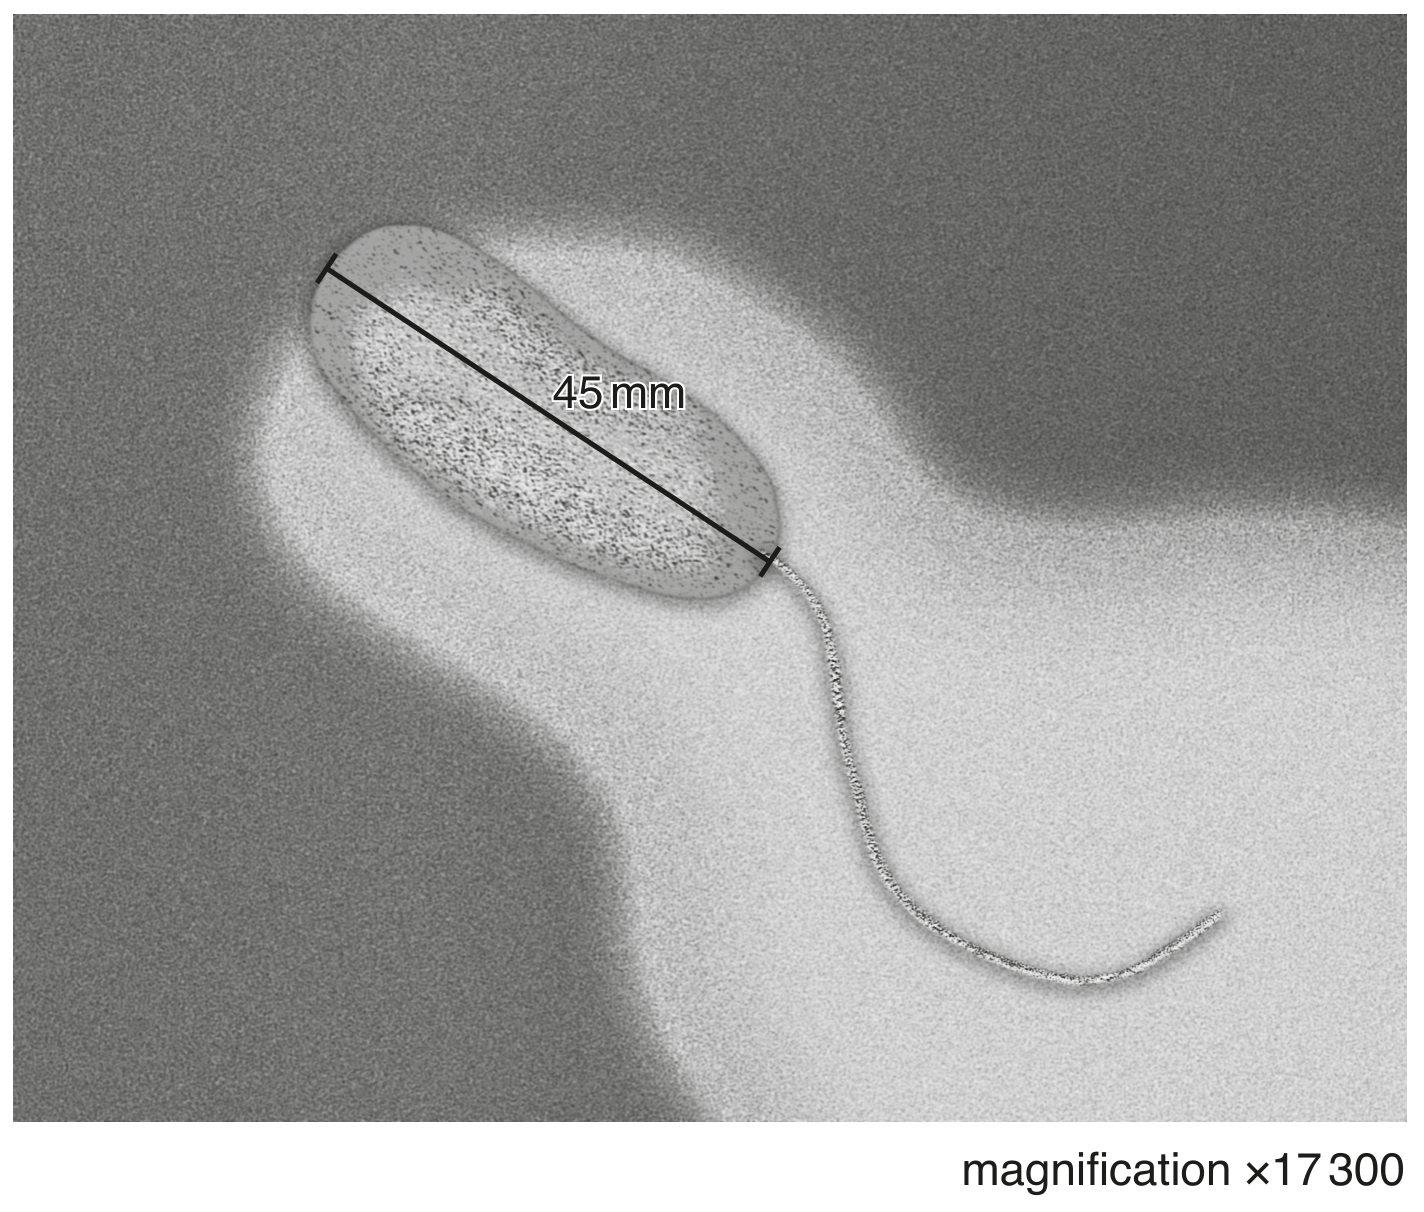
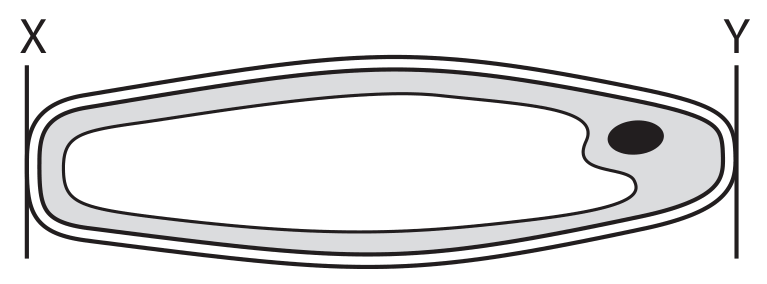
A student made a drawing of one Escherichia coli bacterium. Fig. 1.2 shows the student's drawing.
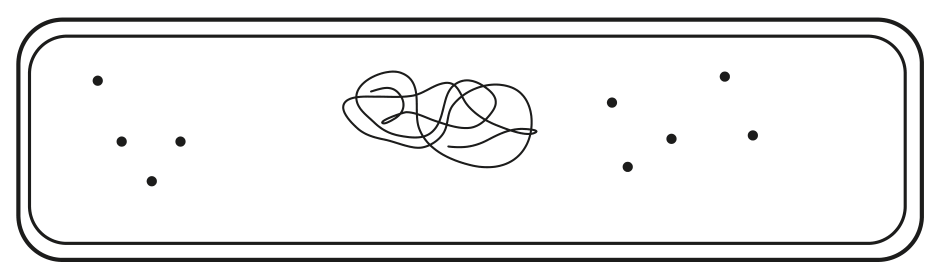
Fig. 1.2

Fig. 1.2

The actual length of the bacterial cell is 2μ m2 \mu \mathrm{~m}.

[ 1 ]

Question 1(b)(i)

(i)

Convert the actual length of the cell to millimetres. mm [1]

Question 1(b)(ii)

(ii)

State the other information that the student needs in order to calculate the magnification of the drawing in Fig. 1.2.

[ 1 ]

Question 1

Question 1(c)

(a)

Fig. 1.3 is a photomicrograph of Vibrio cholerae, the bacterium that causes cholera.

Fig. 1.3

Fig. 1.3

[ 2 ]

Question 1(c)(i)

(i)

Write the formula that would be used to calculate the actual length of the bacterium (not including the flagellum) in Fig. 1.3.

[ 1 ]

Question 1(c)(ii)

(ii)

The actual length of the bacterium shown in Fig. 1.3 is 0.0026 mm .
Convert this value to micrometres (μm)(\mu \mathrm{m}).
.
μm\mu \mathrm{m}

[ 1 ]

Question 1

[Maximum number: 1]

Fig. 1.1 shows a spongy mesophyll cell from the leaf of a plant. The arrows show the net direction of movement of carbon dioxide molecules during daylight.

Fig. 1.1

Fig. 1.1

Question 1(a)

(a)

The scale bar in Fig. 1.1 represents 0.01 mm .

Convert 0.01 mm to micrometres. μm\mu \mathrm{m}

[ 1 ]

Question 1

[Maximum number: 1]

Phytoplankton consist of many species of single-celled and many-celled algae.

Question 1(b)

(a)

A student investigated the species composition of the phytoplankton in a lake.
Fig. 1.1 shows some of the phytoplankton collected by the student.

Fig. 1.1

Fig. 1.1

The actual length of alga X is 0.19 mm .

Convert the actual length of alga X to micrometres. μm\mu \mathrm{m}

[ 1 ]

Question 3

[Maximum number: 1]

The diagram shows a high-power drawing of a plant cell.
The distance between X and Y on the diagram below is 80 mm .
The actual length of the cell between X and Y was 160μ m160 \mu \mathrm{~m}.

Question image

What is the magnification of the cell?

A

×50\times 50

B

×100\times 100

C

×500\times 500

D

×1000\times 1000

Question 3

[Maximum number: 1]

The diagram shows a mitochondrion. The scale bar shows the actual size of the mitochondrion.

Question image

The diagram is 70 mm long.
What is the magnification of the diagram?

A

×0.0007\times 0.0007

B

×70\times 70

C

×7000\times 7000

D

×70000\times 70000

Question 4

[Maximum number: 1]

The diagram shows a human liver cell.

Question image

The length of structure M on the diagram is 6 mm .
The magnification of the diagram is ×2000\times 2000.
What is the actual length of M ?

A

0.03μ m0.03 \mu \mathrm{~m}

B

3μ m3 \mu \mathrm{~m}

C

333μ m333 \mu \mathrm{~m}

D

12000 mm

Question 4

[Maximum number: 1]

The photomicrograph shows a plant cell. The length of line X Y is 90 mm . The actual length of the cell is 30μ m30 \mu \mathrm{~m}.

Question image
Question image

What is the magnification of the photomicrograph?

A

×300\times 300

B

×3000\times 3000

C

×33000\times 33000

D

×330000\times 330000

Question 4

[Maximum number: 1]

The diagram shows an epidermal cell from an onion plant.
The distance between X and Y on the diagram is 60 mm .
The actual length of the cell between X and Y is 150μ m150 \mu \mathrm{~m}.

Question image

What is the magnification of the cell?

A

×40\times 40

B

×250\times 250

C

×400\times 400

D

×2500\times 2500

Question 4

[Maximum number: 1]

The diagram shows a magnified image of a human liver cell with a mitochondrion labelled. The actual size of the liver cell is 20μ m20 \mu \mathrm{~m}.

The image size of the liver cell is 40 mm and the image size of the mitochondrion is 4 mm .

Question image

What is the actual size of the mitochondrion shown in the diagram?

A

0.002 mm0.002 \mathrm{~mm}

B

0.02 mm

C

0.2 mm0.2 \mathrm{~mm}

D

2 mm

0 selected